Plot Rings
Use Plot Rings to create a set of cross section plot files. An explosives report may be included with each cross section to form a complete plot.
All information required on the plot, such as triangulations and annotations, should be made visible before using this option. The blasthole database associated with the required sections should also be available and may be opened from in the Plot Rings option.
As the Plot Rings option manages the overlaying of the reports on the final plots, it must be directed where to place the reports. This is done through user-defined drafting styles created in the drafting database (drafting.dgd.isis).
The drafting database requires several standard boxes, including an internal and external box, to be laid on the sheet. In addition, the Plot Rings option also requires objects from which it can extract the extent and position of the reports on the plot.
Therefore objects, usually rectangles, must be created on the style sheet. For the explosives report the rectangle must be given the Object name 'UGB_EXREP' and Feature name 'NO_PLOT' and for the drilling report the Object name is 'UGB_REPORT' and the Feature name is 'NO_PLOT'. The Feature name 'NO_PLOT' tells the system not to draw the object on the final plot.
Refer to the Drafting Sheets documentation for information on how to create drafting styles.
This option can also be accessed by selecting the Plot Rings button  from the UG Ring Design toolbar.
Instructions
On the Underground menu, point to Ring Design, and then click Plot Rings.
Note: If you have not already loaded a blast database, you will be prompted to do so. For instructions on how to do this, see Open Blast Database.
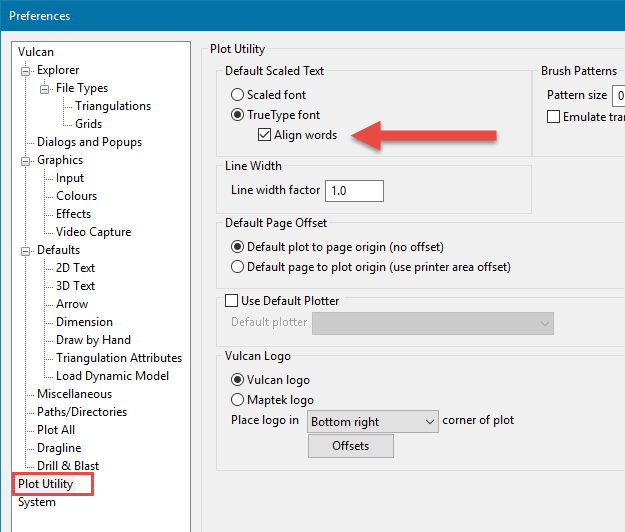
It is recommended that you check on Align words in Preferences > Plot Utility before plotting rings.
If you have not already set a current ring, you will be prompted to pick a ring. For instructions on how to do this, see Display Rings.
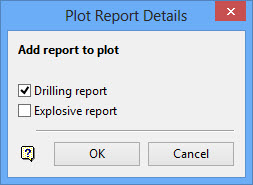
Use this panel to select which reports you want added to the plot.
Drilling report
Select this check box to add the drilling report to the plot. You must have an object in your border style named UGB_REPORT.
Explosive report
Select this check box to add the explosives report to the plot. You must have an object in your border style named UGB_EXREP.
Click OK.
The Pick Plot Template panel is then displayed. If you selected the Always use default template check box, which displays under the Plotting tab of the UG Blast Specification File panel, then this panel will be skipped and the Plot Attributes panel displays instead. Refer to the Create/Edit Specification File option for more information on setting a default drafting sheet.
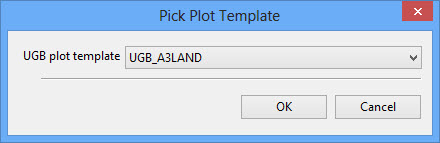
In the UGB plot template box, type or select the draft ing sheet that you want to use.
Click OK.
The Plot Attributes panel is then displayed.
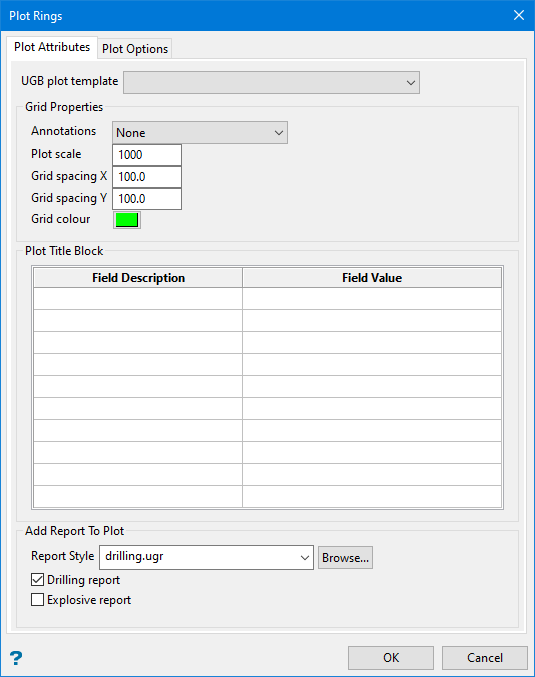
Annotations
In the Annotations box, select one of the following options:
| None | Selection of this option results in no grid or grid annotations being included in the plan. The two Grid spacing options will be shadowed, that is, cannot be selected. |
| Without crosses or lines | Selection of this option results in only grid value annotations. |
| With crosses | Selection of this option results in grid value annotations (as above) plus crosses at each grid intersection point. |
| With lines | Selection of this option results in full grid lines with annotations. |
Plot Scale
Enter the scale to be used. The number must be between 1 and 999.
Example: If the scale was 1:1250, a 1 cm object on the plot would be 1250 units in the real world.
Note: The default scale is derived from the plot defaults. Refer to the Plot All section of the Tools > Preferences option for more information.
Grid spacing
Enter the grid spacing for both the X and Y (or East and North respectively) axis.
Note: The default spacing is derived from the plot defaults. Refer to the Plot All section of the Tools > Preferences option for more information.
The unit of measure refers to the unit set (through the View > Windows > Create option) for the current window in the.
Grid Colour
Select a colour for the grid. The colour is selected from the current colour table. Use the Grid Properties button  or the Apply option (under the Analyse > Grid submenu) to display the grids on the screen.
Plot Title Block
This section lists the definable components of the plot's title block. The fields displayed through this section correspond to the chosen drafting sheet.
Add Report To Plot
You can define the UGR or multiple UGRs under Underground > Ring Design > Edit Report Format, then select which report to use during the session here.
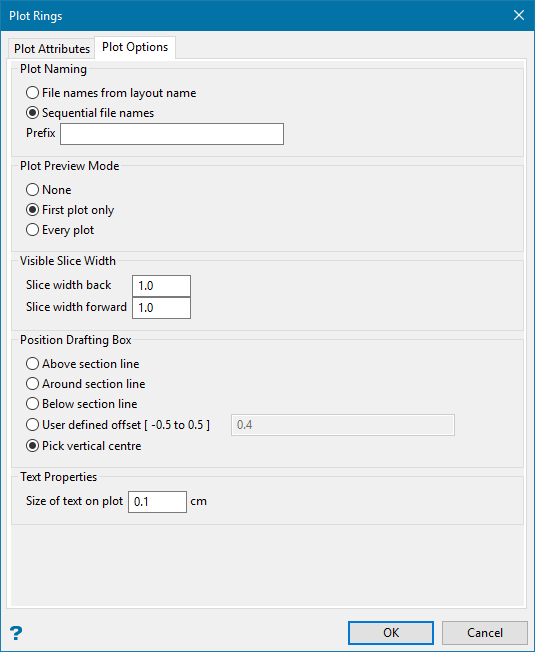
File names from Layout name
Select this option to have the plot file names generated from the layout name.
Example: RING001.PLOT, RING002.PLOT.
Sequential file names
Select this option to have the plot file names generated with a common prefix.
Example: PREFIX-1.PLOT, PREFIX-2.PLOT. The maximum size of the prefix is 10 alphanumeric characters.
Plot preview mode
This section of the panel to nominate a plot preview mode.
Visible slice width
This section of the panel to specify the slice widths. These values will be used to determine the depth of the plot, that is, how far away from the section plane objects must be before they become invisible.
Position drafting box
This section of the panel allows you define where the drafting box is to be positioned. The drafting box can either be positioned above, around or below a nominated section line. An offset, which needs to be between -0.5 and 0.5, or an indicated vertical centre point can also be used to define the position of the drafting box.
Text properties
Size of text on plot
Enter the size, in plotter units, of the text on the plot.
Note: This value will also be used to define the size of the point markers on the resulting plot.
Drafting scale
Enter, as a ratio, the drafting scale, which is used in conjunction with the text size entered above.
Example: If the text size is set to 0.10 (10 cm) and the drafting scale to 1:1250, text will appear on the screen the same size as an object that is 125 units long. Changing the scale, in either this option or the File > Plot > Plot All option to 1:1000 results in the text appearing the same size as an object that is 100 units long. Changing the scale to 1:10 000 results in a text size of 1000 and so forth.
Font
Select the required font from the drop-down list.
Click OK.
The Multiple Selection box is then displayed. This to select the section lines by category. Once selected, the plots are generated.
For each generated plot, the view will be changed and a box will be drawn showing the extent of the plot. Depending on the preview mode, you will be prompted to preview the plot, via the Plot Utility. If you do, then the name of the plot file displays in the middle of the Preview window.

