 Dashboard
Source file: dashboard.htm
The Dashboard is a central monitoring interface that displays near real-time statistics, trends, and key metrics on run-of-mine material movement and stockpile management through customisable widgets. It provides stakeholders—from operators to managers—with a clear overview of material management across the value chain, supporting analysis and optimisation of ongoing operations.
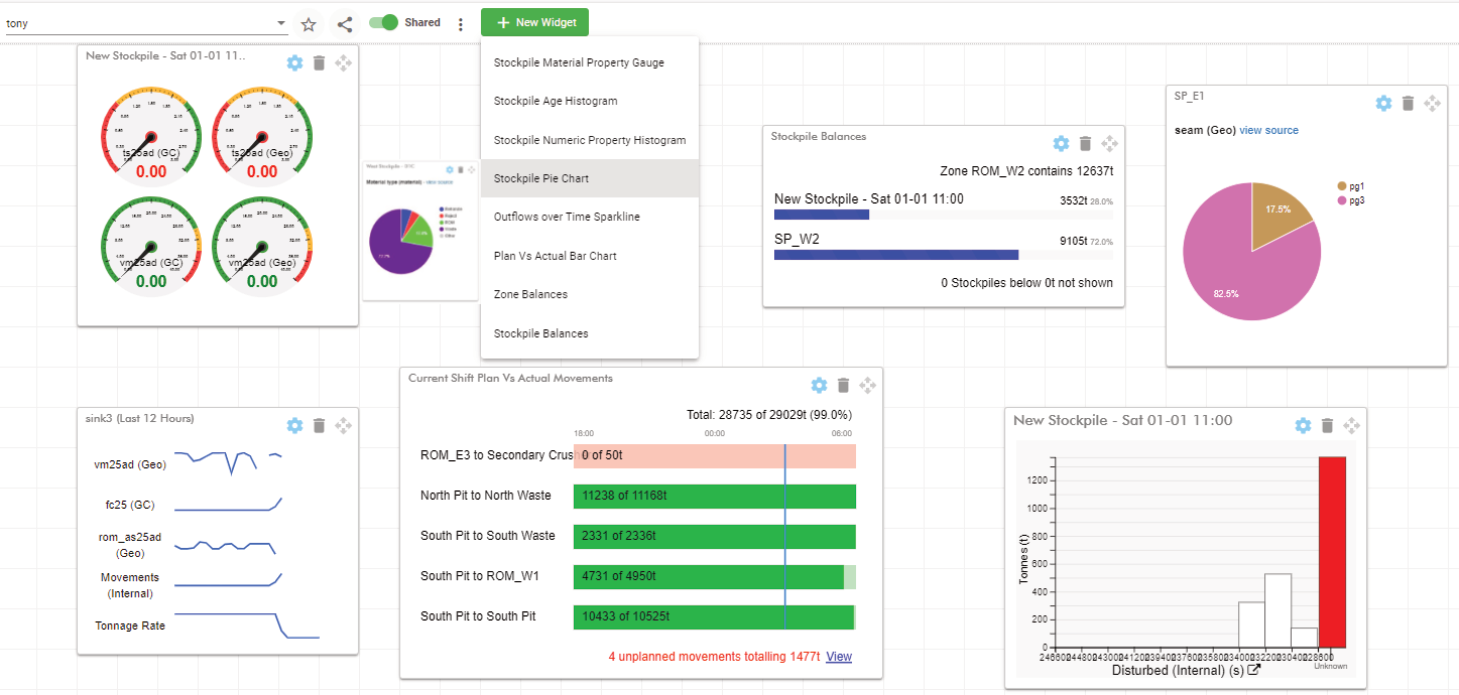
The Dashboard is the landing page users are directed to after logging in. New users see a default dashboard that is available to everyone. From here, users can view dashboards shared by others and create their own, as shown in the example below.
Making your own dashboard
To create a new dashboard, click  , then select
  . When prompted, enter a name in the Name field and click
  . When the new dashboard appears, add the widgets needed to monitor your specific operations.
Widgets
Widgets in the dashboard are customisable, interactive panels that display key operational data in near real time, supporting production monitoring and quick decision-making.
Typical use cases include:
-
Real-time awareness of critical KPIs and property levels
-
Operational trend analysis by area or stream
-
Quick detection of anomalies or quality issues
Dashboard widgets provide flexible, targeted visualisations of site production, quality, and operational status, using gauges, graphs, and plots that can be customised, repositioned, and shared to suit user roles and priorities.
Adding widgets to your dashboard
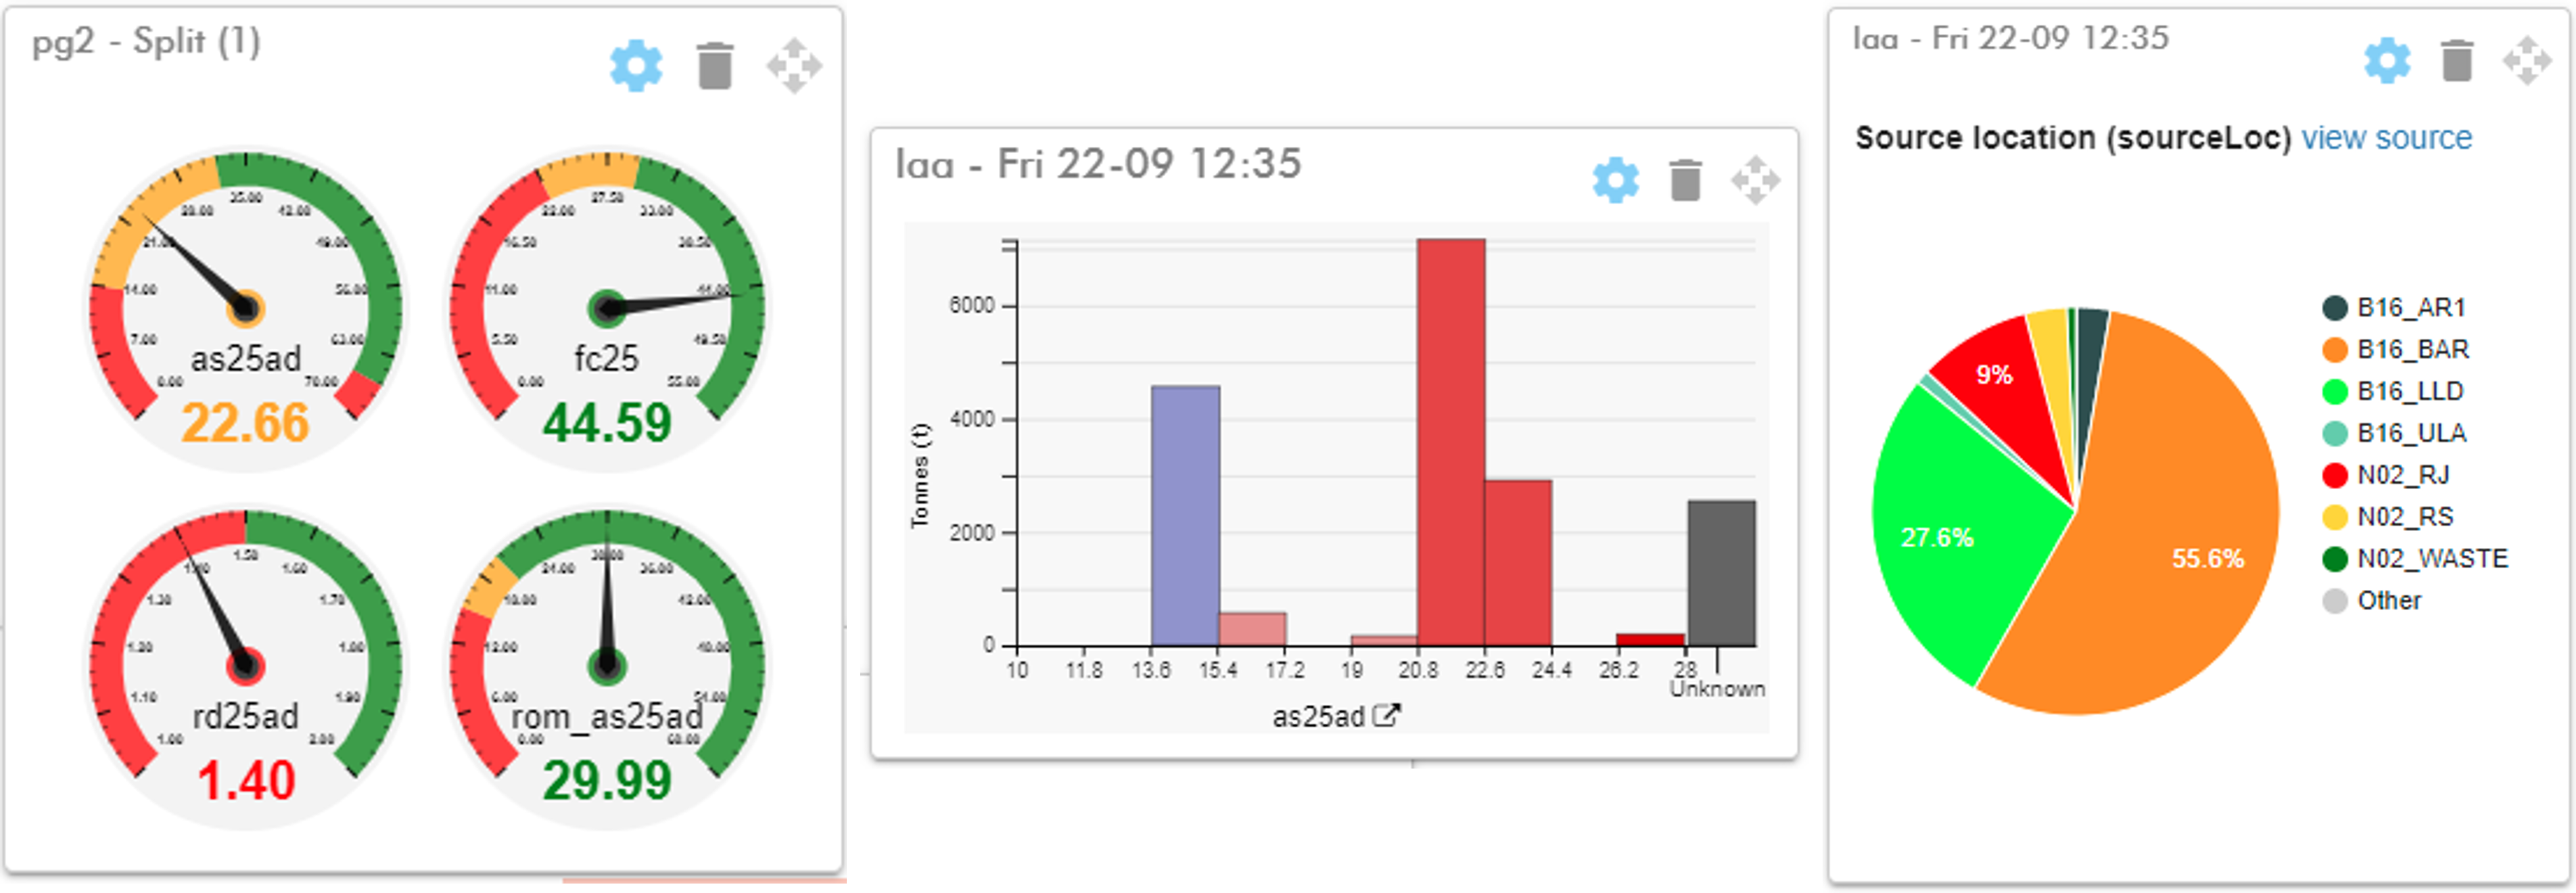
To add a new widget, click  show a drop-down list displaying the available options. Each has a thumbnail showing how the data will be visualised. Select the widget type you want to add to the dashboard.
-
Place your widget anywhere on the dashboard and use
 to move it into position. The widget snaps to dashboard grid lines, or aligns with adjacent widgets.
Configuring widgets
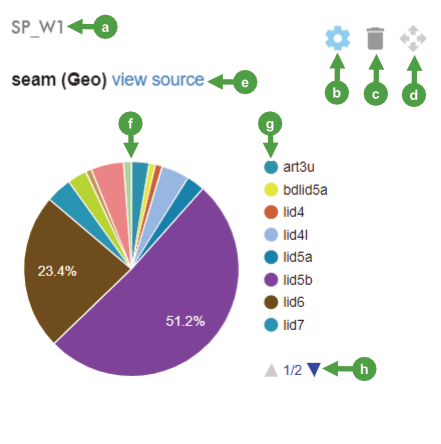
The widget below is an example of a user-configured pie chart. Though widgets vary in design, each have similar controls for setting them up and displaying information.
|
|


To configure your widget, follow these steps:
-
Click
 to open the editor panel.
 -
Under Widget title, enter a name or description. If you prefer, you can edit the title later.
-
Select the required dataset needed by the widget. They have at least one field, drop-down, or multiple selections, depending on the type of widget .
-
Click
 to close the editor, the widget will display the selected data.
Managing and interacting with widgets
Arrange the dashboard to suit your needs by adding, arranging, modifying, and deleting widgets to optimise your workflow.
-
Edit any personal, imported, or cloned widget by clicking
and updating each drop-down or field. -
Delete a widget by clicking
 to remove it from the dashboard immediately.
 -
If available, click <property>
 to open Material Properties Schema, and for widgets with the
  link, opens the Material Movements - Stockpiles in a new browser window.
How to use the dashboard
Material MRT supports multiple dashboards, giving you full flexibility to organise information for yourself or interactively with team members. You can also share, export, or delete your dashboards, as well as import and clone other user’s dashboards.
-
To view another dashboard, open the drop-down list and select one. If you are sharing a dashboard, shared is displayed next to the dashboards name. If another user is sharing their dashboard, the user’s name is displayed.
-
To set one of your own dashboards as your default, click
 to select it. The default dashboard displays
  next to the dashboard’s name.
 -
To copy the URL of any dashboard to the clipboard, click
 .
. -
To manage dashboards (where permitted), click
to open the following menu:
|
|
Rename the current dashboard. Shared or other users’ dashboards cannot be renamed. |
|
|
Create a new dashboard. When prompted, enter the name into the Name field and click |
|
|
Delete the current dashboard that you own. When prompted, click |
|
|
Cloning makes a copy of any user’s dashboard, complete with its widgets. When prompted, enter a name and click Cloned dashboards treated as your own and can be edited. |
|
|
You can Import other dashboards from a JSON file. Click to open a file explorer and select a compatible exported dashboard file. |
|
|
Export a dashboard belonging to you as a
for example:
where:
|


 . Dashboards you can't delete will be greyed out.
 .
.