

 Mine Plan
Source file: mine-plan.htm
Mine Plan is a set of tools that allows users to visually compare actual and designed schedules, query and examine schedule performance, and use this information to develop new scheduling strategies. The following tools are offered:
|
|
This tool visually compares actual material movements to the designed or scheduled run-of-mine movements. This information is displayed as arrows connecting the source and destination and colour coded to indicate its status. To learn more, see Mine Plan - Viewer. |
|
|
The Mine Plan Editor presents scheduled items and key statistics in a table, allowing users to add or edit schedules depending on permissions. It supports searching, filtering, and data export. While the editor focuses on schedule management, a separate chart provides comparisons of actual versus planned tonnage over time. To learn more, see Mine Plan - Editor. |
|
|
The Blend Plan Calculator allows you to formulate and test mine plans to create accurate schedules. To learn more, see Blend Plan Calculator. |
 Viewer
 Editor
 Blend Plan Calculator
Mine Plan - Viewer
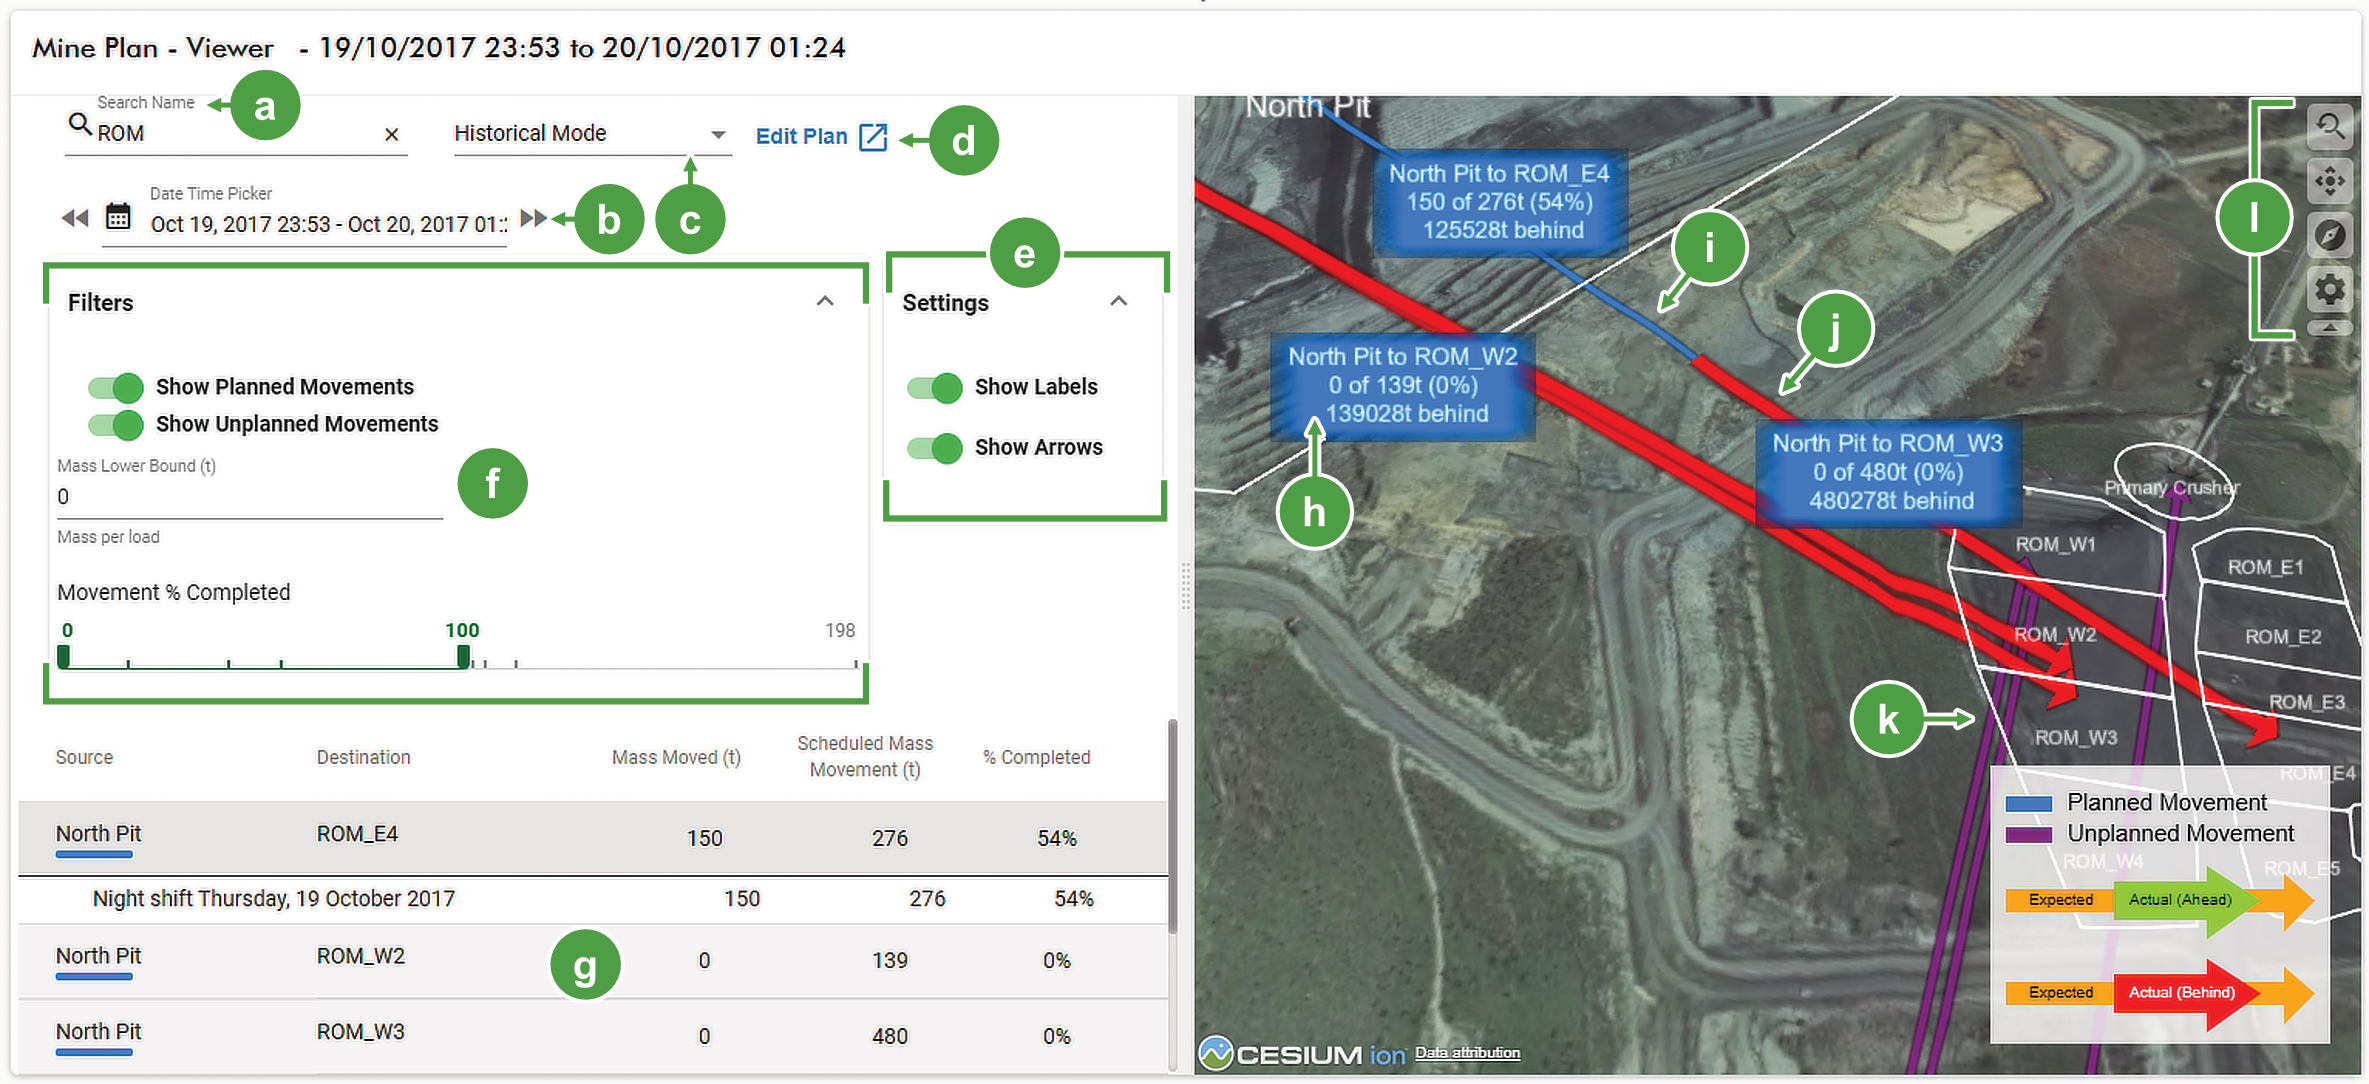
The Mine Plan Viewer displays an overview of scheduled and unplanned material movements for selected time periods using arrows colour-coded by zone. Arrows illustrate each movement’s source and destination, with additional overlays indicating adherence to schedule—greens for on/ahead, reds for behind, and purple for unplanned. Overlaid arrow length shows completion progress. Tools like search, shift selection, and a progress percentage bar allow filtering, and a material sources by shift table summarises which zones were active and key movement statistics.
|
|

|
Search bar for the material sources by shift table |

|
Material sources by shift table |

|
Date Time Picker with a time period set |

|
Schedule status label |

|
Historical mode / Latest mode selector |

|
Arrow—blue for a planned schedule |

|
Open Edit Plan in a separate browser page |

|
Progress incomplete, and behind schedule |

|
Collapsible show or hide labels and arrows section |

|
Unplanned schedule |

|
Collapsible filters section |

|
Viewer settings |
Setting the data for the mine plan viewer
To itemise movement of mass within a given period, follow these steps:
-
Select Latest Mode to for live and most recent data, or Historical Mode to analyse past movements. The viewer updates automatically when you change modes.
If Historical mode is selected, use the Date Time Picker to select a time range.
-
Optionally, use the Search field to find specific zones in the Source and Destination columns.
-
In the Filters drop-down set any of the following options, if required:
-
Enable Show planned movements and Show Unplanned Movements to display either in the viewer.
Note-
When only the Show Planned Movements toggle is active, arrows follow the zone colour.
-
When only the Show Unplanned Movements toggle is active, each scheduled source item is given a unique colour.
-
When both toggles are active, planned movement arrows are coloured blue and unplanned movements are purple.
-
-
If required, specify a minimum mass in Mass Lower Bound field. If ‘0’ is entered, any mass is included.
-
In the Movement % Completed bar, adjust the upper and lower limits using the sliders. Any data outside the upper and lower limits are excluded from view.
-
Interactive functions
The following actions are discretionary and available as need:
-
Click
 to open the Mine Plan Editor in a separate browser page, where you can add, modify, or remove plans. To learn more, see Mine Plan - Editor.
-
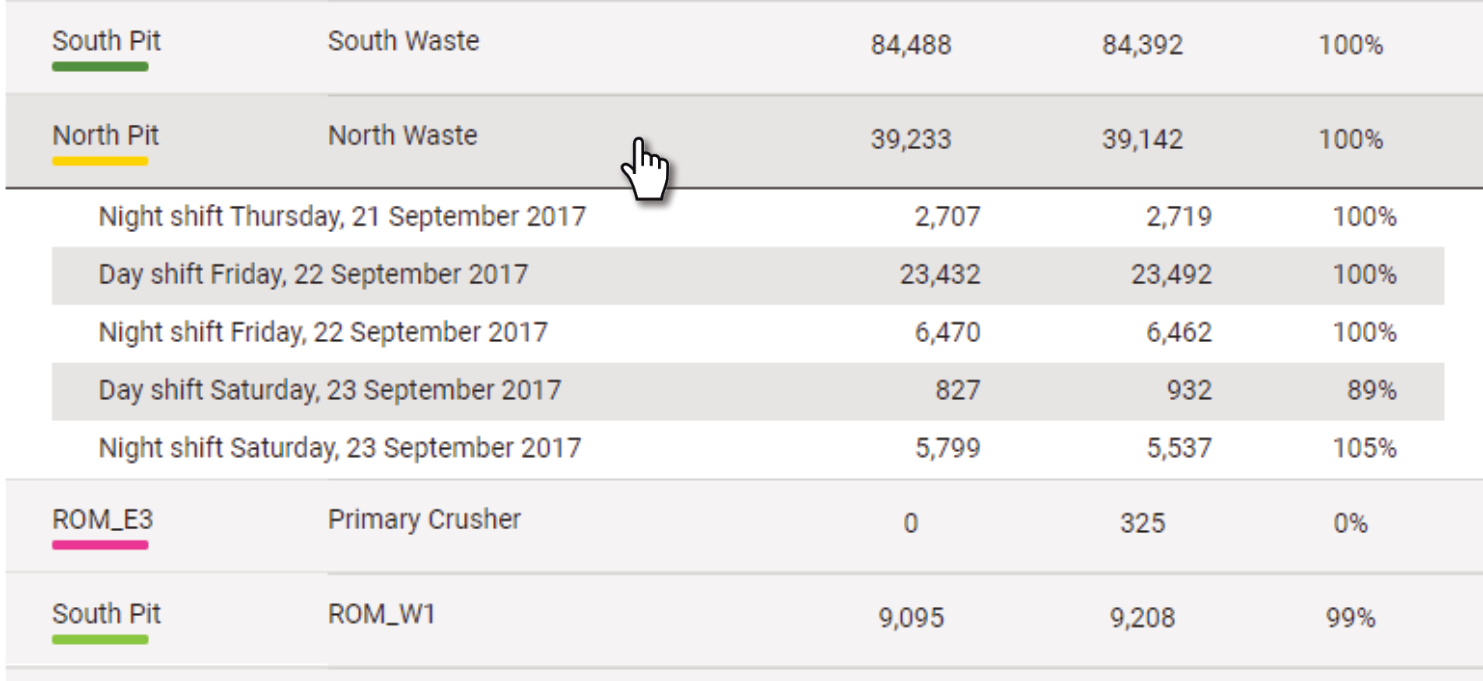
In the table, hover over a zone header to reveal attached schedules, as illustrated below. The viewer will interactively display a label for that zone, showing the source and destination, tonnage, level of completion, and conformance to schedule. Any other labels are temporarily hidden.
-
In the viewer, hover your mouse pointer over an arrow to display a label showing the source and destination, tonnage, level of completion, and schedule conformance. If many movement labels appear, disable Show Labels to reduce clutter. Similarly, to hide all other arrows, disable Show Arrows.
-
In the table, click to select a zone. Movements that occurred within are centred and zoomed to fit in the viewer and a label showing the source and destination, tonnage, level of completion, and schedule conformance is displayed. Any other labels are temporarily hidden.
-
Mine Plan - Editor
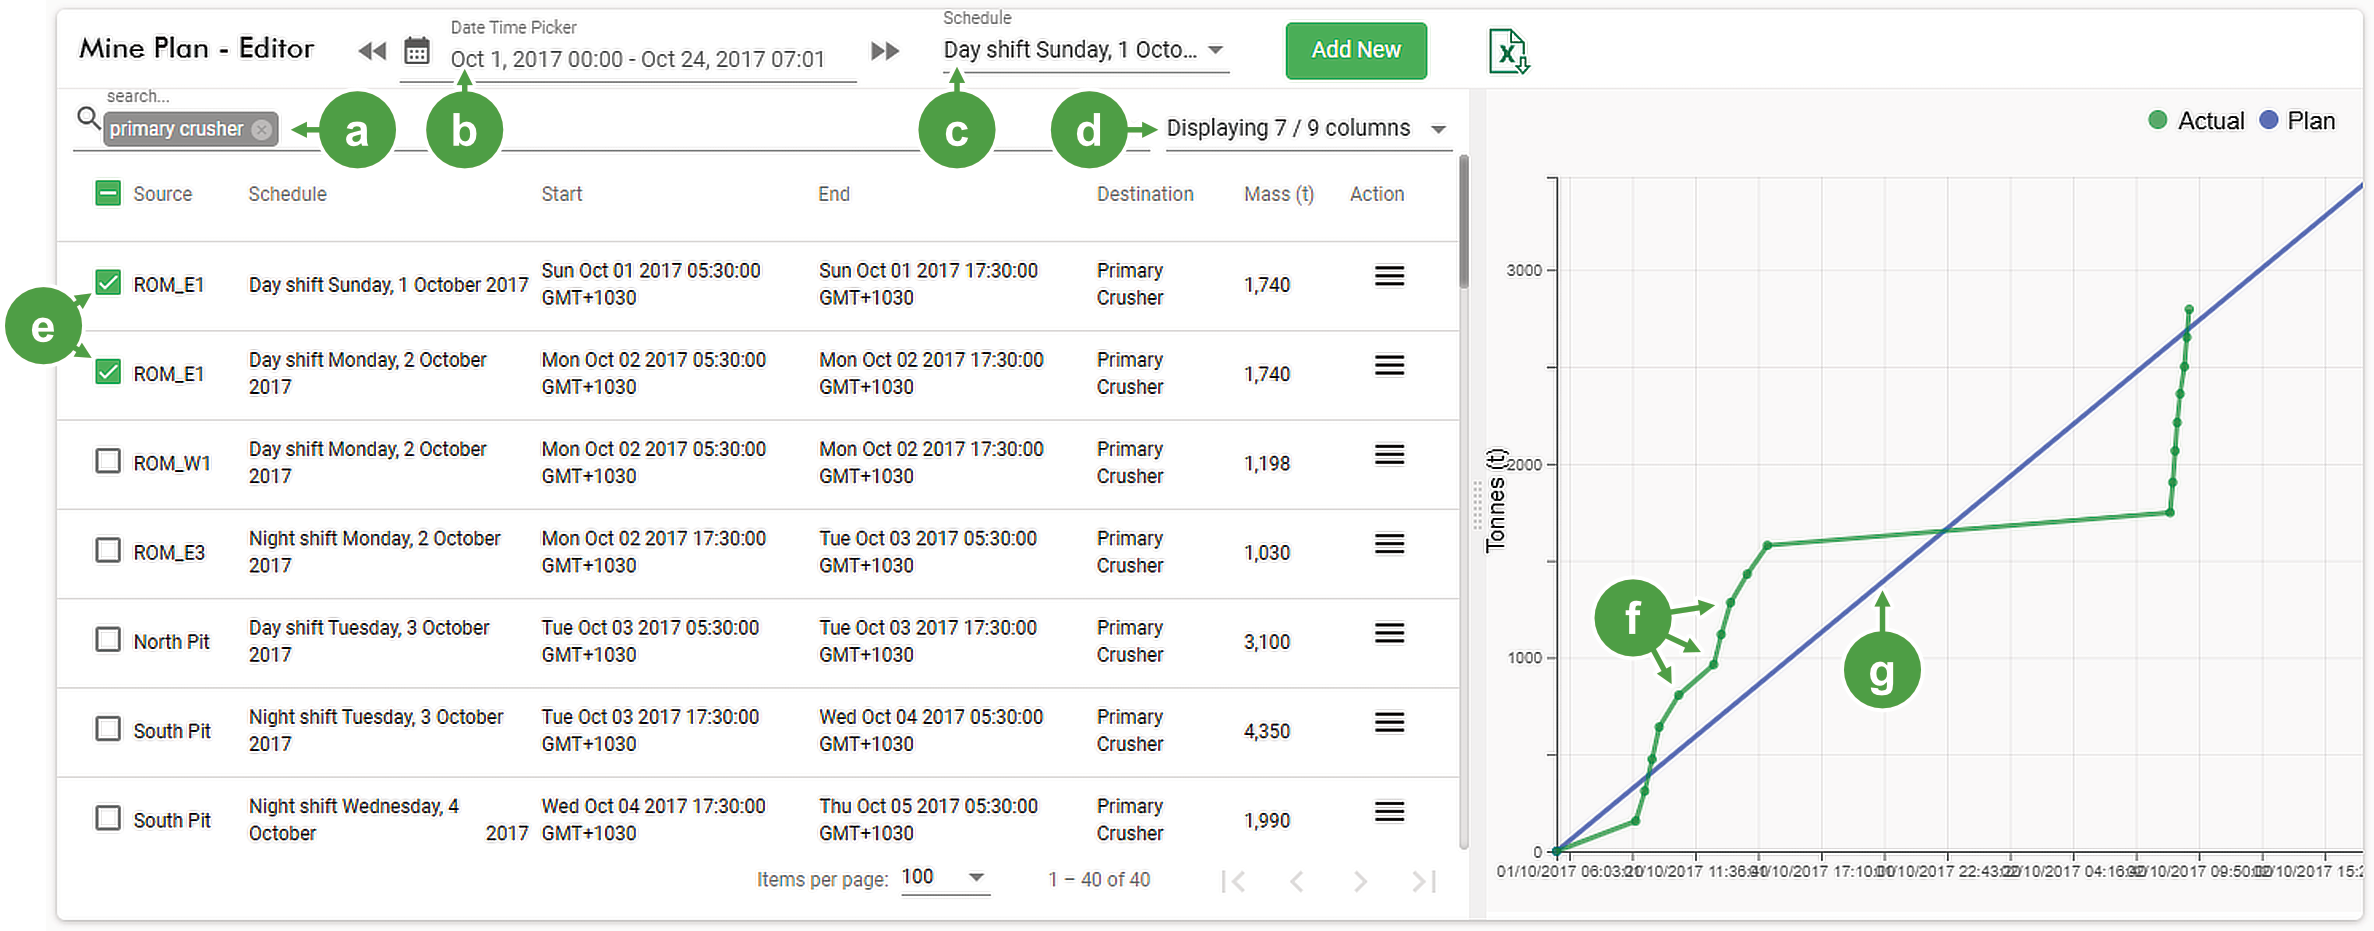
The Mine Plan - Editor is used for reviewing and managing schedules, which are presented in a customisable table. A chart provides a clear comparison between actual and planned tonnage for each schedule. Users assigned with the applicable roles can edit or delete existing schedules, or add new ones as needed.
Schedules can be filtered by time and session, and you can also enter keyword searches. The table lists all schedules within the search criteria, with related information presented in separate columns that can be included or removed based on user needs. All compiled data can then be exported to an Excel spreadsheet for further analysis.
The Mine Plan - Editor serves as the central workspace for maintaining mine plan scheduling data, enabling users to easily track, adjust, and verify progress through clear comparisons of actual and planned schedules.
Creating a custom schedule dataset
Follow these steps to display set schedules over a given time period:
-
Click the Time Date Picker and select a period of time to include schedules.
-
Click the Schedule drop-down list to select which schedules to include.
-
Optionally, type a keyword in the Search field to find items inside the table, excluding the Schedule, Start, and End columns.
-
Select which columns to include in the table by clicking the Displaying x / 9 columns drop-down, where x is the current amount selected. You can also reorder any item listed in the drop-down by dragging it up or down to change the order it appears in the table.
Note: Changing the lead column in the mine plan editor sets the primary grouping for the data. For example, if Schedule is the lead column, subordinate rows follow the selected schedule(s) using checkboxes. If you switch the lead column to Source, the table reorganises to group data by the selected source(s), updating subordinate rows accordingly. This lets you dynamically change the data hierarchy and focus based on the chosen column.
-
Select which rows to include using the checkboxes for the lead column.
|
|
|
|
Search keyword entry |
|
Items selected in the lead column |
|
|
Date Time Picker with 23-day period set |
|
Actual movements plotted in the tonnage v time chart |
|
|
Schedule drop-down with schedules selected |
|
Planned progress rate in the tonnage v time chart |
|
|
Columns drop-down with 7 of 9 selected |
Modifying a schedule
To modify a schedule in the table, follow these steps:
-
On the row that you want to change, click
 , then select
  .
. -
In the Schedule panel update the following information:
Date Time Picker
Adjust the time period if required
Source Category
Select the source category from the drop-down list
Source
Select a specific source from the drop-down list
Destination Category Select the type of endpoint where the material will be deposited
Destination
Select the specific destination where the material will be deposited
Mass Enter the quantity of material scheduled to be moved
-
Click
 to update the schedule and close the panel. The system will perform a playback to update downstream effects and send notifications as they occur.
Deleting a schedule
To delete a schedule, select its row on the table and click , then select  . The selected item will immediately be removed.
Adding a new schedule
A schedule created in the mine plan editor is labelled as local in the list of schedules. Local schedules represent specific planned actions added or adjusted interactively for day-to-day or shift-level scheduling. By comparison, blend plans are more strategic, involving configuring blend targets and allocating multiple material sources to meet those targets.
To add a new local schedule, follow these steps:
-
Click
 to open the Schedule panel.
 -
In the Schedule panel, enter the following information.
Date Time Picker
Enter the time period or shift
Source Category
Select the source category from the drop-down list
Source
Select a specific source from the drop-down list
Destination Category Select the type of endpoint where the material will be deposited
Destination
Select the specific destination where the material will be deposited
Mass Enter the quantity of material scheduled to be moved -
Click
to update the schedule and close the panel. The system will perform a playback to update downstream effects and send notifications.
Exporting your data to Excel
When you have selected and arranged your data, click  to export the file to your computer as a Microsoft Excel (.xlsx) spreadsheet, as shown in the following example:
Schedules_2017-09-22T18_00.xlsx
where:
-
Schedules_is the dataset prefix. -
2017-09-22is the scheduled date expressed as a year-month-day sequence. -
T18_00 is the scheduled end time expressed as the
Tprefix followed byhours_minutes.
Blend Plan Calculator
The Blend Plan Calculator is designed to create target feed objectives based on specific material properties. It allows you to configure blend targets by defining acceptable and marginal value ranges for various material properties. After setting up these targets, allocate multiple material sources—such as stockpiles, zones, or polygons—to satisfy the blend requirements.
You can fine-tune the blend, set mass targets, and save multiple blend plans for comparison and optimisation by including or excluding materials. Once a blend plan is finalised and saved, it can be uploaded as a local schedule within the Mine Plan, integrating the blend strategy into operational scheduling.
Creating a blend target
The blend target defines the materials and their desired property ranges, such as grade, moisture, or other ore content. Each property has acceptable, marginal, and unacceptable ranges, allowing you to control what qualifies as a good or poor blend. Once configured, the blend target serves as a benchmark for the Blend Plan Calculator to combine material from multiple sources to meet the targeted property and tonnage (or mass) requirements.
To create a blend target, follow these steps:
-
Select the Target tab.
-
Enter the blend target name into the Blend target text field.
-
Click
 to open the properties editor.
 -
Select a property from the Property drop-down.
-
Under Acceptable Value Ranges click
 to set your From and To value range.
 -
Repeat step 5 to enter values for Marginal Value Ranges and Unacceptable Value Ranges.
-
Repeat steps 3 - 8 for each property you wish to add to your blend target.
-
Click
 to save your blend target.
Managing blend plan targets
The buttons below perform the following operations:
|
Blend target selection |
Open the drop-down and select an existing blend target. |
|
|
Add new blend plan targets. For more information, follow the steps in Creating a blend target. |
|
|
Save a new blend target. If you are working on an existing blend target, a dialog with the message “This will overwrite the current target. Are you sure?”: Select either:
|
|
|
Save an open blend target as a new one. This button is only available when you have opened an existing blend target. |
|
|
Remove your blend target from the list. A confirmation dialog appears before that item is deleted. |
|
|
Add your blend plan as a local schedule. To see this button, select a plan from the Blend Plan drop-down. |
| Displaying x float properties |
Open this drop-down to select other existing source properties. You will need to assign value ranges as described in Creating a blend plan. Note: <x> is the number of selected properties displayed in the drop-down. |
 Add new
 Save as new
  Delete
Blend plans
A Blend Plan defines a selection of sources—such as stockpiles, zones, or polygons—from which materials with the desired property ranges are combined to fulfil the required quantity of material for movement through the run-of-mine production chain. It enables users to simulate, optimise, and schedule the delivery of material blends that meet production and quality objectives. In other words, a blend plan identifies which sources best satisfy the blend target and can then be applied to a schedule for operational execution.
Creating a blend plan
To create a blend plan, select the Plan tab, then follow these steps:
-
Select the blend target that you want to add the blend plan to. If you haven’t created one yet, follow the steps for Creating a blend target.
-
Enter the name of your blend plan in the Blend plan field and click
to save your changes. -
From the Selected Sources section, click
 and select one of the following options:
-
Manual: When adding a manual selection to a blend plan, you are defining a theoretical or arbitrary source rather than selecting an existing physical source like a stockpile, zone, or polygon. Instead, you create it by entering a name ( the default is "Manual 1"), then specifying the mass and % of Total Mass along with the material property values. This allows you to model custom or hypothetical material contributions that can be included in your blend plan for simulation, optimisation, or scheduling purposes.
-
Polygon: Each polygon is a defined area within the mine and can reside inside larger zones. Material MRT associates each polygon with underlying geological, geospatial, and material property data—such as assay results, block model data, or resource characteristics—based on its spatial coordinates.
-
Stockpile: Click on a stockpile in the viewer to select it. Material within the stockpile is included in your plan.
-
Zone: Click on a zone in the viewer to select it. Material within the zone is included in your plan.
-
-
Click
to update changes to your blend plan. After creating your blend plan, your blend plan sources appear in the Selected Sources section.
- Add additional sources as needed, using . You can include any combination of sources.
- Select or deselect sources by clicking on the row or, on its checkbox.
- Delete a source by clicking
 .
. - In the Combined Sources section, the gauges or bar charts provide a conformance overview, allowing you to find shortfalls and surpluses, allowing you to change your sources to meet the mine plan. You can also refine your mine plan by setting lower and upper limits in the Mass target fields.
- In the Remaining Material section, a table listing the source zones and the mass of selected properties. You can add more zones via the Zones drop-down and properties in the table column selector to this table to provide an overview by zone and tonnage of material properties without making a blend plan.
- Enable the Show by stockpile checkbox to list all stockpiles from the selected sources, showing which ones meet or lack the desired resources.
- Add additional sources as needed, using
Adding a blend plan to a schedule
A local blend plan is one that is created by a user and annexed to existing schedules, similar to the Mine Plan Editor. The plans are labelled as Local when listed. To schedule a blend plan, do the following:
-
Select the blend plan from the Blend plan drop-down list.
-
Click
 to open the Schedule dialog box.
 -
In the Time field, select the time or shift to add your schedule to. You can use the drop-down to select a preset entry, or create a custom time using the Date Time Picker.
-
In the Destination category field, select the destination type—such as a stockpile, sink, waste dump—from the drop-down list.
-
In the Destination field, select the destination from the drop-down list.
-
Click
 to close the dialog box. Your local schedule is added to the mine plan.
Viewing cross sections in the viewer
The cross section tool is a stand-alone utility that allows you to generate and examine a detailed cross-sectional profile of the material, providing a visual and quantitative way to inspect and understand material stacks within the stockpile.
Click  to start the tool, then click in the viewer to place section points P1 and P2. The elevation profile appears in the viewer.
If required, use the mouse to adjust the positions of P1 or P2, or drag the section line at point C to move the it in any direction without changing its orientation.
To view the cross section in detail, click  . A new browser page opens . For more information on this tool, see Viewer > Viewer tools.
Viewing stockpiles in different colour schemes
To change stockpile colouring, click  to open the Stockpile Colouring panel and select one of the following radio buttons.
|
Height |
Use the system default or a customised colour scheme |
|
Vertical Column |
The weighted average of the selected property is applied over all other material in the vertical column extending to the floor of the stockpile. |
|
Stockpile |
The default system colour scheme for the selected property, or create your own. |
The Coloured by button label changes to the display the selected colour scheme.
In the Stockpile Colouring panel click  to create your own colour map. For more information, see Getting Started > Creating or modifying colour maps.
