

 Measurements
Source file: measurements.htm
The Measurements group includes tools for managing terrain and stockpile models, they help ensure that the ground and stockpile models accurately reflect the latest surveyed or designed topography and volume measurements. It also includes tools that allow the analyst to compare assayed data of various grades with results supplied from the lab or analyser. The following tools are summarised below:
|
Terrain Management |
Manage and update the terrain surfaces as up-to-date models become available. To learn more, see Terrain Maintenance. |
|
Stockpile Surfaces |
Manage and import stockpile surfaces as up-to-date models become available. To learn more, see Stockpile Surfaces. |
|
Lab Results |
Examine and modify lab results from a selected shift based on any material property of interest. To learn more, see Lab and Analyser Results. |
|
Analyser Results |
Examine and modify analyser results from a selected shift based on any material property of interest. To learn more, see Lab and Analyser Results. |
Terrain Maintenance
The Measurements - Terrain Surface Maintenance page is used to manage and update the base terrain (the ground surface) in the mine environment. It supports importing new survey surfaces, ensuring that the ground model accurately reflects the latest surveyed or designed topography. This is crucial for accurate placement of stockpile cuboid blocks with respect to the base surface.
Viewing and managing existing surfaces
To display data in the Terrain Maintenance page, select the Manage tab then select a time interval using the Date Time Picker. You can move forwards or backwards to previous or subsequent intervals to view terrain surfaces that have been imported at different times. When available, surfaces are listed in a table along with related information about each terrain surface file, such as import time and source.
-
Hover over a row in the table to highlight the terrain surface in the viewer.
In the viewer, surfaces appear as polygons overlaid on the terrain, allowing you to visually assess and compare the ground surface with the current terrain.
Searching and filtering the surface files table
To find items in the table, enter keywords in the search field. You can also select which columns to include using the Displaying x / x columns drop-down.
Deleting terrain surfaces
To delete an obsolete terrain surface, select its row in the table and click  . When prompted, click
  to confirm.
Adding and selecting new terrain surfaces to import
Select the Import tab, in here a drop zone accepts files formatted as .00t, .maptekobj, .dxf, or .obj. Click inside the drop zone to open a file explorer, then select the files, or drag them in. As files are added, they appear as tiles in the drop zone and a list is also created. The search bar allows you to filter your list if many files are added.
-
Remove a file that you don’t want to import by hovering over its tile in the drop zone then clicking
 .
. -
Remove one or more files by selecting in the list then clicking
 . Selected files are removed from the list and drop zone.
 -
Click
 to remove all files from the list and drop zone.
Importing the terrain surface files
To add terrain surface files to the system, select them from the list, then click  to immediately upload them. A notification is posted for each surface that is applied.
Stockpile Surfaces
The Measurements - Stockpile Surfaces page is used to import, maintain, and remove stockpile surface models. Stockpile surfaces are digital representations of the shape and extent of each stockpile at a given moment. They work with terrain surfaces to define the stockpile’s form and extents over the spatial foundation of the terrain.
Viewing and managing stockpile surfaces
To display data in the Stockpile Surfaces page, select the Manage tab then select a time interval using the Date Time Picker. You can move forwards or backwards to previous or subsequent intervals to view stockpile surfaces that have been imported at different times. When available, surfaces are listed in a table along with related information about each file, such as the upload and application time.
-
Hover over a row in the table to see a tooltip showing the stockpile model’s input parameters and the initial and final results for missing and excess volumes. This information allows you to verify the effects of applying the model before committing it to the system.
-
Click on a row to view the stockpile model
In the viewer, click  enable one of the following modes:
-
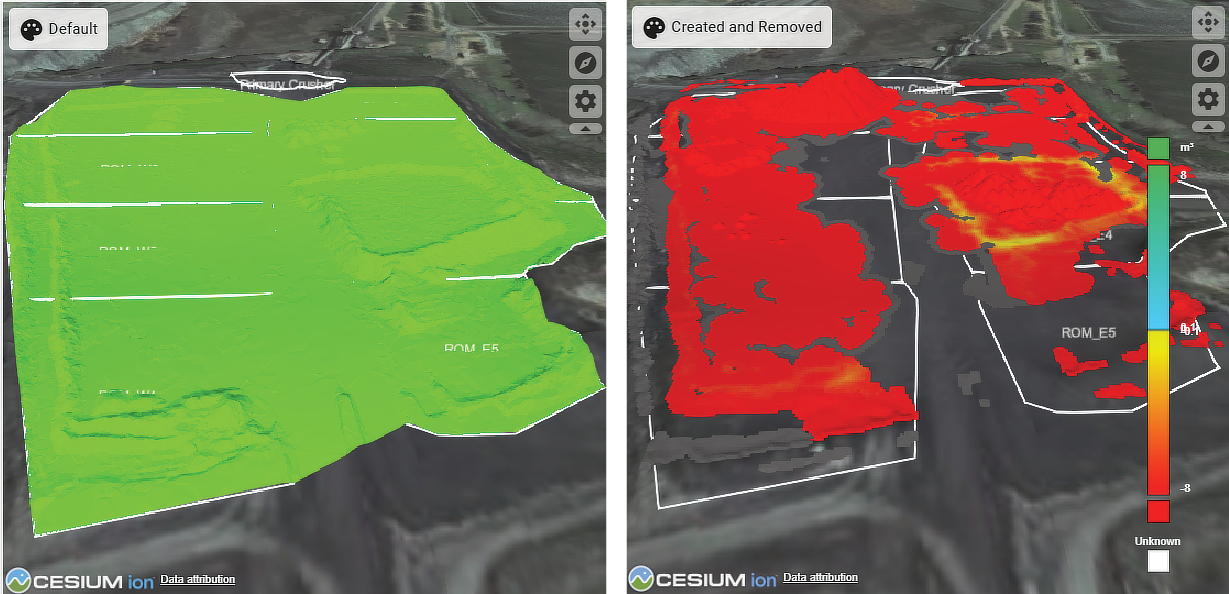
Default displays the actual shape of the stockpile in a single colour
-
Created and Removed displays a representation of where material has been dumped or removed, and a colour map indicating post-application excess and deficits.
|
|
Searching and filtering the stockpile files table
To find items in the table, enter keywords in the search field. You can also select which columns to include using the Displaying x / x columns drop-down.
Deleting stockpile surfaces
To delete an obsolete stockpile surface, select its row in the table and click . When prompted click to confirm.
Applying new Stockpile surfaces
To apply a stockpile surface, follow these steps:
-
Select the Manage tab.
-
Select which stockpile surfaces to apply from the table.
-
Enable the Available for Cross Section check box if applicable.
When Available for Cross Section is enabled, the stockpile can be selected for use with the cross section analysis tool in the viewer. Users can draw a cross section line over the enabled surface, analyse its profile and content, and compare it with scan data or other models.
-
Click
 to open the Apply selected scan/s with the following parameters panel. Then apply the settings as itemised below.
 If you import a scan into an area where no material has been dumped, material is created with the configured properties and density, matching the shape of the scan. If material already exists, it will—within the limits configured when applying the scan—swell or compress, move laterally, and create or remove material to match the applied scan.
Density Enter the bulk density appropriate for the stockpile material—derived from site tests, historical averages, published values, or calculated as D=W/V, if the mass (W) and volume (V) are known. This ensures a reliable conversion from scan-based volume to stockpile mass in Material MRT. Stockpiles Select a stockpile from the drop-down to inherit those properties 
Click to populate the stockpile surface using the data inherited from selection from the Stockpiles drop-down. 
Click the button to open the properties editor. If a stockpile was not selected from the Stockpiles drop-down, you can manually enter your own. 
Click the button to reset the Stockpiles drop-down selection and any properties that were edited. Minimum volume multiplier This is the maximum compression factor applied to material when fitting the scan. Maximum volume multiplier The maximum swell factor applied to material when fitting the scan. Minimum material density The minimum density value for material expanded while fitting the scan. Maximum allowed variation
from existing materialIf the vertical distance between the material model and the scan surface is less than the value entered, the material model will not be adjusted at this point. Maximum allowed variation
from terrainIf there is no existing material and the vertical distance between the terrain and the scan surface is less than the value entered, the material model will not be adjusted at this point. Maximum horizontal distance
to move materialThe maximum distance material can be relocated when fitting the scan. -
To complete applying scans click
 .
.
Uploading stockpile surfaces
Stockpile surfaces are derived from point clouds acquired using scanners, photogrammetry, or other devices, and converted into models with coordinate references—typically created in 3D point cloud processing software such as Maptek PointStudio.
To upload stockpile surfaces, open the Import tab. The drop zone accepts files in .00t, .maptekobj, .dxf, or .obj formats.
-
Click inside the drop zone to open a file explorer and select your files, or drag the files directly into the drop zone.
As files are added, they appear as tiles in the drop zone and are listed below. Each stockpile surface is assigned a colour in the list and displayed in that colour in the viewer for easy identification.
-
Click on a listed item to centre its model in the viewer.
Filtering or removing uploaded stockpile surfaces
The following tools allow you to manage uploaded stockpile models from the import tab:
-
Use the search bar to filter your list by file name.
-
Remove a file individually by hovering over its tile in the drop zone then clicking on
. -
Remove files by selecting their checkbox from the list, then clicking
. -
Click
to remove all uploaded files immediately.
Importing stockpile surfaces
Importing is the final stage before the stockpile surfaces are applied, triggering Material MRT to perform the necessary calculations to update the system. To import stockpile models, select them using the checkboxes, then click . When the confirmation appears. Click  close the panel.
|
|
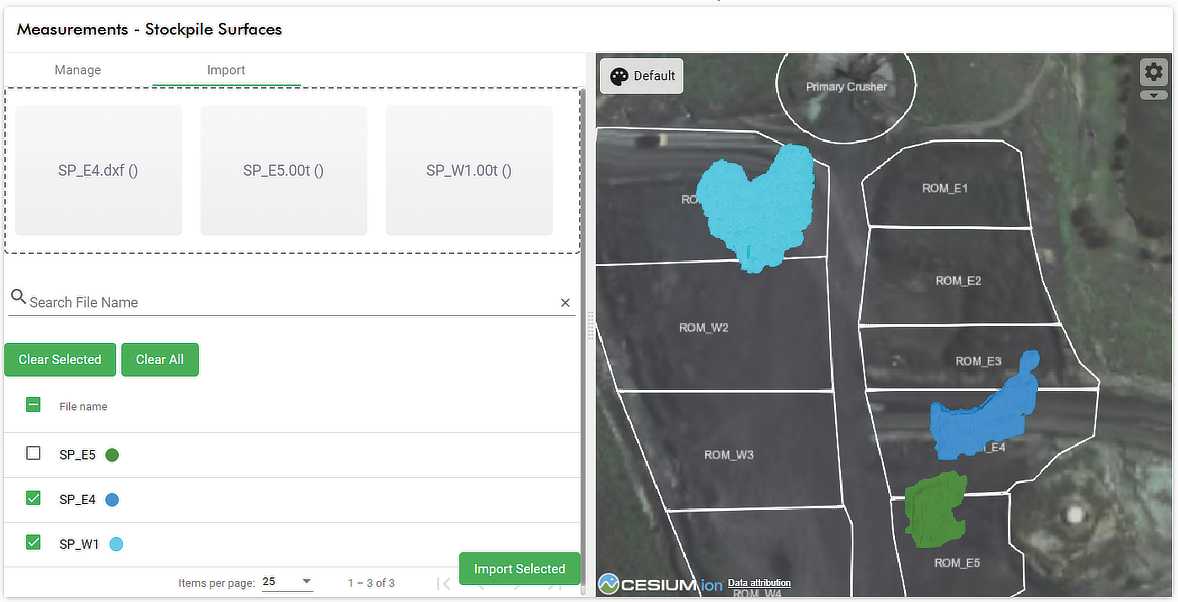
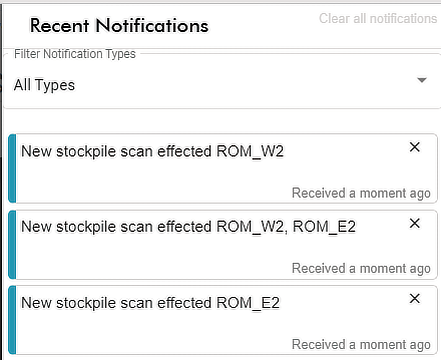
After importing stockpile surfaces, you can apply them to update the system and trigger notifications, as shown below. Follow the steps in Measurements > Importing stockpile surfaces.
|
|
|||
|
Notifications sent after importing stockpile surfaces |
Lab and Analyser Results
Both pages use a table-like layout where each row represents a zone or sink—such as a crusher, conveyor, or other destination. For each row, a horizontal time bar depicts the shift. Along these bars, sample results—lab analyses or analyser readings—are visualised as coloured segments. Each segment represents a specific sampling interval, such as 6-hourly for laboratory samples, and more frequently for analyser samples. The segment colours follow the colour map assigned to the relevant assayed property, making material property changes and trends immediately visible by time and operational zone.
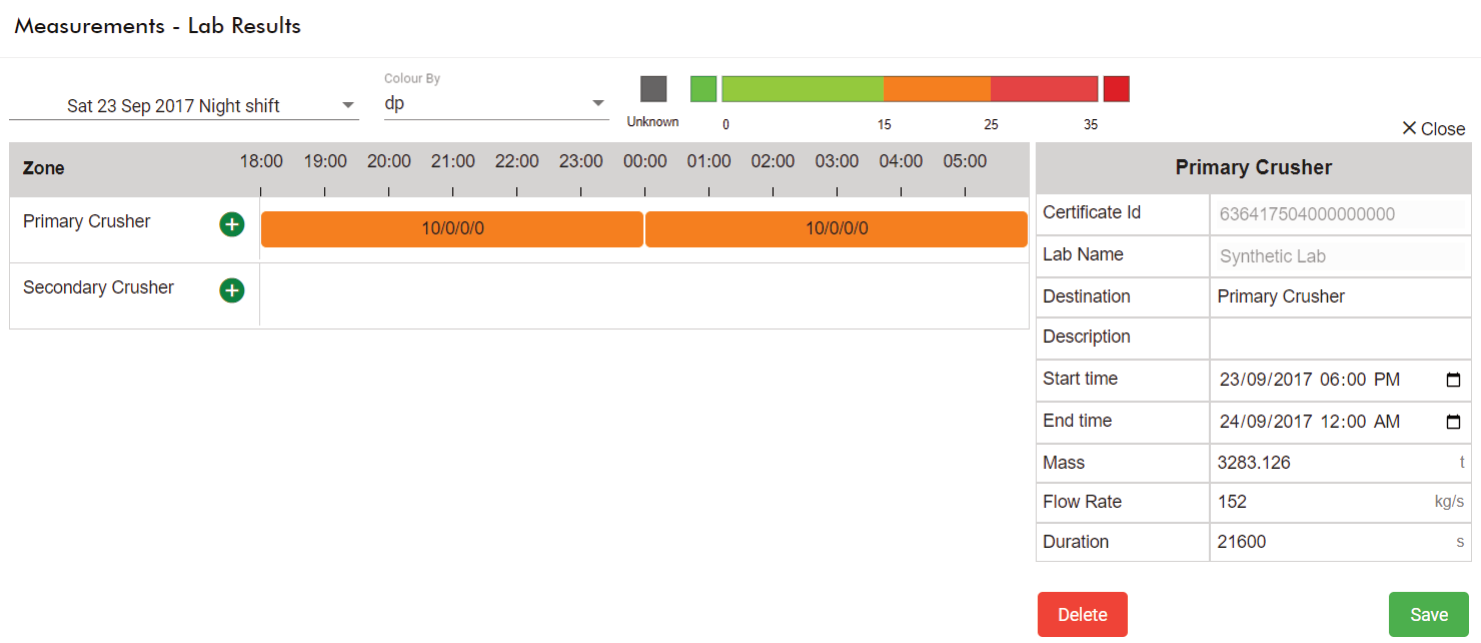
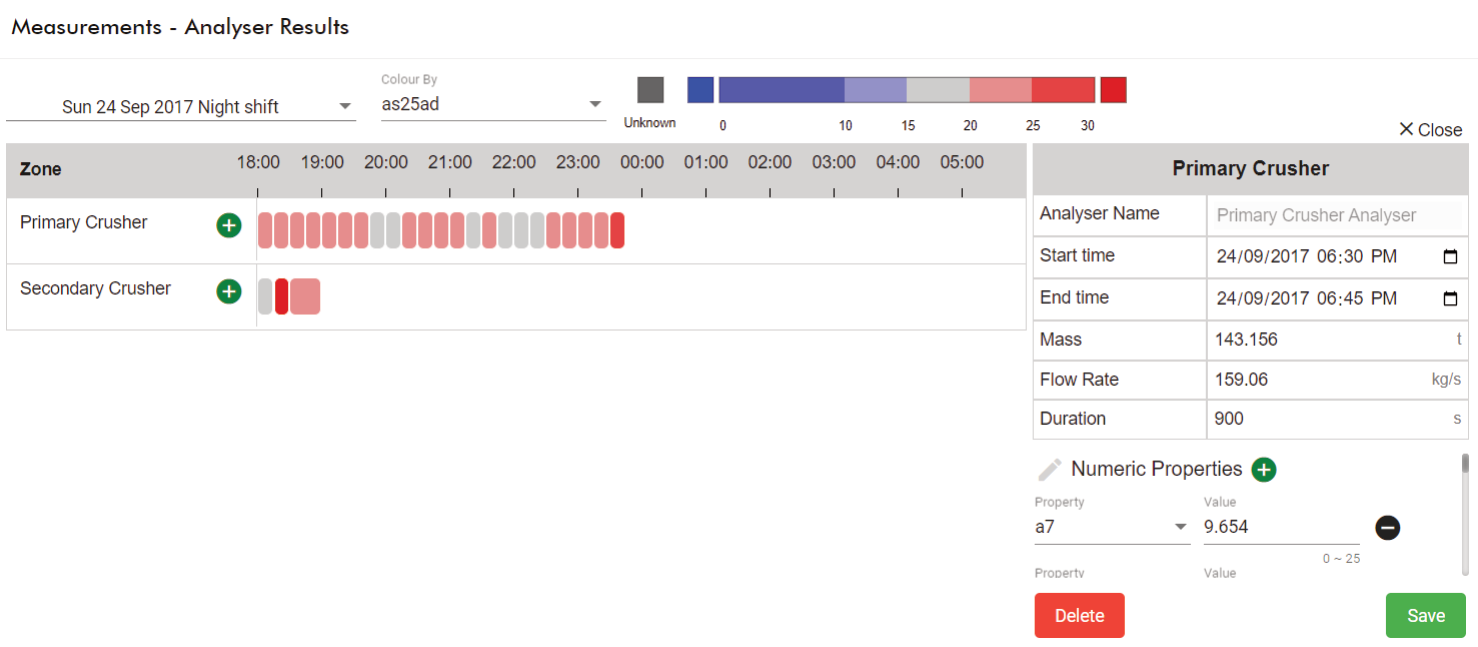
|
Top The Lab Results page. Above: Analyser Results page. |
Populating Lab or Analyser results
To view analyser or lab results follow these steps:
-
In
 Measurements, select either
  Lab Results or Analyser Results, whichever is the sample data to inspect.
 -
Select the shift from its drop-down. Lab or analyser samples will appear as segments along the timeline for the zone where samples were taken.
-
In the Colour By drop-down, select the property to display. The samples will appear as processing cycle segments along the timeline for the zone where the samples were taken.
-
Hover over a segment to open a tooltip showing the quantity of numeric, text, list, and time properties, in the above order. For example, 10/2/1/0 is for 10 numeric properties, 2 text properties, 1 list property, and no time properties.
-
Click any segment to open the results panel. It also serves as an editor, allowing information to be changed as needed. Fields with light-shaded headers cannot be changed.
Properties are fully editable. This enables you to apply corrections as needed, insert new test results, or compensate for missing or late samples. To modify a property, enter a new value in its field. To add a property, click
 under the numeric or text property category, then select the property and enter its value. To remove a property, click
  . When any changes are made, click
  to update the system.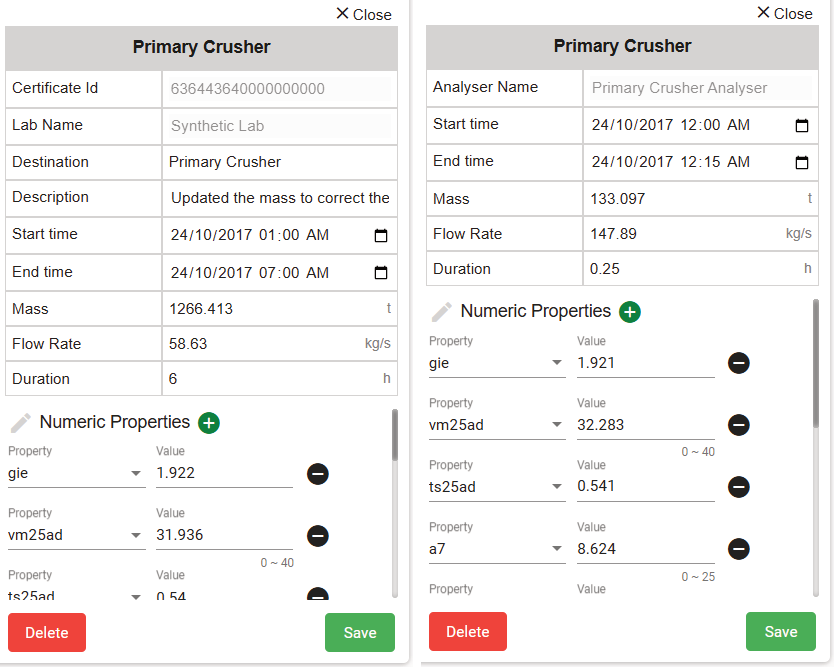
 Click to view parameter descriptions for the editor panel
Certificate ID
The unique identifier
Name (Lab or Analyser)
The name of the analyser or lab result
Destination
The name of the lab
Description Optional discretionary notes can be added in this field
Start time The start date and time that the lab or analyser sample processing interval
End time The date and time the lab or analyser sample processing completes
Mass The mass is calculated by the (Flow Rate) * (Duration) If Mass is manually changed, flow rate is calculated after you click
.Flow Rate The flow rate is the unit mass of material passing through the lab or analyser
Duration The duration is the processing interval
Properties These are the numeric and text properties found in the sample
-
Manually adding lab or analyser results
Additional lab or analyser results can be added as needed by clicking to open an results panel with no assigned properties or attributes. To add your test results, enter all required values, including the lab or analyser name, and the Start time and End Time. To enter Numeric or Text properties, click to select it and enter its value. After you have entered all the required information, click to update it to the system.
