 Material Movements
Source file: material-movements.htm
Material Movements visualises stockpiling activity and trips over a time period using the following tools:
|
Material Movements |
The timeline page visualises all site-wide material movements in an animated sequence over a selected period, using a full-screen 3D terrain viewer with playback-style controls. |
|
Material Movements |
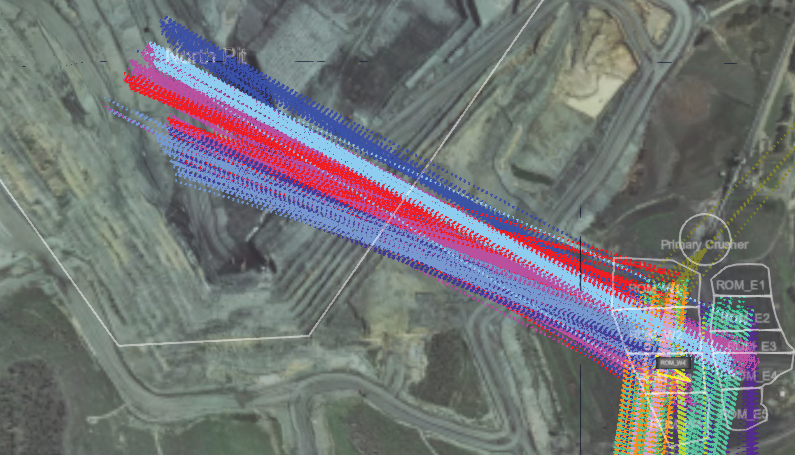
This tool generates a table of trips for a selected timeframe, and the viewer displays the source and destination path of each trip. |
Using the Timeline page
Timeline presents an animated visualisation of stockpiles as material is added or removed over a selected period. It uses a full-screen terrain viewer with playback controls to show the dynamic changes in stockpile composition, allowing users to see real-time or historical movement and reclamation of materials. To use this viewer, follow these steps:
-
Select a timeline period with the Date Time Picker.
-
Click
 to display the stockpiles on the terrain.
 -
Use your mouse to pan, tilt, and zoom the view as needed. Inside the viewer, Click
 to show the following buttons:
Go to position.
-
Click this button to open the Navigate to panel.
-
In the Coordinate Reference drop-down, select Local Mine Grid, or Lattitude/Longitude.
-
Enter the coordinates, then click
 . The view will be centred over the set coordinates.

Recentre camera
orientationClick this button to return camera orientation to plan view and northerly bearing, centred over the section of terrain in view. It does not return the camera to its original position.
-
-
Use the playback controls to run through the animation sequence.
-
Click
 to play forwards along the timeline. Click
  to play in the reverse direction.
Note: Forward playback loops back to the start of the time line and then replays. Reverse playback stops when it reaches the start of the timeline.
-
Click
 to pause or resume playback.
 -
Vary the forward and reverse playback speed (from 0 to 640800x) by dragging the speed-setting dial. The further the dial is moved in either direction from the zero point, the faster the playback speed is.
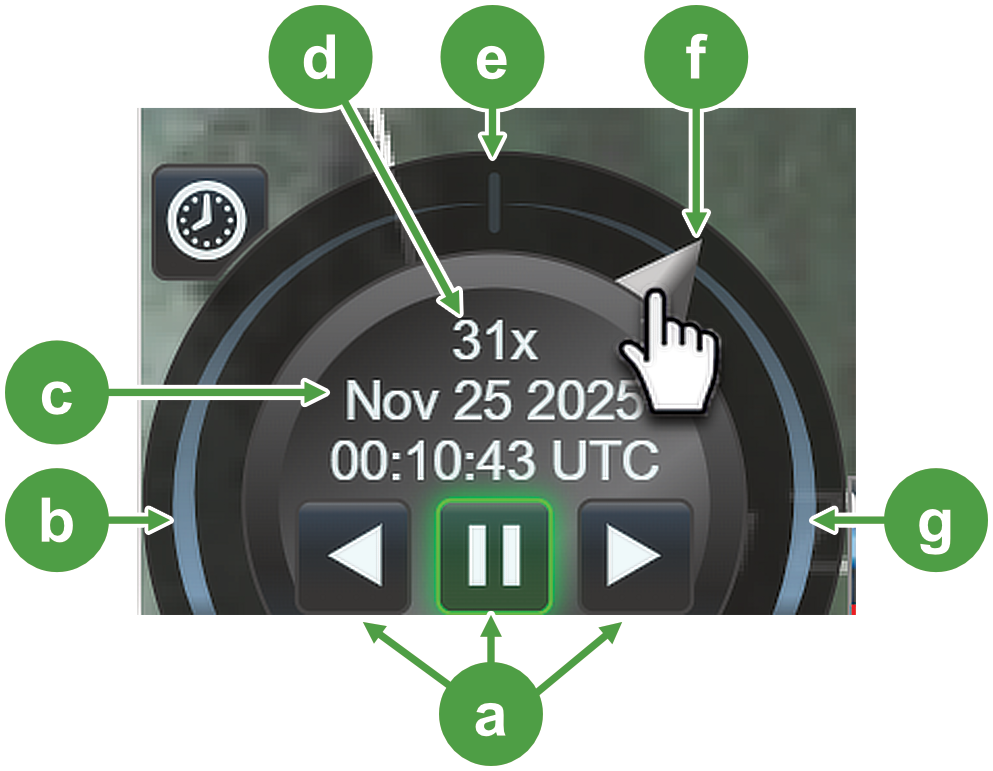

Transport controls: reverse playback, pause, forwards playback

Speed dial midpoint (zero playback speed)

Reverse playback section

Speed-setting dial

Date and time display

Forwards playback section

Playback speed (forward or reverse)
-
Use the time bar to move to a specific point in time or to manually control the animation. You can click anywhere on the time bar or drag the scrubber to the desired position.

An animation showing the effect on the stockpile model when using the time bar to advance or retreat along the timeline.
-
Using the Stockpile page
The Material Movements-Stockpile page uses a table listing trips and related information for a selected stockpile and period of time. This differs from the timeline approach, which considers site-wide material movements. This page also offers the following capabilities:
-
An optional viewer to provide a visual point-to-point representation of material movement.
-
A simple timeline that allows you to queue to specific events or filter a period of time along the timeline.
-
Enter a keyword in Search to find matching items in the stockpile table.
-
Search for a trip by using the Load Trip tool.
-
Enter a Trip ID into the Load Trip field, then click
 . Only this trip will appear on the timeline and table.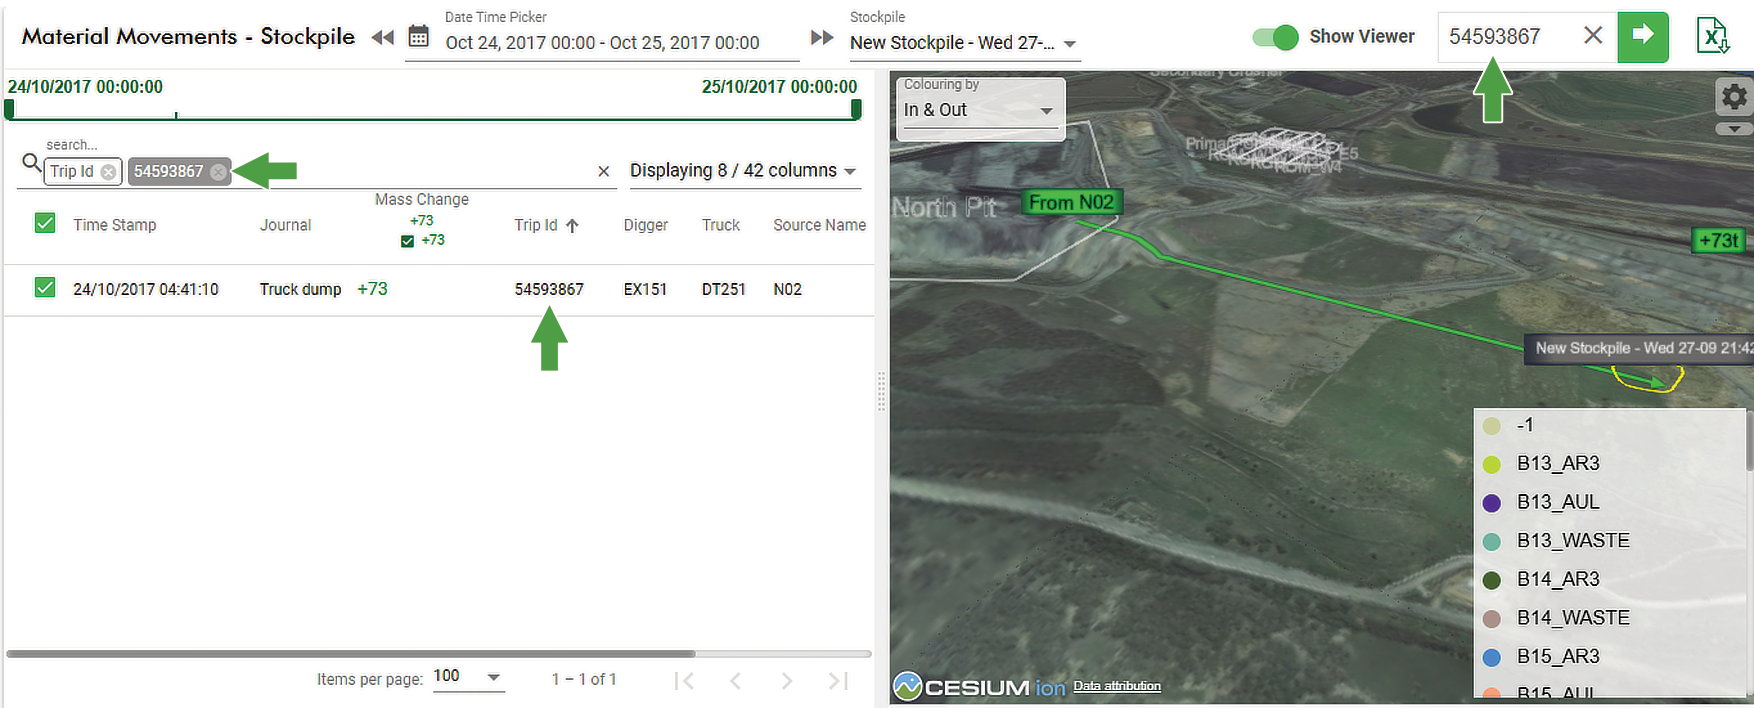
-
Generating a stockpile report
The stockpile report list all trips that have occurred at a stockpile over a selected period and presents them in a highly configurable table. Several filtering options allow you to arrange the required data, which can later be exported as a Microsoft Excel (.xlsx) file. To collect and organise the data, follow these steps:
-
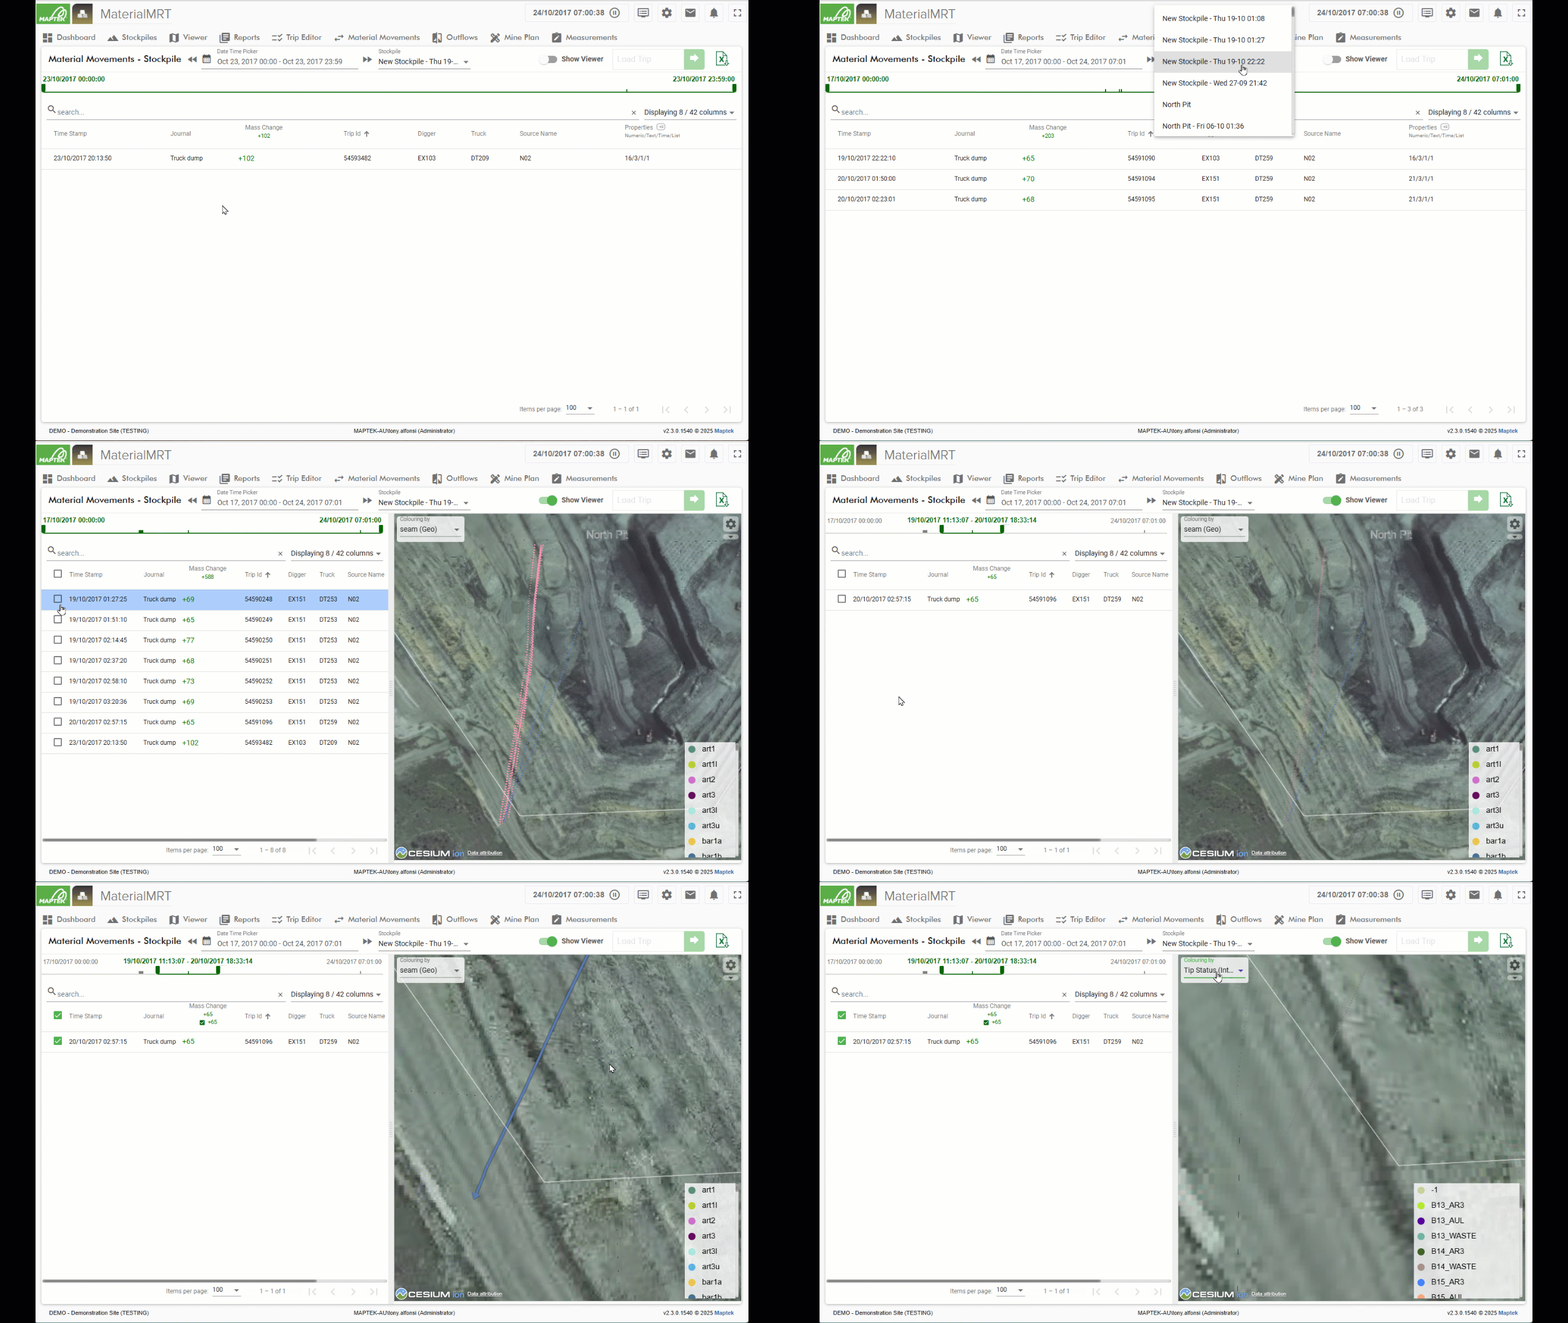
Select your time range using the Date Time Picker.
-
Select a stockpile from the Stockpile drop-down list.
-
Optionally, move the start and end markers on the timeline to select a range of trips. Trips appear as notches on the timeline; any trips outside the markers are filtered out of the stockpile table.
-
Select which columns to include in the table. The number of selected columns appears in the drop-down label.
 Click to view the definitions of general information items
Time
The time and date of the trip.
Journal
A description or reason for the trip.
Payload
The tonnage of the material for that trip.
Trip ID The unique identifier used by the FMS.
Digger The name of the equipment handling the material at the source.
Truck Then name of the truck moving the material to the destination.
Source/Destination
Identifiers used by the FMS corresponding to the source and destination location of that trip.
Properties The quantities of different properties associated with that trip. Each property category is separated by a “/” in the following order:
Numeric/Text/Time/List.
Example: 14/4/1/1 indicates there are 14 numeric properties, 4 text properties, and 1 time and list property on that trip.
Tip: Hover over an item in the Properties column to view a tooltip showing the details of the collective properties.
Source Name The location from which the material was sourced.
Destination Name The location from which the material was deposited.
-
Reorder the selected columns by dragging items up or down in the drop-down list.
-
Click a column header to set its sort order; other columns automatically reorder to match.
Exporting a report
After filtering and sorting your data click  to generate the export file. The report is saved to your default downloads folder as:
Stockpile_Movements_<yyyy-mm-dd>T<hh-MM>.xlsx.
where:
-
Stockpile_Movements_is the output name. -
<yyyy-mm-dd>is set to the system clock using theyear-month-daysequence. -
T<hh-MM>is set to the system clock with a ‘T’ prefix followed byhours-minutessequence.Example: Stockpile_Movements_2025-11-25T13_29.xlsx
Using the viewer
The viewer shows the passage of material movements from its source location to its destination. A geographical perspective is provided by the viewer.
-
Click
 to open the viewer and
  to hide it.
 -
Drag the vertical bar to increase or decrease the width of the viewer.
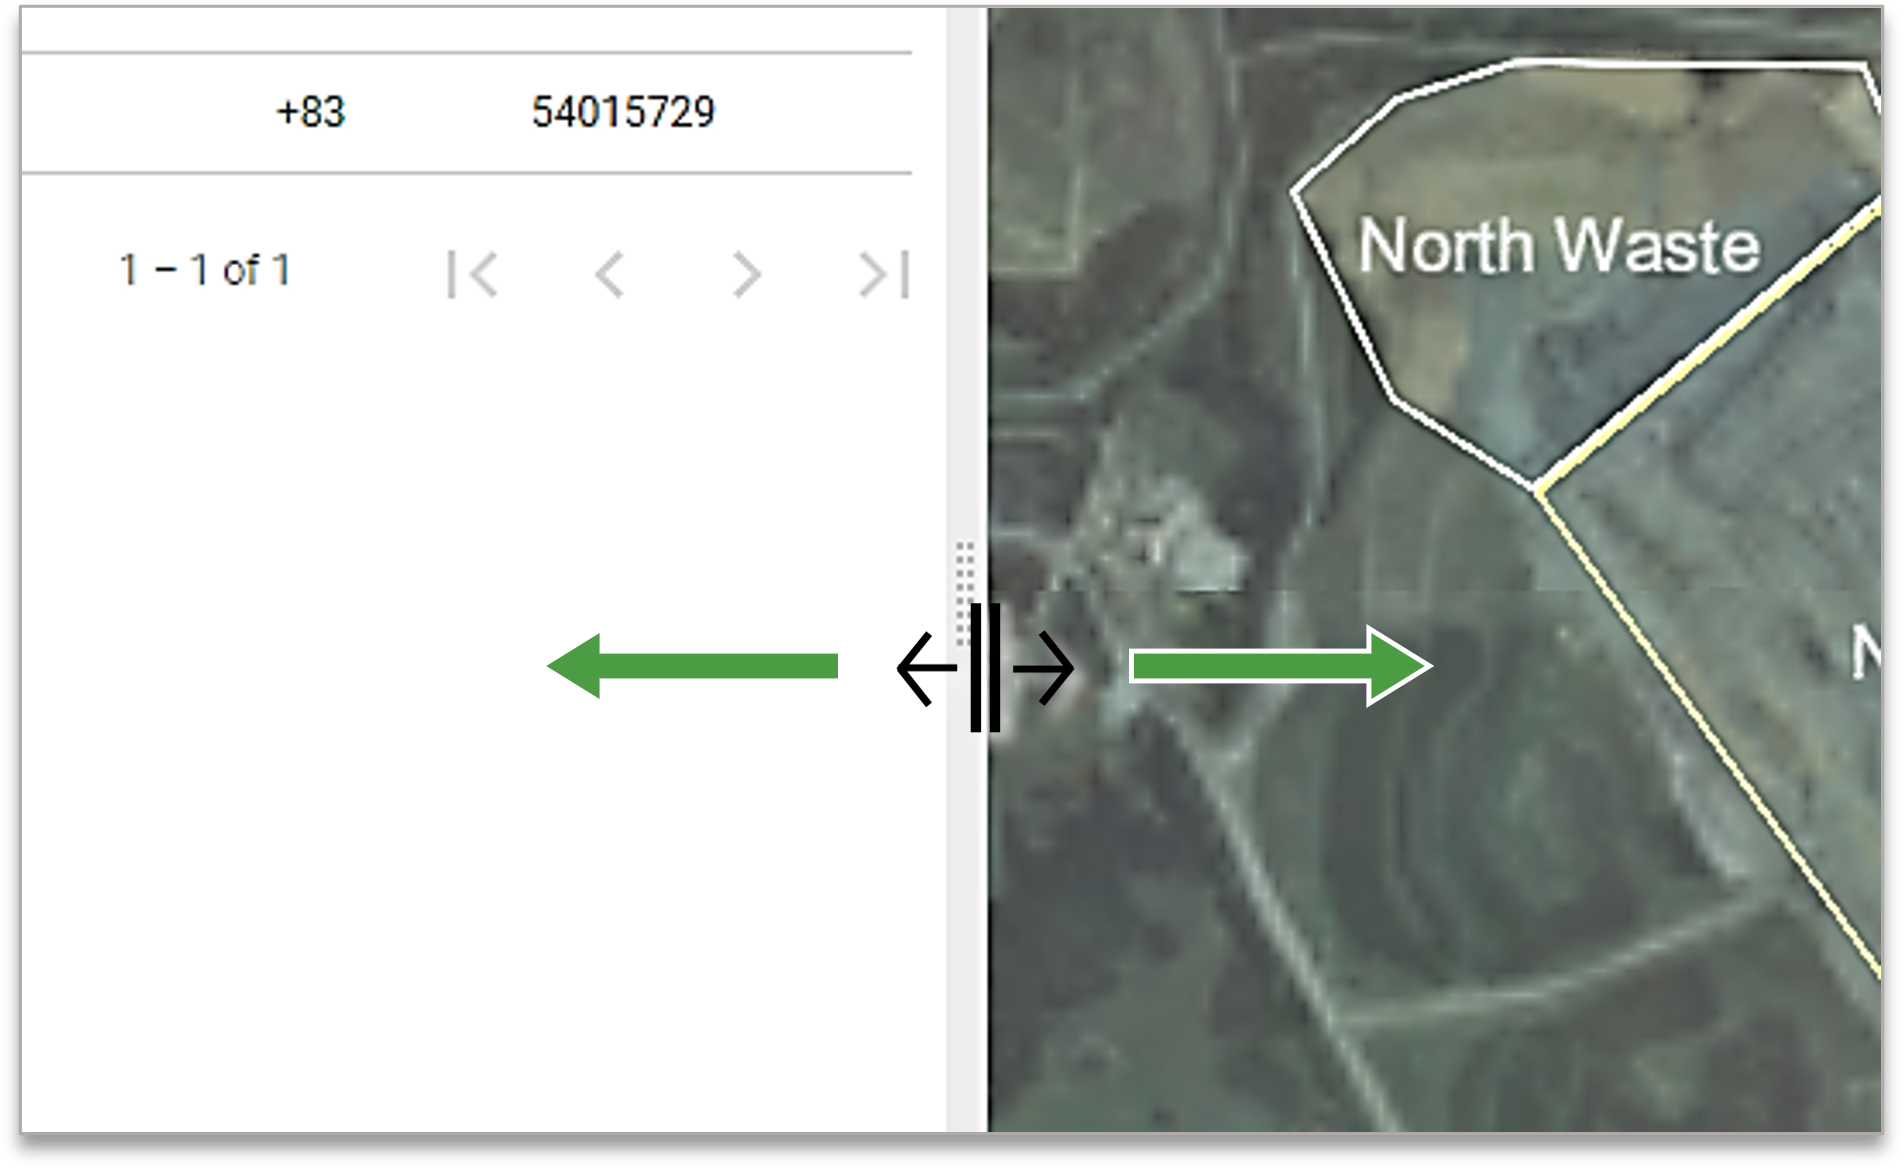
Material movement viewer controls
Use your mouse to pan, tilt, and zoom the view as needed. The timeline viewer also provides the following terrain-positioning tools. Click (Open more tools) to reveal the following buttons:
|
Reset View |
Click this button to return the camera to its starting position, orientation, bearing, and zoom scale. |
|
Go to position. |
|
|
Recentre camera |
Click this button to return camera orientation to plan view and northerly bearing, centred over the section of terrain in view. It does not return the camera to its original position. |

 . The view will be centred over the set coordinates.
Viewing trips
Follow these instructions to visualise movements:
-
Follow the steps described in Generating a stockpile report.
-
In the table use the checkboxes to select one or more trips.
-
In the viewer, select the preferred scheme in the Colouring by drop-down list.
A single trip shows as a solid colour-coded line, with an arrow at the destination and a tonnage tag at the source.
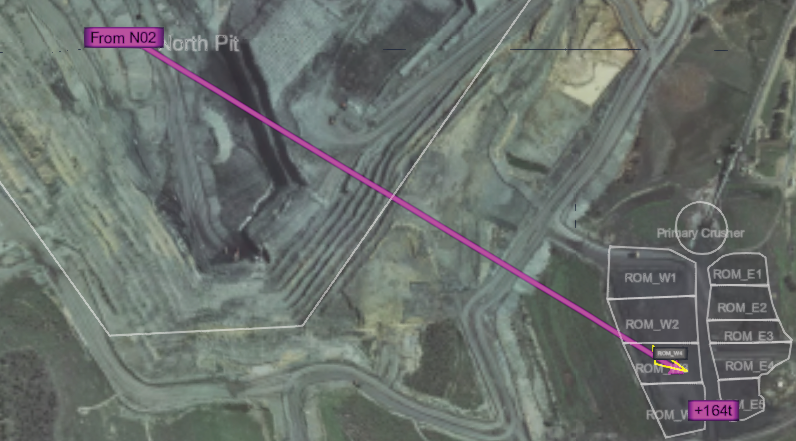
Multiple trips show as colour-coded dotted lines connecting their sources to their destinations.