

 Reports
Source file: reports.htm
Reports tools generate detailed summaries and inventory listings of material stockpiles and movements across the mining value chain. They allow users to track changes in stockpile tonnages, report on additions and removals, and produce inventory tables showing stockpile properties over time. These tools also support trip-based reports that analyse movements, properties, and quantities of material as it flows from mine to plant.
The Reports menu contains the following tools:
-
Stockpile Ons and Offs: Tracks all additions (Ons) and removals (Offs) of material from each stockpile. The report Itemises changes in stockpile tonnage over any period, supporting inventory updates and audit trails. To learn more, see Running stockpile ons and offs reports.
-
Tonnage Reconciliation: Compares actual moved material tonnages (from fleet management system data) against the planned mine plan and reports the variance for each shift or period—positive variance means exceeding plan, negative means shortfall. To learn more, see Running tonnage reconciliation reports.
-
Stockpile Inventory: Shows an inventory of all properties by mass for each stockpile, including composition, quality, and grade, and can be exported for further analysis. To learn more, see Running stockpile inventory reports.
-
Trips: Displays properties found within a primary text property It provides numeric and text properties found in the primary text property, including secondary text properties. To learn more, see Running trips reports.
-
Zones: Reports material quantities and movements associated with each zone (site sub-area), allowing analysis of how material is distributed and transferred between zones and other site locations. To learn more, see Running a Zones report.
-
Scan Adjustments: Logs any changes or corrections made to scan data or survey updates that affect material or topography tracking in relation to the Measurements > Stockpile Surfaces page. It also Provides an audit trail to ensure accuracy and transparency in reporting. To learn more, see Running a Scans Adjustment report.
Running stockpile Ons and Offs reports
Reports - On and Offs reports track changes in the mass of a stockpile as material is added or removed (Ons and Offs), referred to throughout MaterialMRT as truck dumps and truck loads. A total and running total is calculated for each stockpile. To generate an Ons and Offs report, follow these steps:
-
Open the Date Time Picker and set the required period, then click
 .
. -
Open the Stockpiles drop-down and use the checkboxes to select those you want to include in the report. Each selected stockpile appears in a separate column in the table.
-
Click
 to update the table and display the report.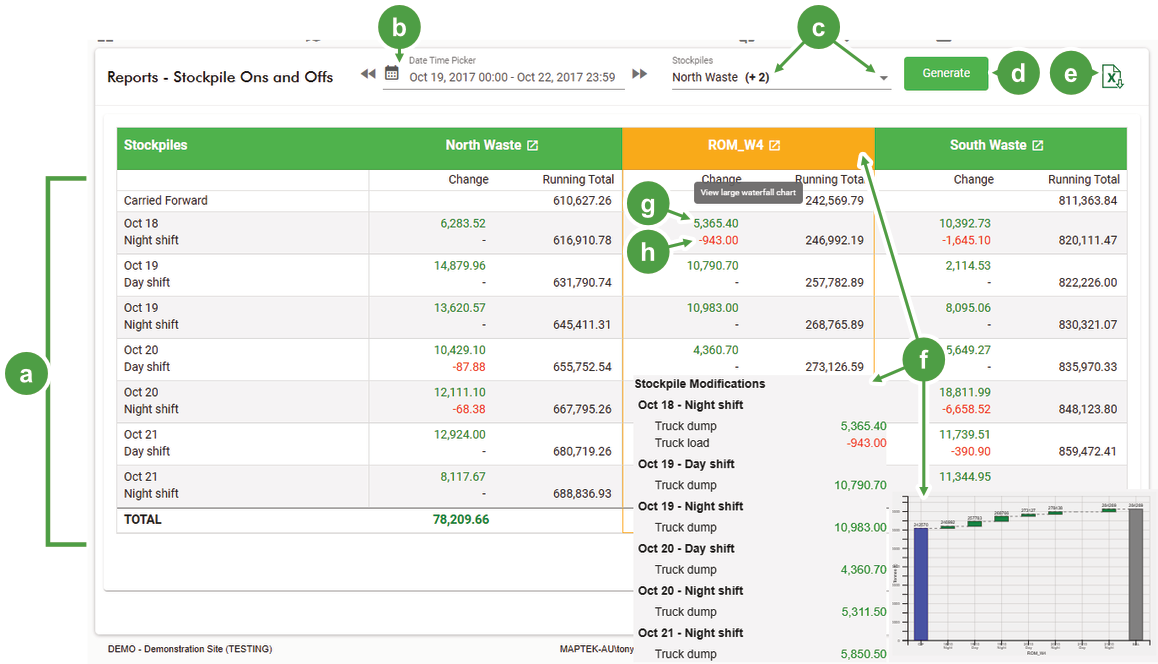

Shifts 
Export to Excel (XLSX) button 
Date time picker with time period selected 
Hover to see tooltip and chart, or click the column header for more details. 
Stockpiles drop-down list 
Truck dump (stockpile On) 
Generate (report) button 
Truck load (stockpile Off)
Viewing additional information
After generating your report, you can view information in more detail.
-
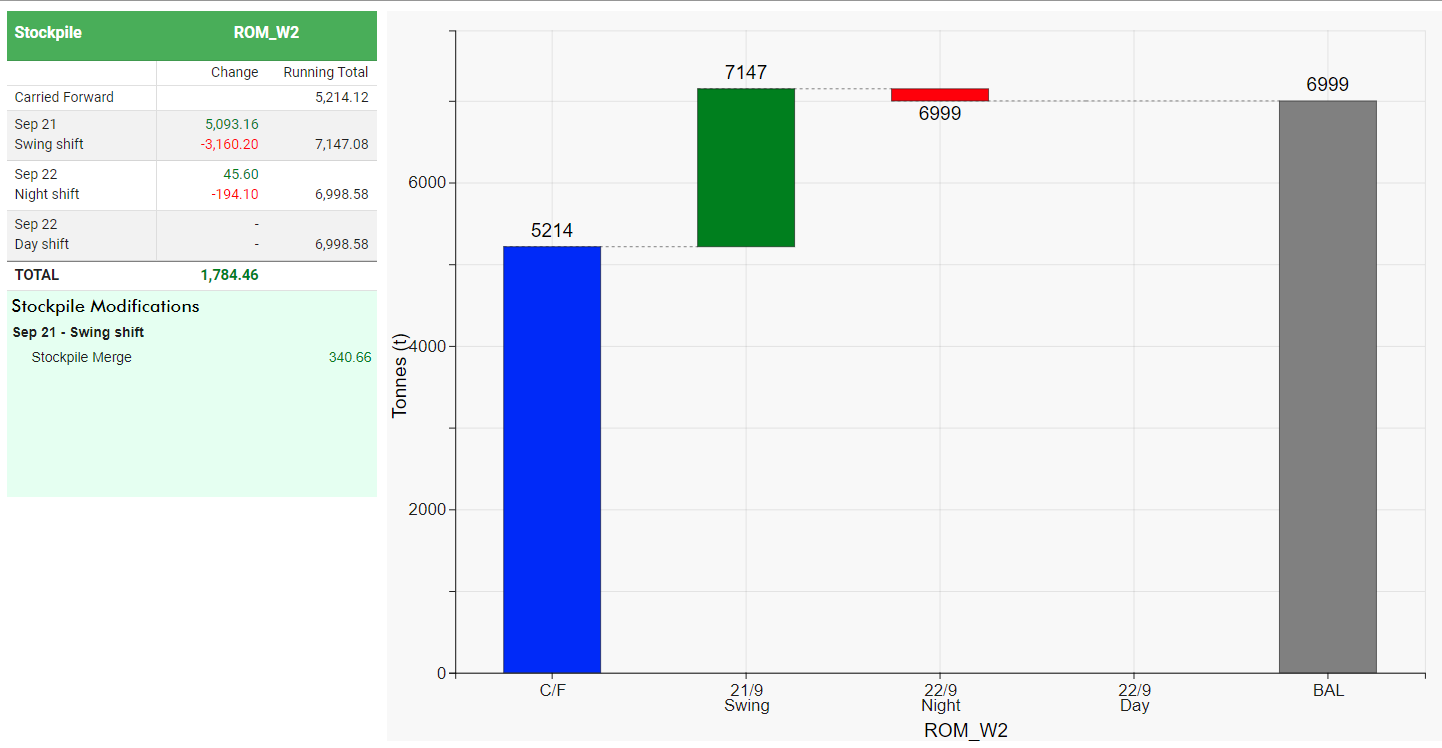
Hover over any column to show a small tooltip and waterfall chart.
-
Click on a stockpile column header (indicated by
 ) to open a panel containing the list of changes and running totals, stockpile modifications, and waterfall chart.
Interpreting on and offs report data
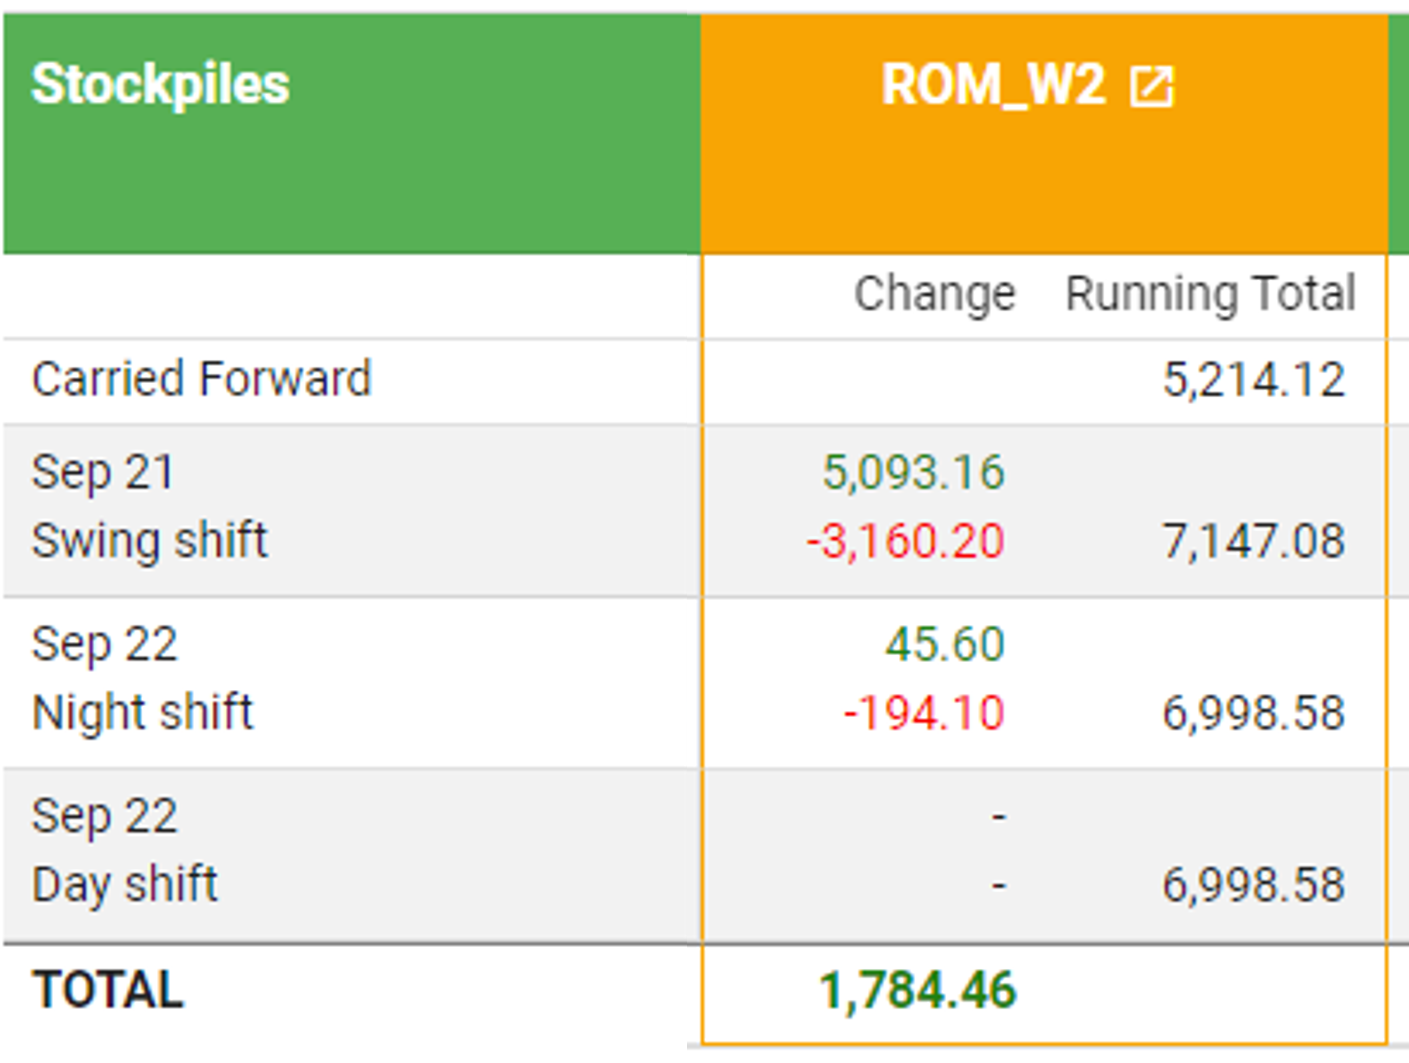
The running totals for each stockpile appear its own column, subdivided into two columns: Change and Running total. See the example below.
The stockpile ROM_W2 has changes recorded for the swing shift on September 21 and the night shift of September 22. No changes occurred during the September 22 day shift.
In the Change column, the stockpile ons (truck dumps) are 5093.16 and 45.6 tonnes and the stockpile offs (truck loads) are -3160.20 and -194.10 tonnes .
TOTAL change is the difference between the on and off values. In this example: (5093.16 + 45.60) - (3160.20 + 194.10) . The resulting change, 1784.46 is recorded under Total in the Change column.
The Running total column is the sum of the amount Carried Forward from the previous shift and net change in the following shift, as demonstrated in the following example:
5214.12 + 1932.96 = 7147.08 (Sep 21 Swing shift)
7147.08 + (-148.5) = 6998.58 (Sep 22 Night shift)
0 (no change) + 6998.58 = 6998.58 (Sep 22 Day shift)
Exporting your on and offs report
Reports are exported to a Microsoft Excel spreadsheet xlsx file. To prepare your export, follow these steps:
-
Select your time period and stockpiles as described in Running stockpile Ons and Offs reports, then click
to run the report. -
Click
 to save the report to your computer. The report is saved to your browser's download directory as Stockpiles_Changes_Report_<Date><Time>.xlsx.
where:
-
Stockpiles_Changes_Report_is the report's name -
<Date>is set to the system clock expressed asyear-month-day -
<Time>is set to the system clock expressed asT hour-minutes
Example: Stockpile_Changes_Report_2025-11-26T12_08.xlsx
-
Running tonnage reconciliation reports
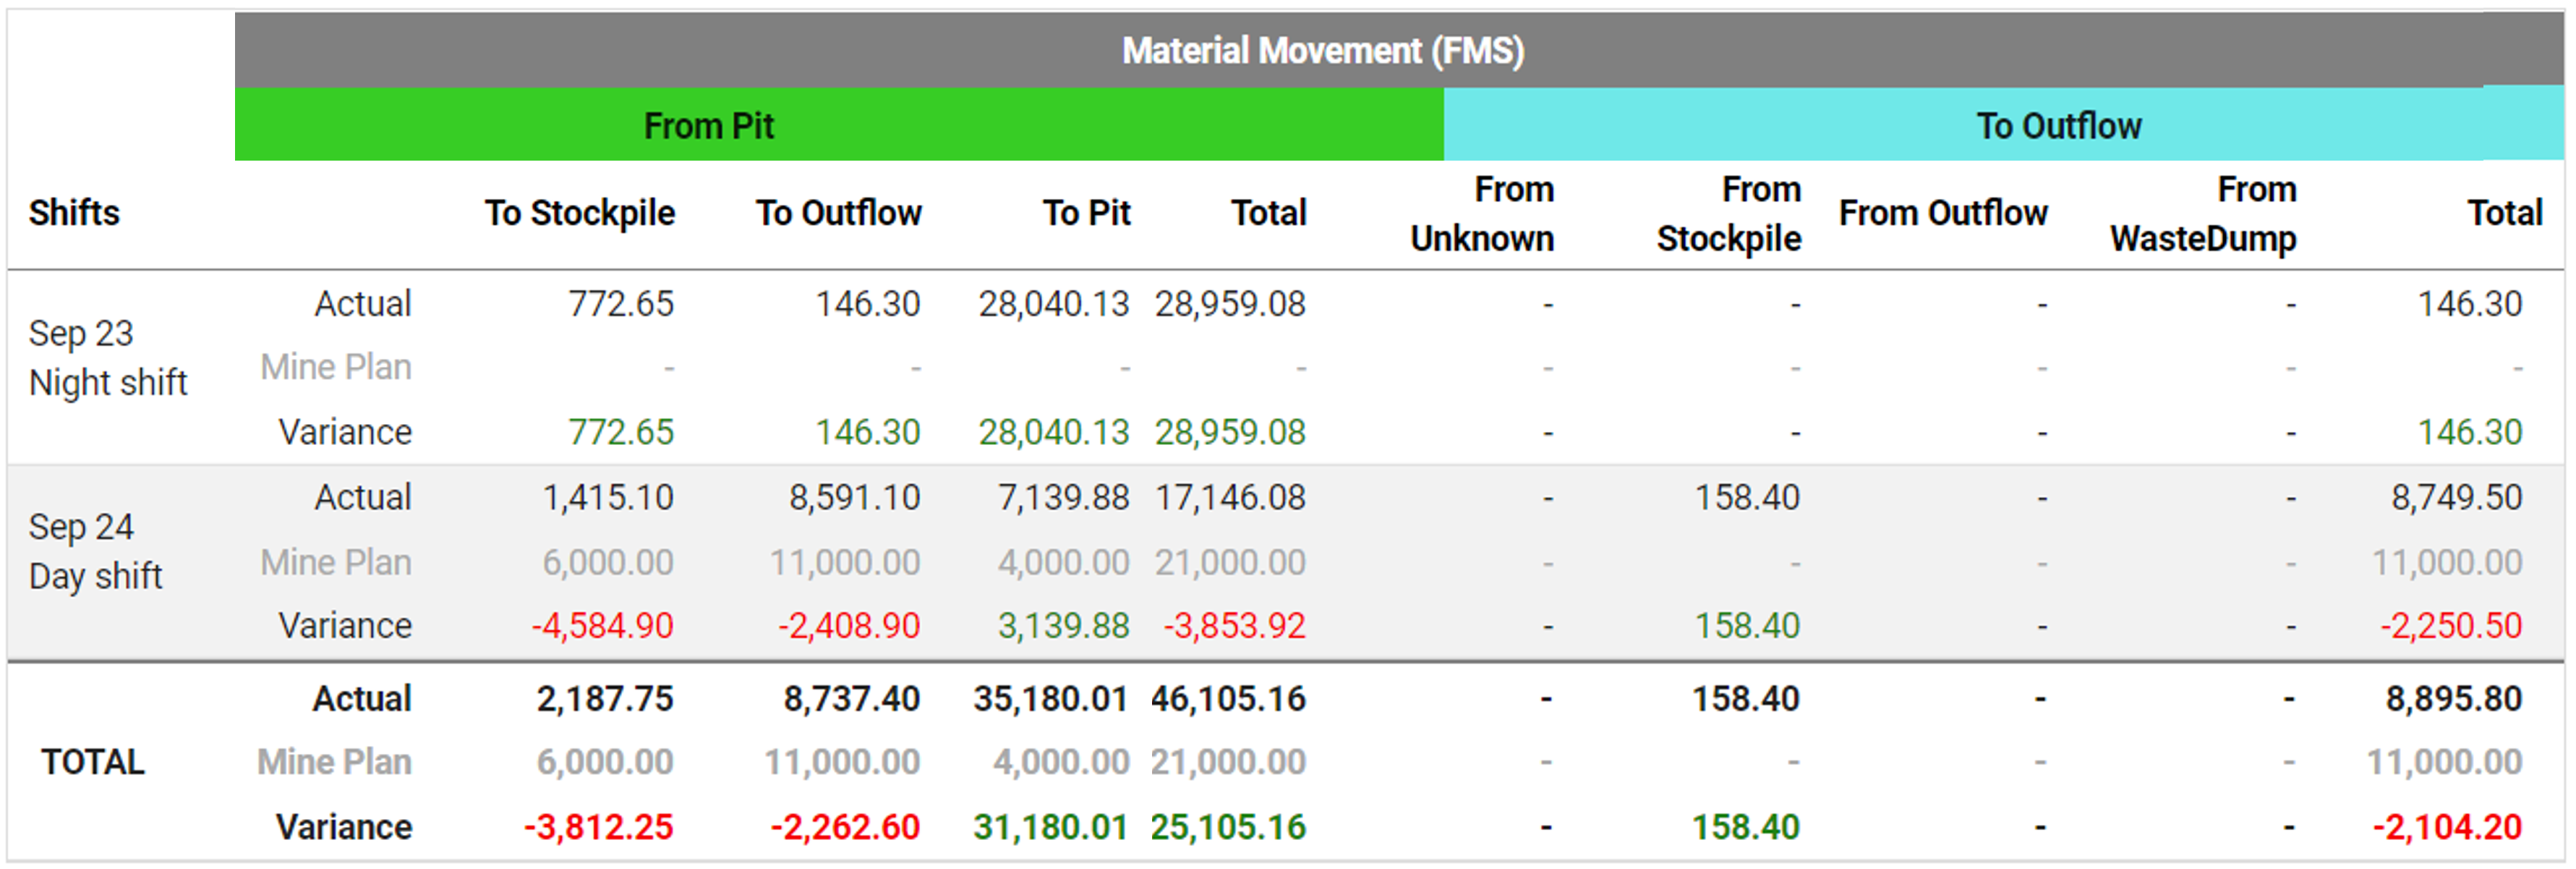
Tonnage reconciliation is a report that compares the actual amount of material moved (using Fleet Management System data) to mine plan quantities over a set period. It tabulates all material transfers from pits to zones and from zones to outflow, reporting both actual and planned tonnes, and then calculates the variance for each zone and shift. This allows users to see where actual tonnage matches or diverges from planning numbers, with the results summarised by shift and by destination, helping identify discrepancies and improve future planning and accountability throughout the operation
To generate a report, follow these steps:
-
Use the Date Time Picker to set the required per.
-
Select a Text Property from its drop-down list.
-
Select at least one text property component from the Value drop-down list.
-
Click
to display the report.
Interpreting tonnage reconciliation data
Each shift contains three rows, as follows: Actual (tonnage), Mine Plan (designed tonnage), and the calculated Variance. Information for each of these values are displayed in the following way:
-
Positive variance (green text) indicates values meeting or exceeding the Mine Plan.
-
Negative variance (red text) indicates a shortfall relative to the mine plan.
-
Accumulated actual, mine plan, and variance values are located in the bottom row, TOTAL.
-
The combined amount of material for shift From Pit and To Outflow are recorded in each column under Total.
Exporting your tonnage reconciliation report
Reports are exported to a Microsoft Excel spreadsheet (XLSX) file. To prepare your export, follow these steps:
-
Select your time period, text property, and then required values, then click
to run the report. -
Click
(Export to Excel) at the top-right of the page. The report is saved to your browser's download directory as Tonnage_Reconciliation_Report_<Date>T<Time>.xlsx.
where:
-
Trips_Report_is the report's name. -
<Date>is set to the system clock and expressed asyear-month-daysequence. -
<Time>is set to the system clock and expressed ashours-minutessequence. -
xlsxis the file format.
Example: Tonnage_Reconciliation_Report_2025-11-26T12_08.xlsx
-
Running stockpile inventory reports
Stockpile Inventory produces tabular reports showing selected properties—such as quality, quantity, or other metrics—for each stockpile at a given time, supporting weighted averaging and total mass calculations. To create a report, follow these steps:
-
In the Stockpiles drop-down list, select which stockpiles to include.
-
In the Properties drop-down list, select those properties to include.
-
Click
to run the report. An inventory table using the data selected is displayed, similar to the example below. 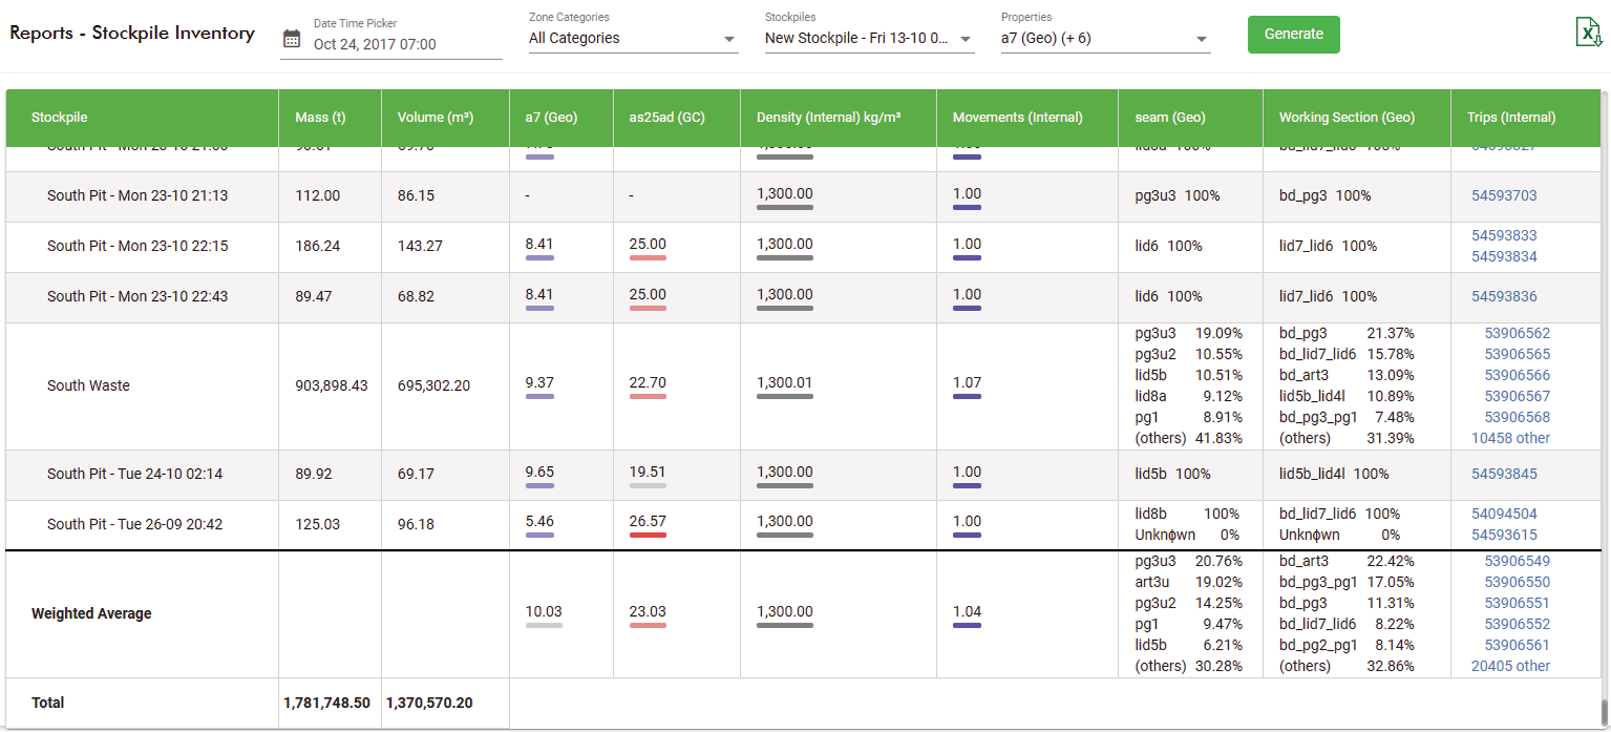
Tip: Hover over a property in any cell to display a tooltip showing information within the numeric, text, or list property.
Interpreting stockpile inventory data
Stockpiles are listed in the first column, followed by the total mass and volume in their respective columns. Properties in the stockpile appear in the following columns. The coloured line matches the material schema colour.
There are two aggregate value rows at the bottom of the table that are:
- Weighted Average: Weighted Mass= (w1 * x1) + (w2 * x2) + ... + (wn * xn) / w1 + w2 + ... + wn
Where:
w1, w2, ..., wn are the stockpile mass assigned to each data point. x1, x2, ..., xn are the values of the property. -
- Total Mass: The total mass is the sum of all the stockpile mass in the Mass column.
Exporting your stockpile inventory report
Reports are exported to a spreadsheet (xlsx) file. To prepare your export, follow these steps:
-
Configure your filtering parameters, then click
to run the report. -
Click
(Export to Excel) at the top-right of the page. The report is saved to your browser's download directory as Stockpile_Inventory_Report_<Date>T<Time>.xlsx.
where:
-
Trips_Report_is the report's name -
<Date>is set to the system clock using theyear-month-daysequence -
<Time>is set to the system clock using thehours-minutessequence
Example:
Stockpile_Inventory_Report_2025-11-26T12_08.xlsx -
Running Trips reports
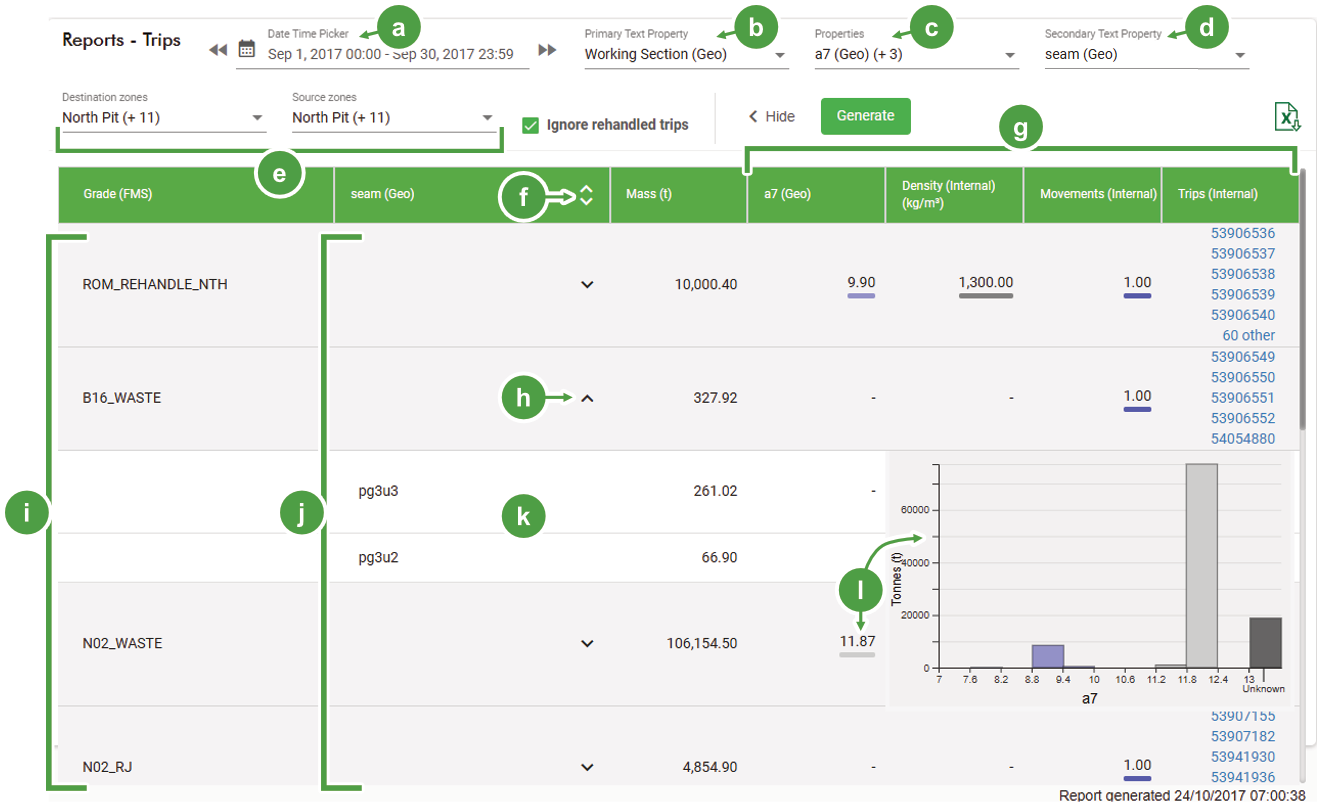
The Reports - Trips tool enables users to generate and review summary tables of material movement records based on a selected primary property, such as source, destination, or material type. This tool aggregates and displays essential information for each group—such as total transferred mass (tonnage) and associated material properties (numeric, text, list, or time-based)—providing an overview of movements between specified site locations. Users can quickly compare the total quantities sent from or received by each source or destination, as well as examine related characteristics for further analysis and inventory reconciliation. Export options allow filtered or custom datasets to be saved for operational or compliance reporting.
|
|
|
|
Date time picker |
|
All/Selected aggregate properties |
|
|
Primary text property drop-down list |
|
Expand/Collapse a single secondary properties row |
|
|
Properties (child properties from the primary) drop-down list |

|
Primary text properties list |
|
|
Secondary text properties drop down list |

|
Secondary text properties list (nested in the primary) |
|
|
Destination and source selectors |

|
Secondary properties (expanded) |
|
|
Expand/Collapse all secondary text properties |

|
Tooltip (hover over a property) |
To generate your report, do the following:
-
Use the Date Time Picker to set the required period, then click
to save and close the panel. -
In the Primary Text Property drop down list, select one.
-
In the Properties drop-down, use the checkboxes to select available properties to display.
-
Click
 to show additional options for Secondary Text Property, Destination zones, and Source zones.
 -
In the Secondary Text Property drop-down, select one, if required. To remove a selection, click Unselect.
-
In the Destination zones drop-down use the checkboxes to select destinations.
-
In the Source zones drop-down, use the checkboxes to select sources.
-
Enable Ignore re-handled tripsto prevent rehandled material from being recounted and included in the report.
-
Click
to run the report.Tip: You can reorder your primary text properties in the Reports - Trips page by dragging the row up or down the list.
Exporting your trips report
Reports are exported to a Microsoft Excel spreadsheet (.xlsx) file. To prepare your export, follow these steps:
-
Run your report as previously described.
-
Click
to export the report to your browser's download directory as Trips_Report_<Date>T<Time>.xlsx.where:
-
Trips_Report_is the report's name -
<Date>is set to the system clock using the<yyyy-mm-dd>sequence -
<Time>is set to the system clock using the<hh-MM>sequence
Trips_Report_2025-11-26T12_08.xlsx
-
Running a Zones report
The Zones report quantifies the mass, volume, and other properties associated with zone polygons and solids. It allows filtering by category, zone type, and properties. The information is presented in a tabular format, with each zone—sorted by type—displayed in a single row alongside its associated properties.
-
Use the date and time picker to select a time range or specific date and time.
-
Use the Categories drop-down to select any combination of extraction, storage, and processing points within the site's run-of-mine operations.
-
Use the Zone Polygons drop-down to select any applicable zones.
-
Use the Zone Solids drop-down to select any applicable zone solids.
-
Use the Properties drop-down to the select which properties to include.
-
Click the
button to display the results after setting or updating any of the above parameters. -
Click
to export your report to your computer.
The report is saved to your browser's download directory as Zones_report_<Date>T<Time>.xlsx.
where:
-
Zones_Report_is the report's name -
<Date>is set to the system clock using the<yyyy-mm-dd>sequence -
<Time>is set to the system clock using the<hh MM>sequence
Running a Scans Adjustment report
The Scans Adjustment report compares scan data to as-built information over a selected time period, evaluating aspects such as volume, density, material composition, terrain, and spatial deviations.
Users can filter the data using the Category and Zone drop-down menus to only show scans overlapping zone polygons.
-
Use the Categories drop-down to select any combination of extraction, storage, and processing points within the site's run-of-mine operations.
-
Use the Zones drop-down to select which zones to include in the report.
-
Click the
button to display the results after setting or updating any of the above parameters. -
Click
to export the report to the computer.
The exported report is saved to your browser's download directory as Scan_Adjustements_<Date>T<Time>.xlsx.
where:
-
Scans_Adjustment_is the report's name -
<Date>is set to the system clock using the<yyyy-mm-dd>sequence -
<Time>is set to the system clock using the<hh MM>sequence
Example: Scan_Adjustments_2025-11-26T12_08.xlsx
