Quick Start
This quick start guide will orient you to the basics of GeoSpatial Manager, including concepts, basic manipulation of the combined model, and several key tools.
Overview
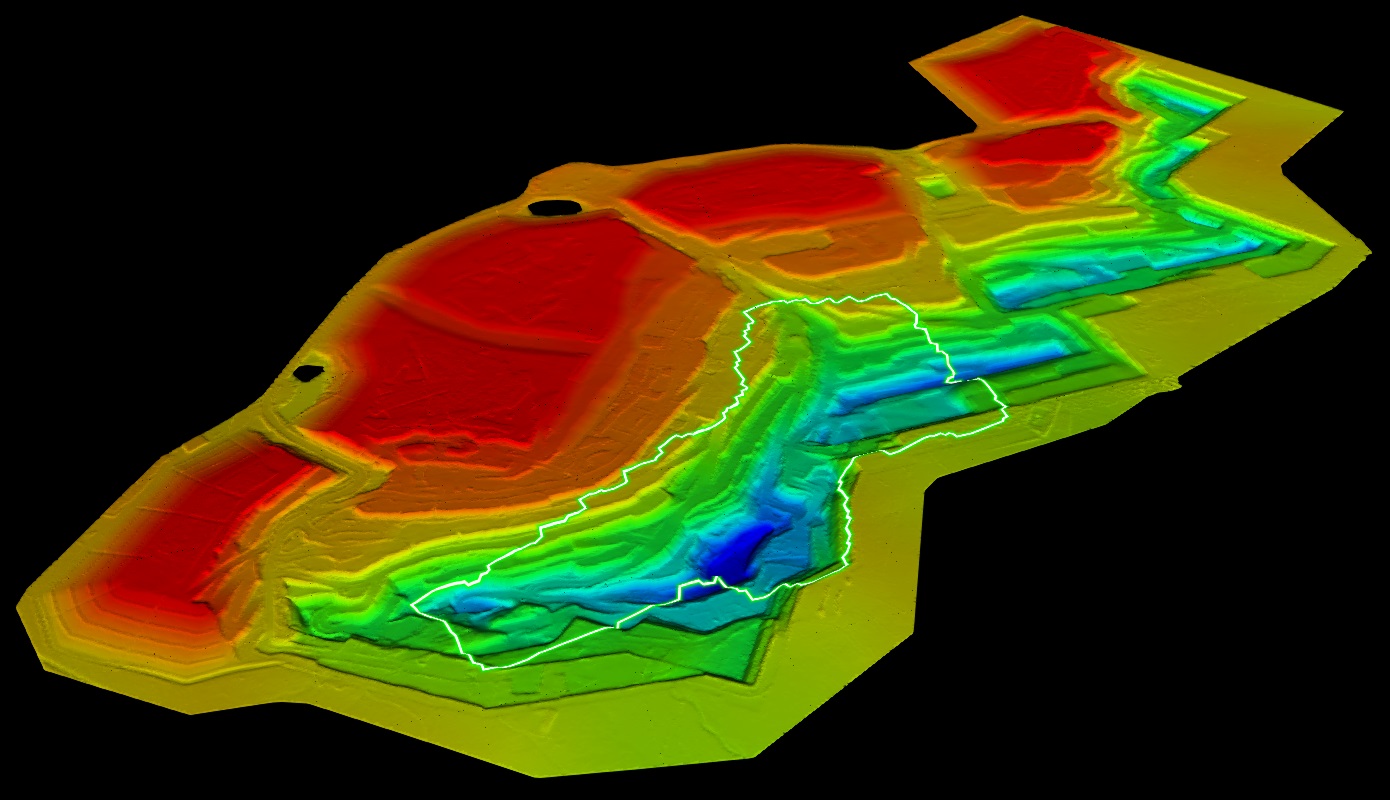
GeoSpatial Manager is the single source of truth for your digital surface model. Users with upload permissions (typically surveyors) upload regular updates in the form of as-built surfaces that might cover only a portion of the site. GeoSpatial Manager incorporates each of these partial source surfaces into a single combined model. The model keeps track of the acquisition date and time of each source surface so that users can view the combined model for any given point in time between the initial and most recent surface uploads. All users see and query the same model. Each source surface remains identifiable and retrievable for download. Source surfaces can also be deleted so that they no longer contribute to the combined model. GeoSpatial Manager automatically and dynamically updates the combined model in response to uploads and deletions so that the model always represents the best available information.
|
|
|
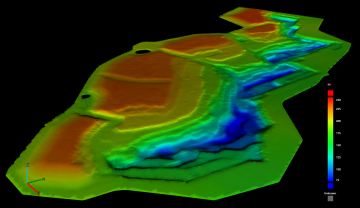
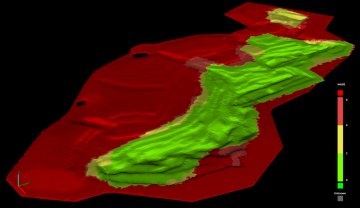
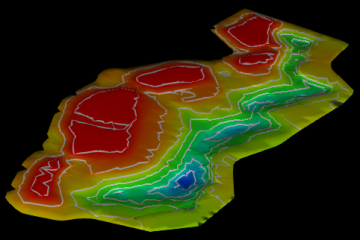
Example of a combined model viewed in GeoSpatial Manager. The model is composed of many source surfaces, one of which is highlighted. |
User interface
The image below shows the main user interface elements of the GeoSpatial Manager ![]() Home page.
Home page.
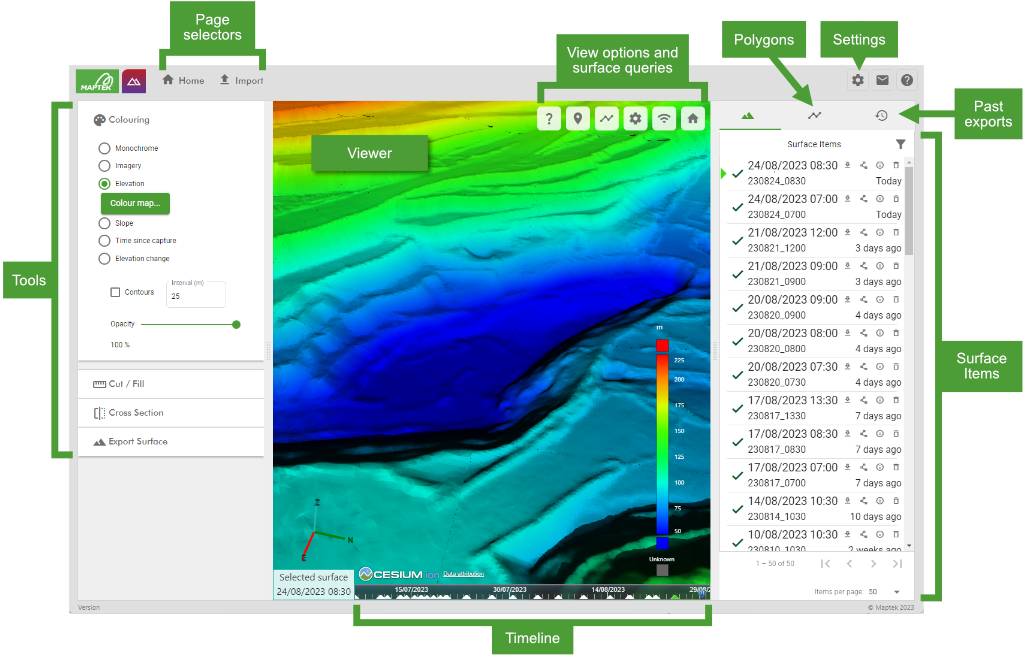
| Page selectors | Switch between the |
| Viewer | View and interact with the combined model in 3D. See Panning, zooming, and rotating on this page for the main manipulation controls. |
| Timeline | Use the timeline to set the selected surface, or define time ranges for tools that require it. See Selecting a surface in the timeline on this page for more information on using the timeline. |
| Tools |
Change the surface visualisation, generate cut and fill reports, view the combined model in cross section, and export the combined model. See Changing the surface visualisation and Analysing the combined model on this page for more information on these tools. |
| Surface Items |
View and manage the list of imported source surfaces contributing to the combined model. See Source surfaces and the Surface Items list on this page for more information. |
| Polygons | View and manage polygons and polygon sets used to identify areas of interest or as input for certain tools. See Creating polygons on this page for information on creating polygons. |
| Past exports | View details of previously exported surfaces and re-download them. See Past exports on this page for more information. |
| Settings | Configure site settings, coordinate systems, users and roles, and other settings. See Site Settings for more information. |
Interacting with the combined model
The combined model is displayed in an interactive 3D viewer. GeoSpatial Manager handles large, detailed surfaces easily. It does this by dynamically adjusting the level of detail shown based on the current view of the data, allowing smooth and responsive interaction.
Panning, zooming, and rotating
You can pan, zoom, and rotate your view of the combined model using the following controls, depending on whether you are using a mouse or a touch screen.
| Operation | Mouse | Touch |
|---|---|---|
| Pan | Left click + drag | One finger drag |
| Zoom |
Right click + drag, or |
Two finger pinch |
| Rotate |
Middle click + drag, or |
Two finger drag |
The pan, zoom, and rotate operations are all based on the position of the mouse cursor on the screen (or the position of your fingers on a touch screen). This means, for example, that when zooming in, the view will keep the point under the mouse cursor as the focal point; when rotating, the view will rotate around the point under the mouse cursor. The following animation demonstrates panning, zooming, and rotating by positioning the mouse, clicking the left, right, or middle mouse buttons respectively, and dragging.
Source surfaces and the Surface Items list
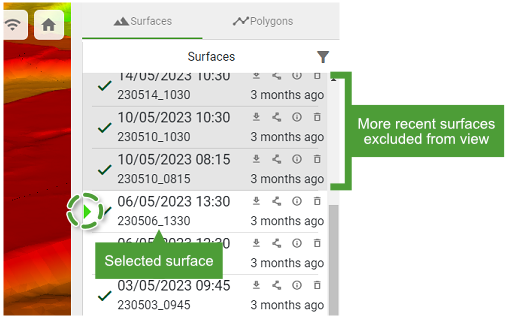
The uploaded source surfaces contributing to the combined model are listed in the Surface Items list in the right-hand pane in descending date order; that is, the most recent source surface appears at the top of the list.
-
Hover over a source surface in the list to show its boundary polygon in the combined model.
-
Perform actions on individual surfaces in the list using the tool buttons, including
 (Download surface) and
  (Generate polygon).
See Managing Surface Items for more information about the Surface Items list.
Selecting a surface in the timeline
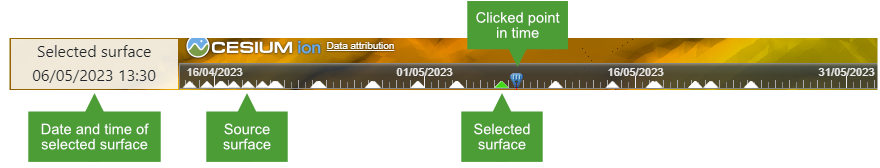
GeoSpatial Manager can display the combined model for any point in time between the oldest source surface and the most recent source surface. The timeline located at the bottom of the viewer represents each uploaded source surface with a triangle. The green triangle represents the current selected surface. The surface in the viewer is a model that combines each source surface from the oldest to the selected surface.
-
Click on the timeline to pick a point in time and select the closest source surface. A blue position marker indicates the point in time that was picked. The date and time of the selected surface is shown in the bottom-left corner of the view. The viewer will automatically update to show the combined model at that point in time.
-
Hover over the timeline and use the mouse scroll wheel to zoom the timeline in or out. Alternatively, right click on the timeline and drag the mouse left or right.
The current selected surface is also indicated in the Surface Items list with a green triangle.
The animation below demonstrates clicking various points on the timeline to show the progression of a mining operation over time.
Changing the surface visualisation
You can change the visualisation of the surface model using the ![]() Colouring tool group located in the left pane.
Colouring tool group located in the left pane.
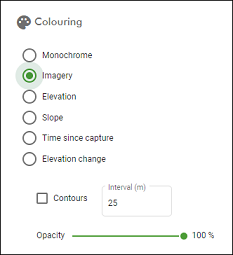
The table below summarises each colouring tool. See Colouring for detailed instructions on the colouring tools, including how to configure colour maps for options that use them.
|
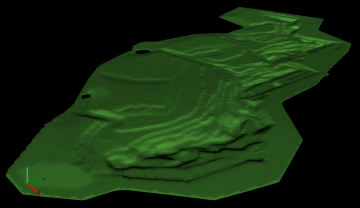
Monochrome |
Apply a single colour uniformly to the surface.
|
|
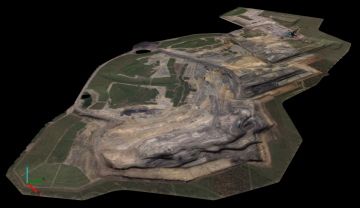
Imagery |
Display satellite imagery on the surface (requires internet connection).
|
|
Elevation |
Colour the surface by elevation according to a configurable colour map.
|
|
Slope |
Colour the surface by slope angle according to a configurable colour map.
|
|
Time since capture |
Colour the surface based on the time elapsed since the latest data capture. This is useful to quickly identify which parts of the surface have not been updated recently and may require resurveying.
|
|
Elevation change |
Colour the surface by the change in elevation over a specific time period. This colouring option is useful to quickly visualise which parts of a site have been subject to the most activity.
|
|
Contours |
Apply contour lines to the surface at specified intervals.
|
|
Opacity |
Make the current colouring method translucent, revealing the underlying surface imagery.
|
Analysing the combined model
GeoSpatial Manager contains several tools to help you analyse and understand your data. Most of these tools operate on an area of interest defined by a polygon, so we will first look at how to create polygons in GeoSpatial Manager.
Creating polygons
There are three ways of creating polygons in GeoSpatial Manager: by digitising points on the surface in the viewer, by generating from a source surface boundary, or by importing from file. Manage polygons and polygon sets in the ![]() (Polygons) tab in the right-hand pane.
(Polygons) tab in the right-hand pane.
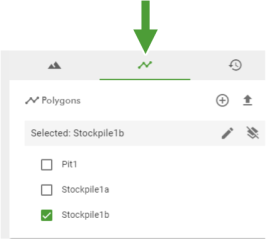
The animation below shows how to create a new polygon by digitising point on the surface. Start by switching to the ![]() (Polygons) tab, expanding the
(Polygons) tab, expanding the ![]() Polygons group and clicking the
Polygons group and clicking the ![]() (Draw polygon) button. Instructions appear on the screen.
(Draw polygon) button. Instructions appear on the screen.
-
To view any saved polygon in the viewer, make sure its checkbox is selected in the
 Polygons list.
See Polygons for more detailed instructions on polygons, including generating from surface boundaries, importing from file, and combining into polygon sets.
Cross section tool
The ![]() Cross Section tool allows you to view the parts of the surface behind an intersecting vertical plane. You can opt to display the surface at a single point in time, or compare the surface between two points in time.
Cross Section tool allows you to view the parts of the surface behind an intersecting vertical plane. You can opt to display the surface at a single point in time, or compare the surface between two points in time.
To use the cross section tool, on the ![]() Home tab, make sure the
Home tab, make sure the ![]() Cross Section tool is expanded. Then, simply select a polygon to define the region in which to display the model cross section, select a date range, and click Generate.
Cross Section tool is expanded. Then, simply select a polygon to define the region in which to display the model cross section, select a date range, and click Generate.
See Cross Section for more detailed instructions on using the cross section tool.
Cut and fill tool
The ![]() Cut / Fill tool located on the ride side of the
Cut / Fill tool located on the ride side of the ![]() Home tab allows you to calculate surface volumes and tonnages. There are two cut and fill methods to choose from, as follows:
Home tab allows you to calculate surface volumes and tonnages. There are two cut and fill methods to choose from, as follows:
-
Elevation: Calculate the cut and fill volumes with respect to a specified reference elevation.
-
Date Range: Calculate the difference in volume over a specified date range.
See Cut / Fill for detailed instructions on calculating cut and fill.
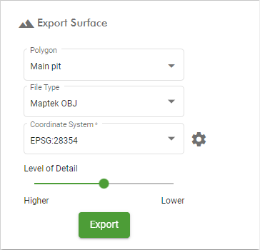
Exporting surfaces
You can export surfaces using the ![]() Export Surface tool located on the left side of the
Export Surface tool located on the left side of the ![]() Home tab. The tool generates a surface for each selected polygon and exports it to the selected file type at the selected level of detail.
Home tab. The tool generates a surface for each selected polygon and exports it to the selected file type at the selected level of detail.
See Export Surface for detailed instructions.
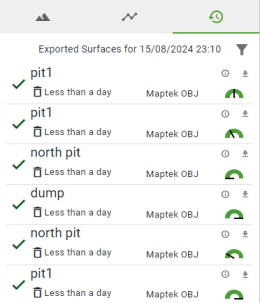
Past exports
You can see a list of previously exported surfaces by clicking the ![]() (Past Exports) button located to the right of the viewer on the Home tab. Exported surfaces are available here for a fixed number of days before being deleted. The name of the surface is based on the polygon used to generate it.
(Past Exports) button located to the right of the viewer on the Home tab. Exported surfaces are available here for a fixed number of days before being deleted. The name of the surface is based on the polygon used to generate it.
-
Mouse over the
 icon to see details of who exported the surface and when.
 -
Click
(Download surface) to download the surface. -
The gauge in the bottom-right indicates the level of detail the surface was exported at. Hover over it to see the exact level of detail.
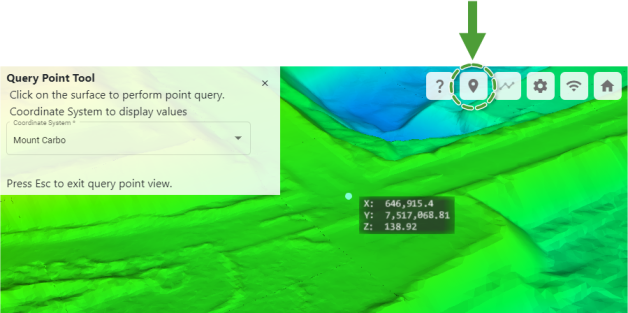
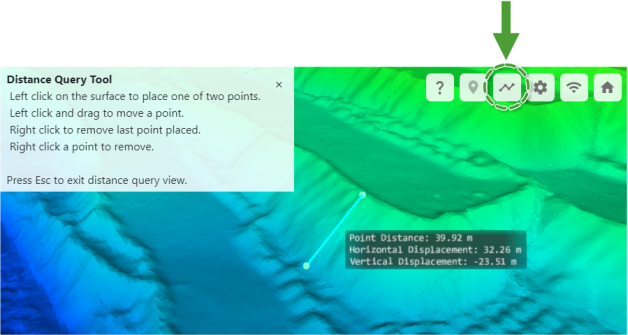
Point and distance queries
The viewer supports a couple of simple queries based on the geometry of the surface model. These queries are available from the tool buttons located in the top-right corner of the viewer and are described below.
|
|
Query Point Query the location of a point clicked on the surface.
|
|
|
Distance Query Query the distance and horizontal/vertical displacement between two points clicked on the surface.
|