Getting Started
Source file: getting started.htm
This section provides an overview of commonly used controls and introduces the various parts of the web-based user interface. If you are new to MaterialMRT or setting it up for the first time, please read through this section first to learn the basics of using MaterialMRT.
Note: Foreground and background colours on buttons and controls displayed in MaterialMRT Help may vary from those depicted herein. They can vary, depending on your operating system and browser colour scheme.
Signing in
MaterialMRT supports Microsoft Azure Active Directory for access to the system. Follow the sign-in method used by your organisation or as otherwise instructed. Typically, the steps are as follows:
-
Open the URL hosting MaterialMRT.
-
In the MaterialMRT landing page, click the
 button.
 -
In the Sign in dialog, enter your user name (or pick an account to log in to, if the option is available).
-
In the Enter password dialog, enter your password (or select an alternate sign in option, if available), then click
 .
.When successfully signed in, the dashboard page will open.
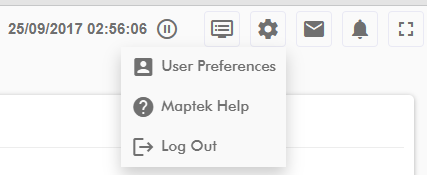
To log out, click ![]() to open the (System Preferences) menu and select
to open the (System Preferences) menu and select  .
.
Permissions and access to pages and tools
When your user profile is created, certain roles will be assigned. These roles not only determine what pages and tools you may use, but it also which buttons and other controls are available. To learn more about roles and how they work, see System Preferences > Roles .
Navigating MaterialMRT
MaterialMRT has two globally available elements along the top of the browser window; as follows:
-
The system bar at the upper right-hand corner of the browser performs several functions. Administrators can manage the system using Site configuration options and system preferences in User and Administration Tools. All users can update their telemetry preferences, log out of the system, and contact Maptek for assistance.
-
The page selection bar hosts the majority of MaterialMRT applications, they are displayed in their own pages. Some of the buttons expand into a menu. To learn more, see Main Pages and Tools.
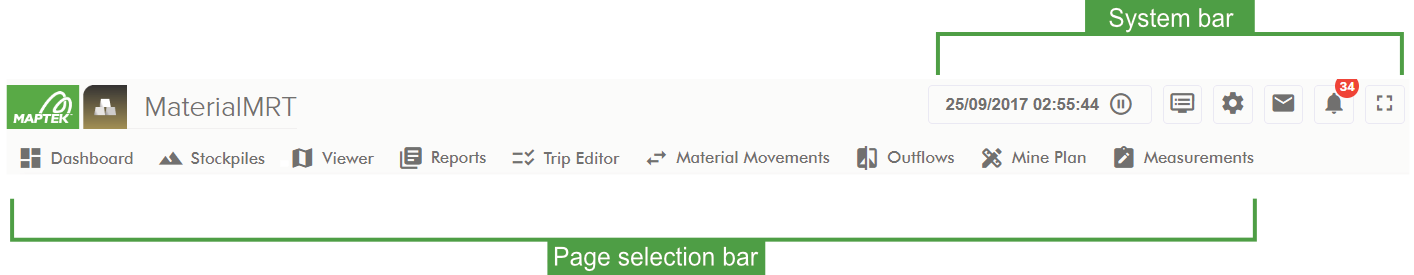
Note: The default starting page in MaterialMRT is the Dashboard. A default dashboard is initially presented to all new users. Once signed in, you can create and assign your own custom dashboards. To learn more, see Main pages and tools > Dashboard.
Setting up for the first time
MaterialMRT requires your site parameters and zones to be set up upon deployment by the administrator. To learn more, see Site Configuration Options and System Preferences to set the specific configuration options and values used by MaterialMRT.
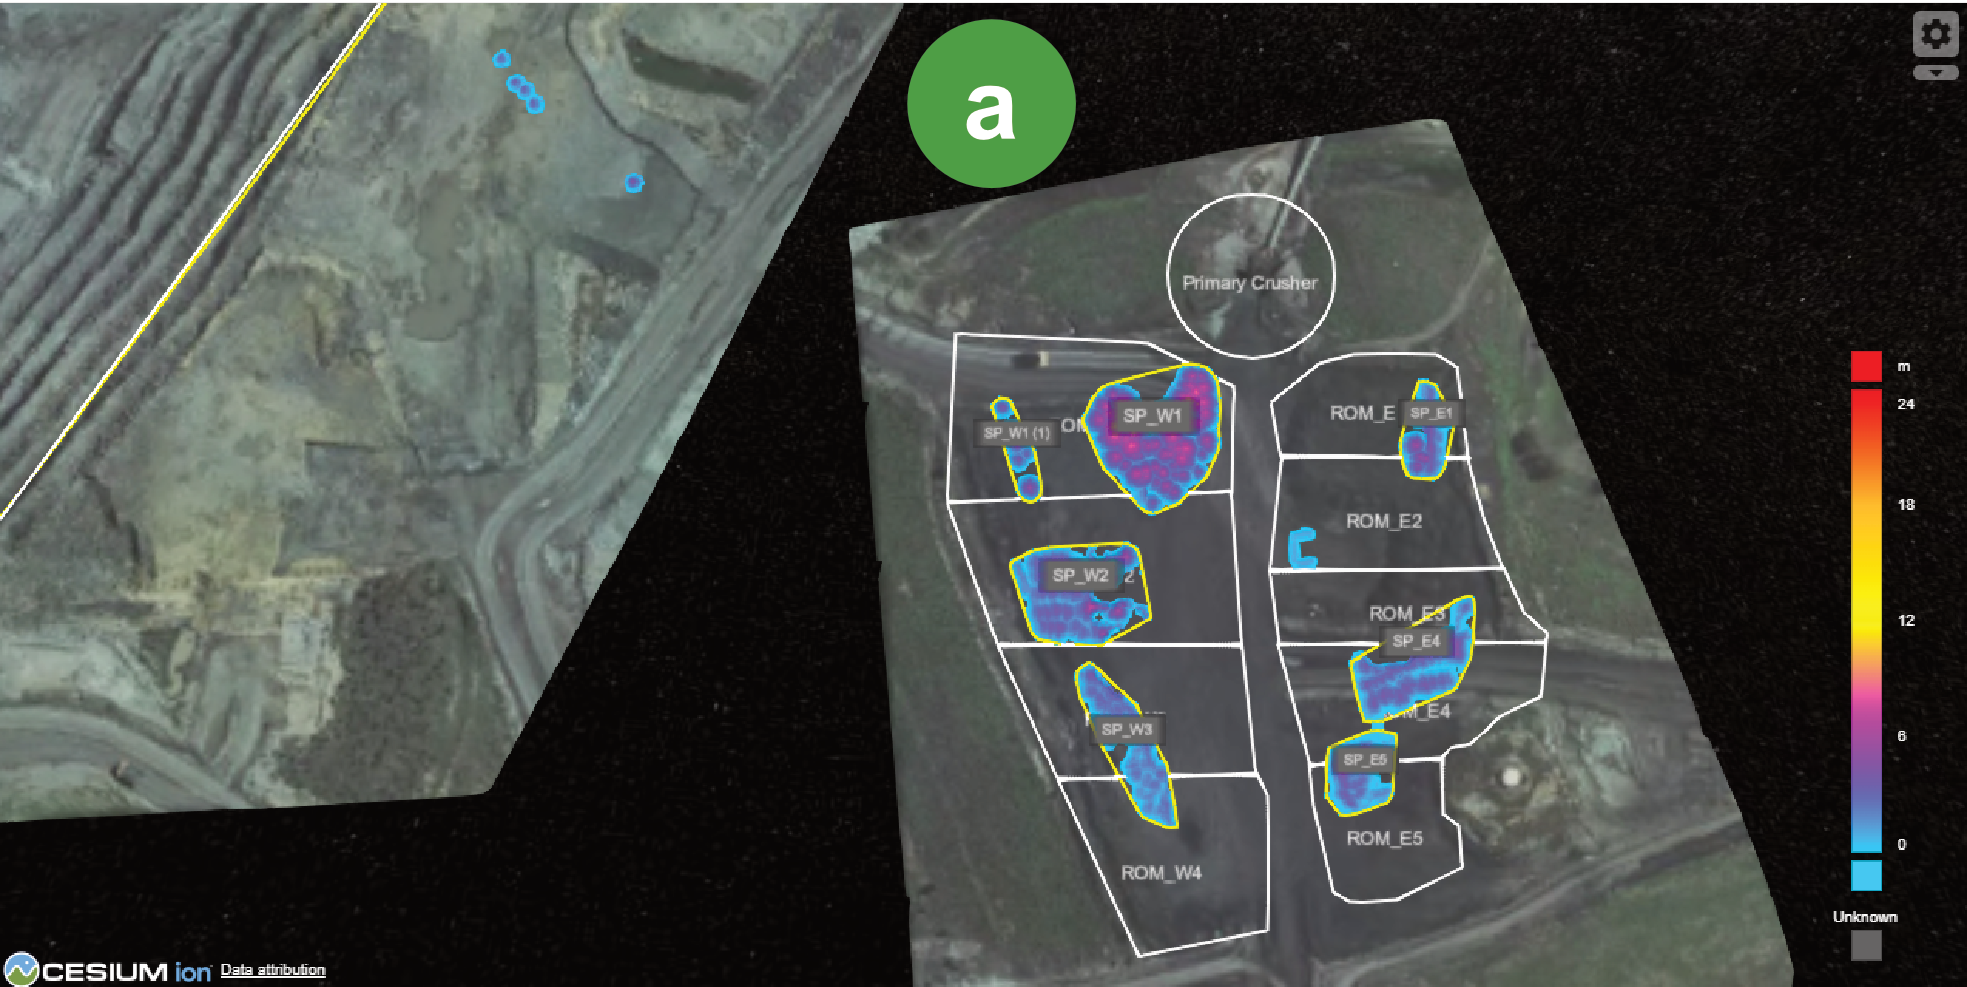
Visualising topology in MaterialMRT
MaterialMRT features viewers that can display the following:
-
Imagery (the Cesium ion terrain overlay)
-
Zones
-
Stockpiles with or without labels, additional details, and stockpile boundaries
-
Grade control models
-
Geological models
-
Tool-specific markers, labels and other indicators
-
Legends
Items that may be displayed or available in a specific viewer depends on the viewer used. The table below summarises the basic functions of each viewer.
| Page | Menu item | Summary functionality |
|---|---|---|
|
|
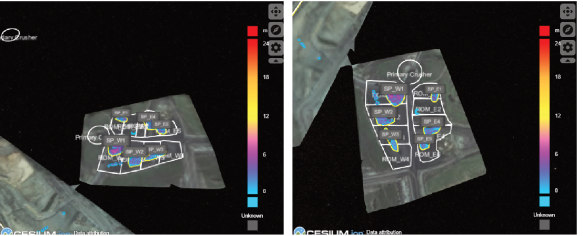
- | Analyse stockpiles by selection, cross-section, or area. Edit stockpiles directly and change information about a stockpile. For more details, see Viewer. |
|
|
Timeline |
Visualise changes using a timeline and playback controls. For more details, see Material Movements. |
|
|
Viewer by Time |
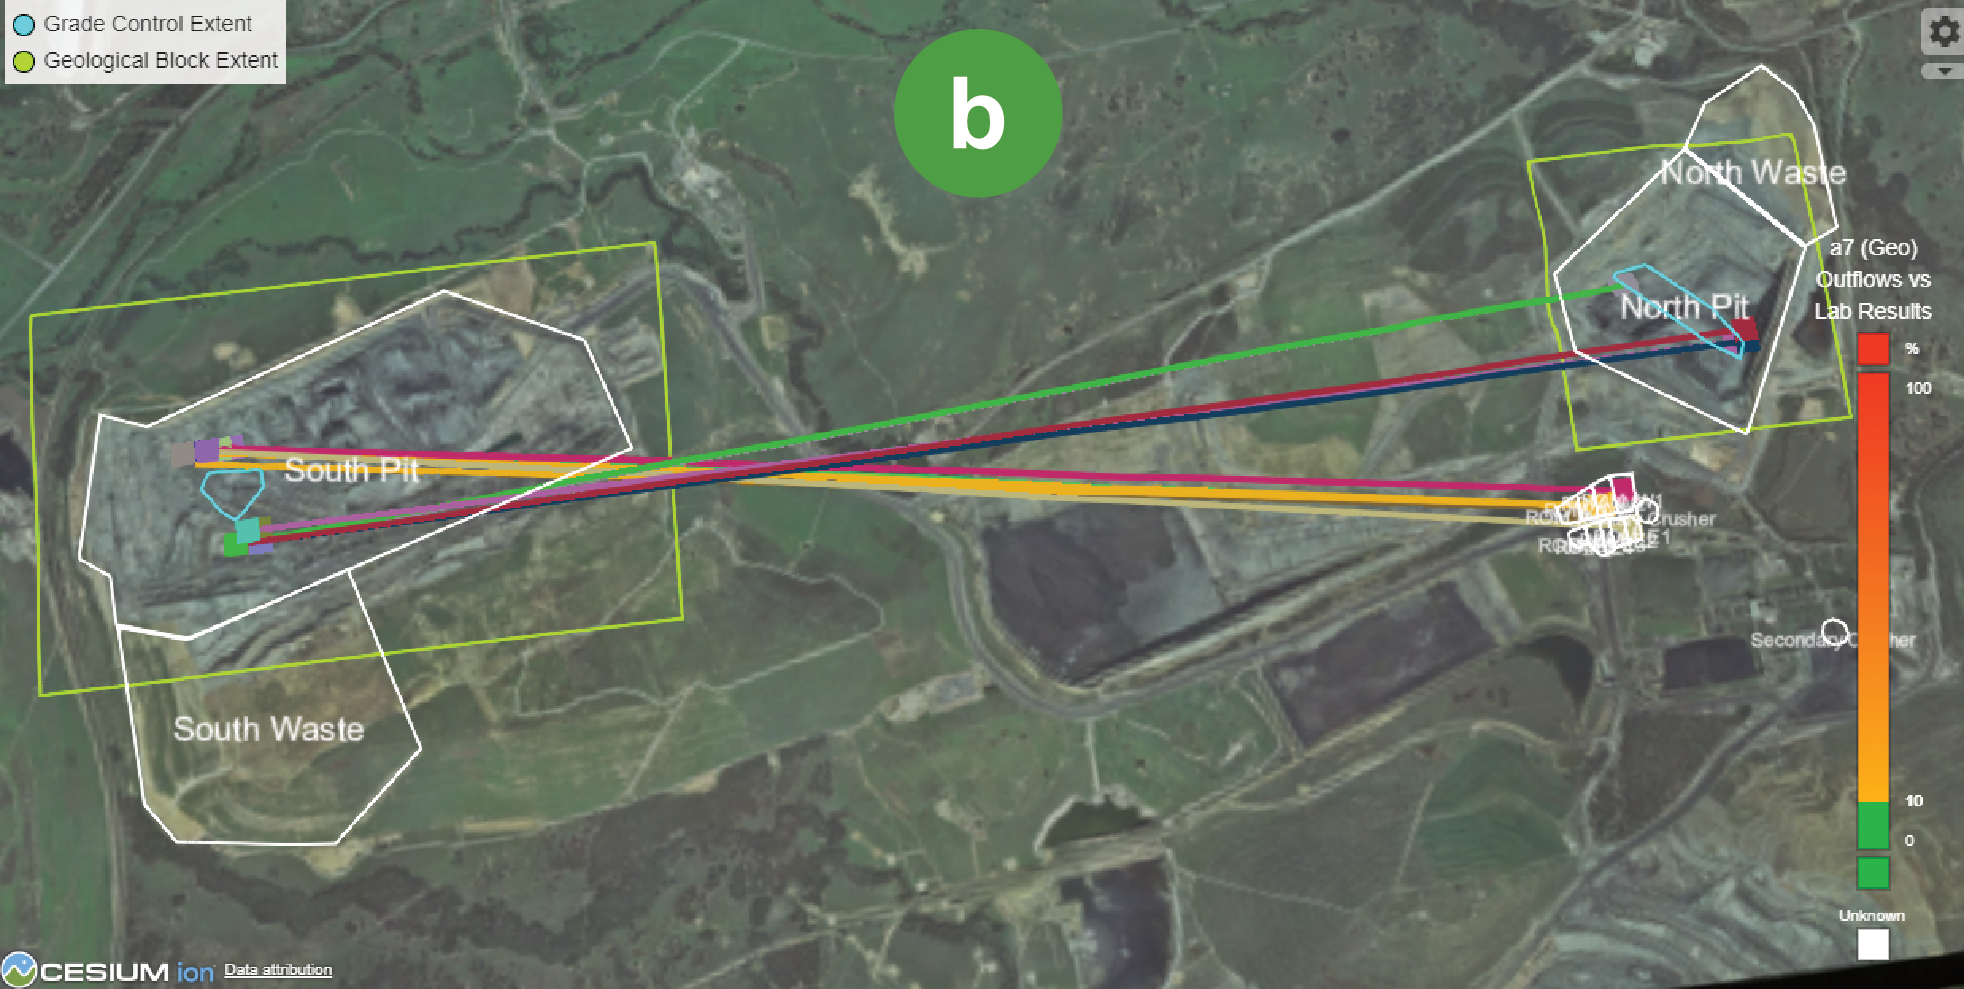
Locate and identify grade control blocks. Display links connecting re-handled material to a stockpile or sink. For more details , see Outflows > Viewer By Time. |
| Viewer by Area | Display grade control and geological blocks within a selected area. For more details, see Outflows > Outflows. | |
|
|
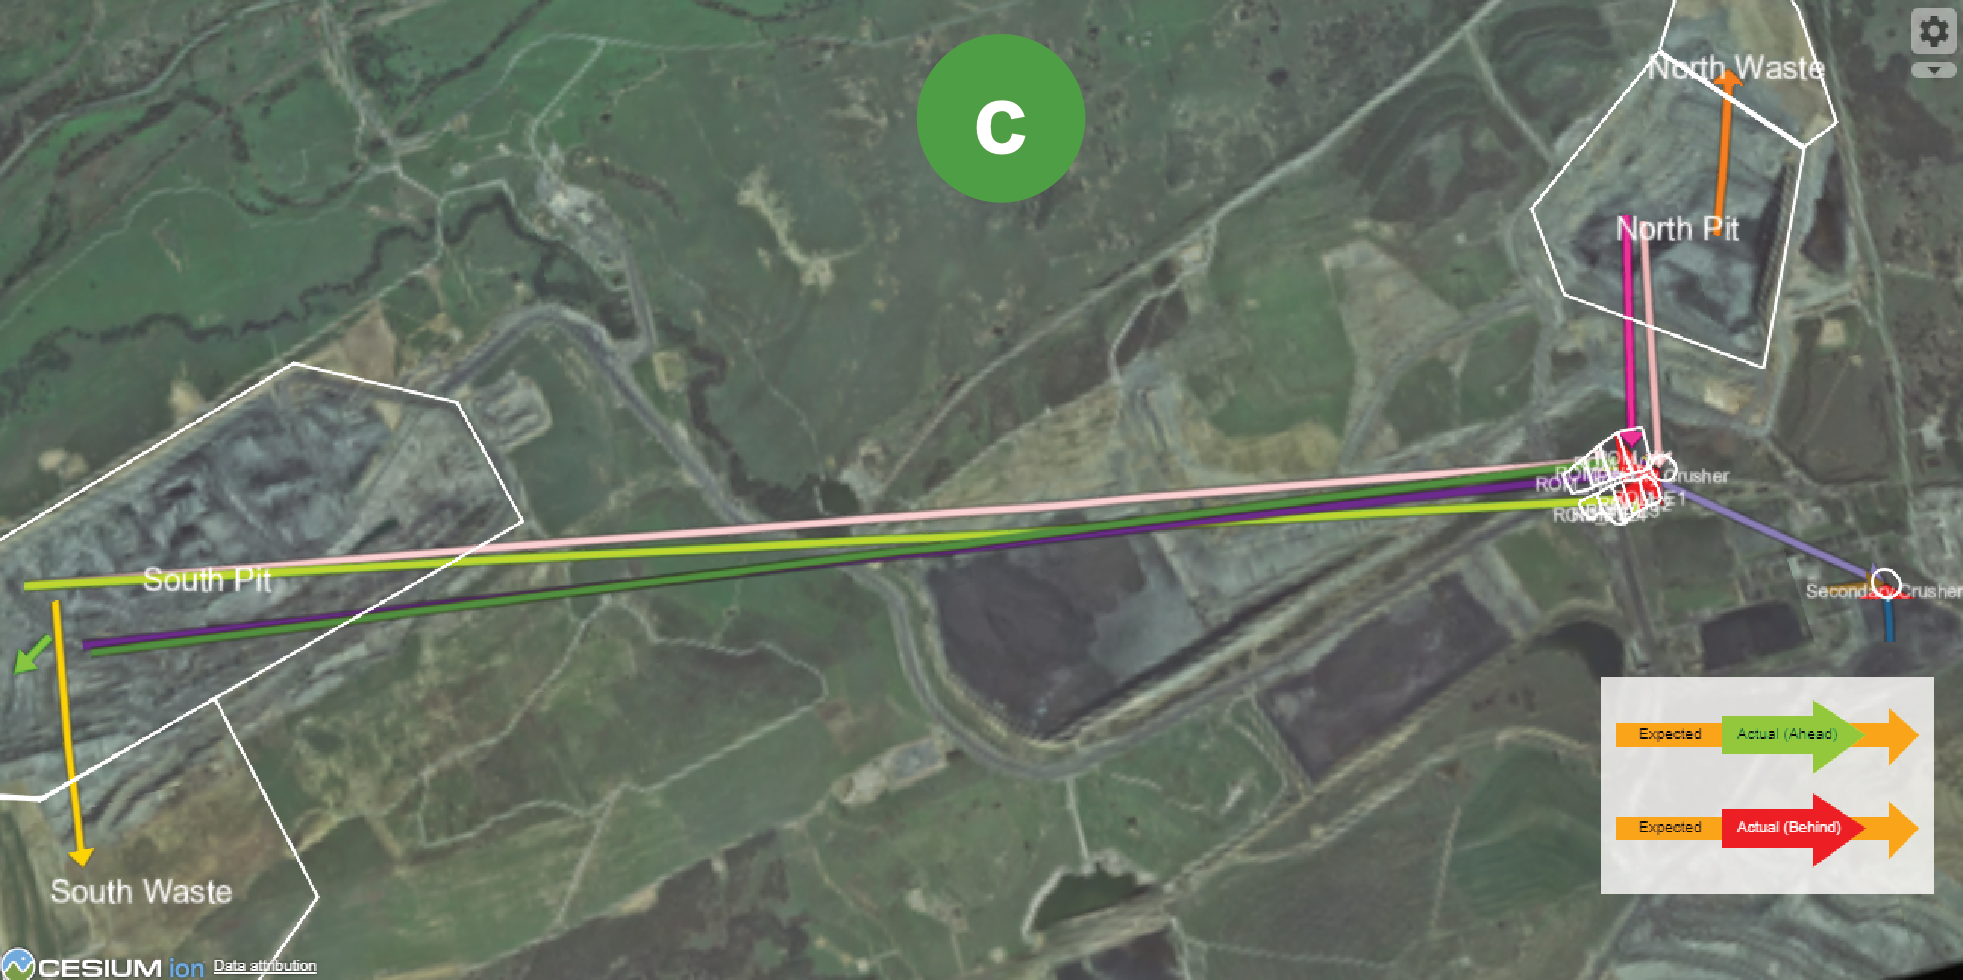
Viewer | Display the origin and destination of scheduled run-of-mine movements. For more details, see Mine Plan - Viewer |
| Blend Plan Calculator | Select sources by area of cross-section in the Plan tab. For more, see Mine Plan > Blend Plan Calculator. |
Examples of different viewers are:  Viewer,
  Outflows - Viewer by Time, and
  Mine Plan Viewer.
In-viewer configuration controls
The controls to customise what you view are inside the viewer panel, near the top right-hand side, as follows:
|
|
The cog opens the Options panel. The following options are separated into categories. Expand the drop-down for each category to display the following: |
| Imagery |
Open the imagery drop-down to enable available Cesium ion image maps. If no image is selected, the default imagery used is Bing Maps. If available, click on the |
| Zone | Click on the toggle to display or hide zones. Click on the Show Zones drop-down to select specific zones to display. |
| Stockpile |
Open the stockpile drop-down to configure the following:
|
| Grade Control Model |
Open grade control model drop-down to change the following general options:
|
| General |
Open the general drop-down to change the following general options:
Click |
|
|
Display or hide additional functions as follows: |

|
Recentre Camera Orientation returns the camera’s tilt, bearing, and zoom to the default position at the centre point of the current view, as illustrated.
|
|
|
Go to position opens the Navigate to: dialog. Open the Coordinate Reference drop down to select either Local Mine Grid or Latitude/Longitude, then enter the required values.
Click on |
 to confirm your preferences, or just click outside the options panel.

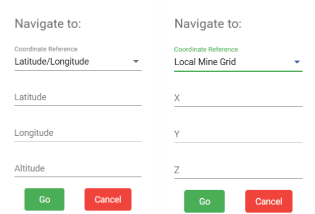
 to centre the view over the selected coordinates or
  to close the dialog.
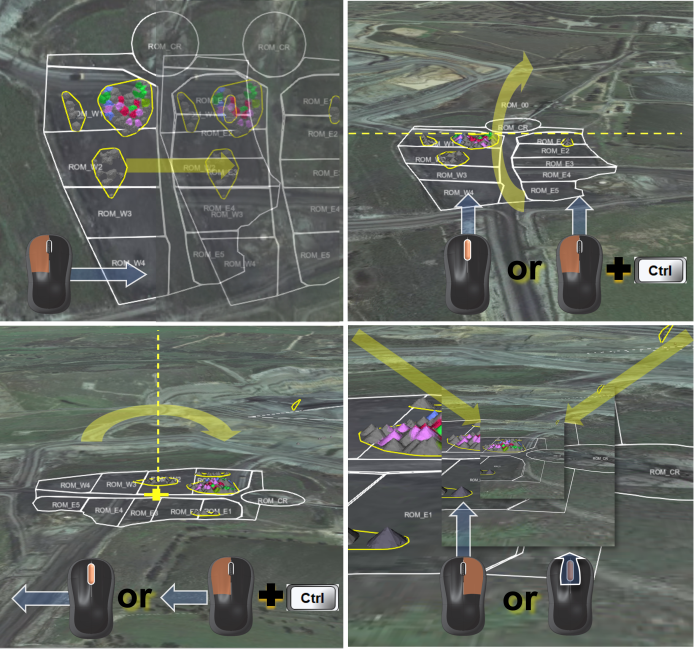
View manipulation (panning, rotating, and zooming)
Control your pan, tilt, and view in any of the viewers by using the following mouse and keyboard combinations. Tilt, rotation and zoom allow alternative mouse and keyboard combinations as illustrated in the examples below.
Use the mouse to control the direction of the action you perform, as illustrated below, for example:
-
Move the mouse while pressing the left mouse button to pan.
-
Move the mouse while pressing the middle mouse button to rotate or pitch around the z-axis.
-
Move the mouse button while pressing the right mouse button to zoom, or simply scroll the middle mouse button for a stepped zoom.
Making polygons to create an area or zone
Create polygons to select an area of interest, if available. The usage case depends on the viewer. To begin, click the  button, then continue with these steps:
-
Place your mouse pointer over the required location and click to add the first point of your polygon.
-
Move the mouse pointer and click to add more points until the desired area is created.
-
Press Space to finish.
Tip: Press Esc or click
 to remove your polygons from the viewer. Example
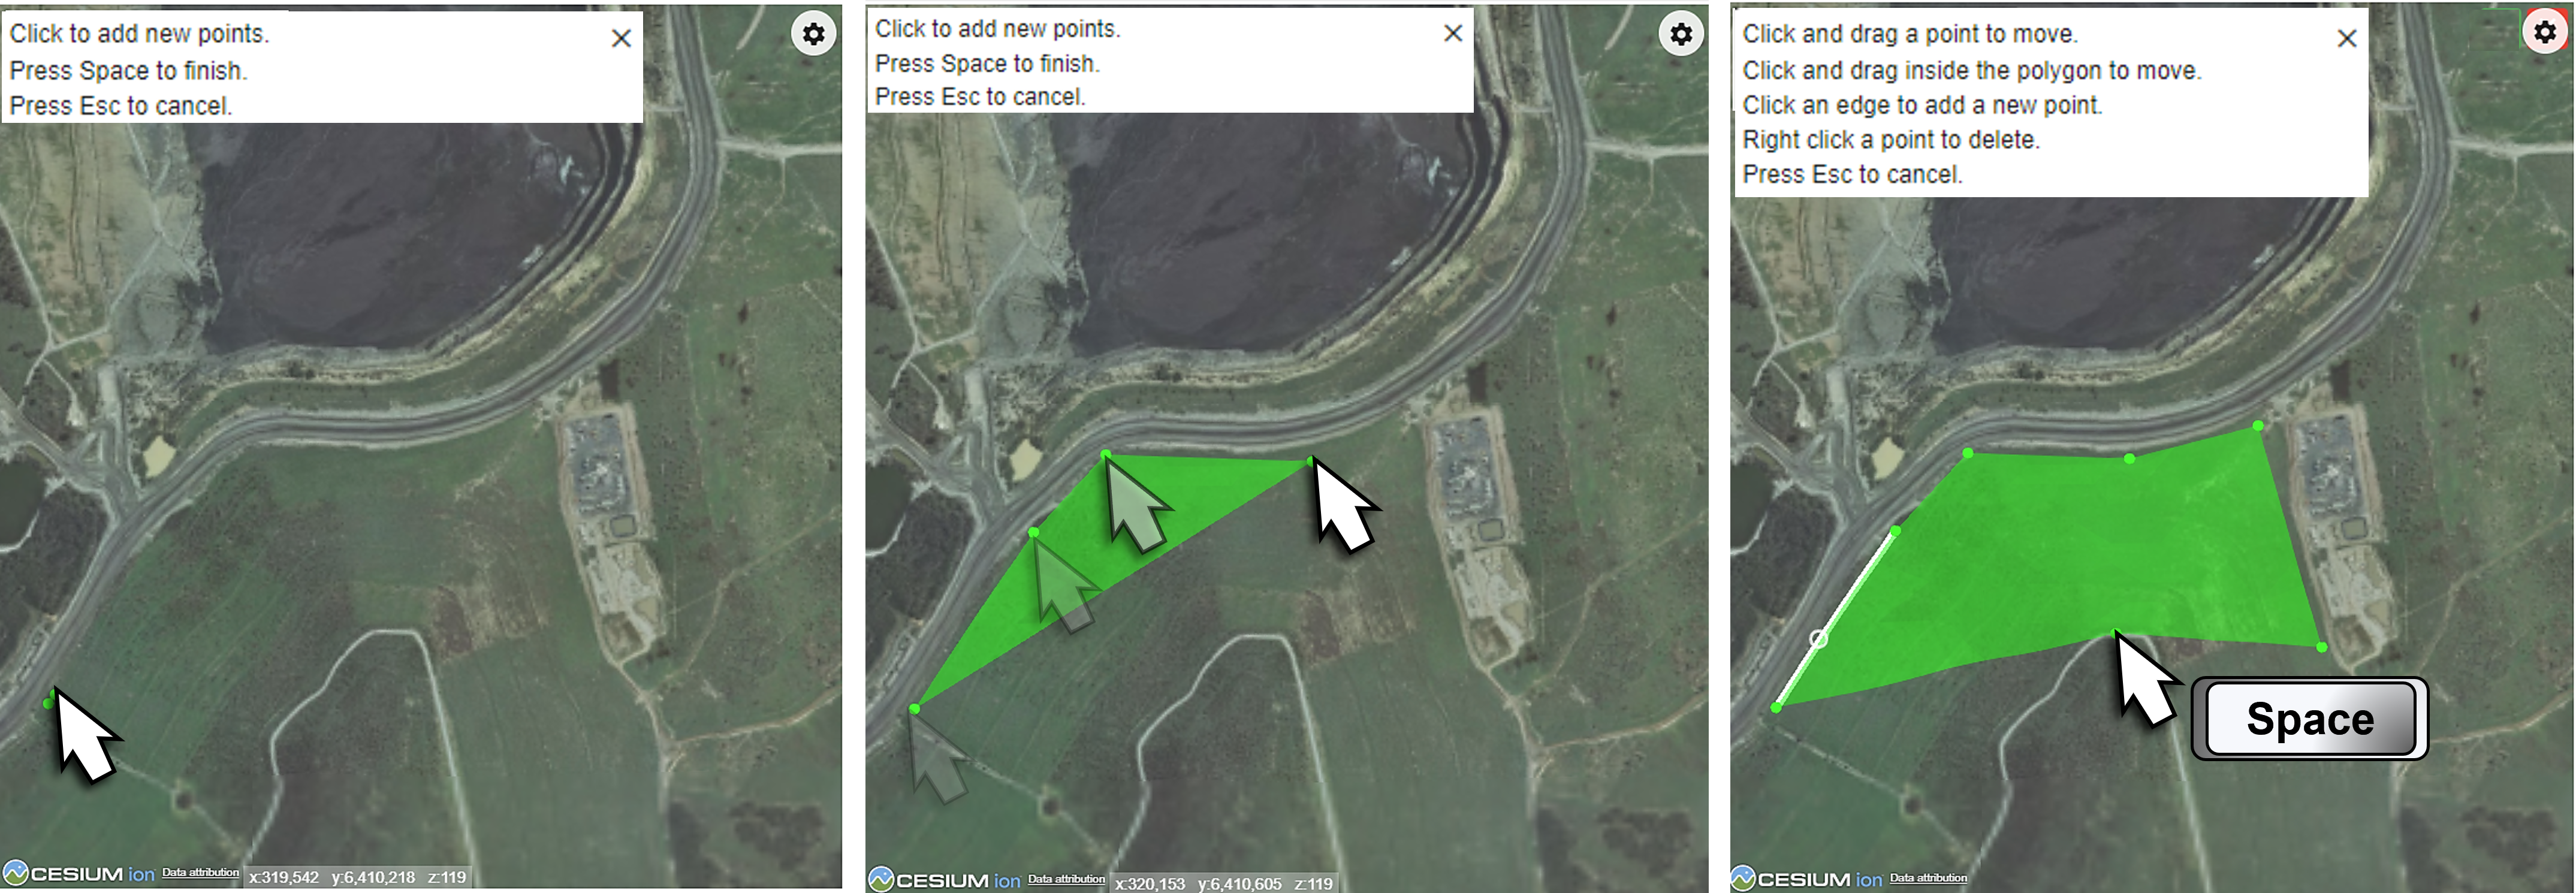
Note: When more than one polygon is created, each polygon is allocated a different colour.
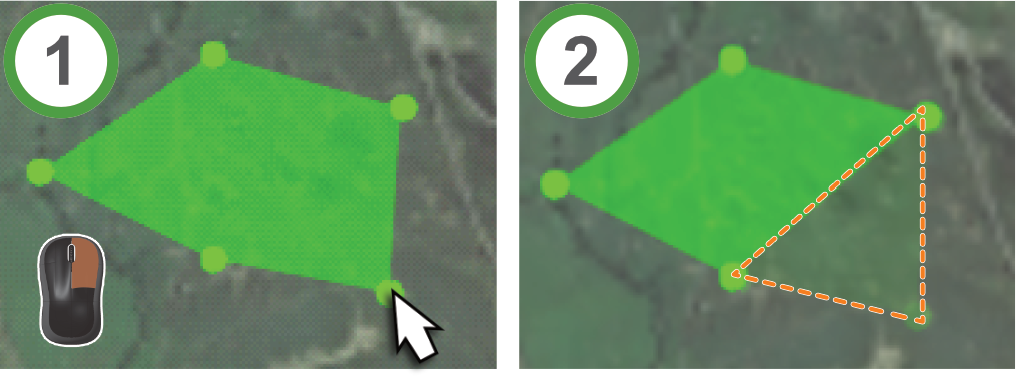
Modifying polygons
A polygon that you created might need to be adjusted, these adjustments can be made as follows:
- Drag any point in the polygon to change its size and shape.
- Click anywhere along an edge of the polygon to create a new point.
- Right-click on a point to delete it.
- Click inside the area and drag the polygon to another location in the view.
- Press Esc to remove the current polygon.
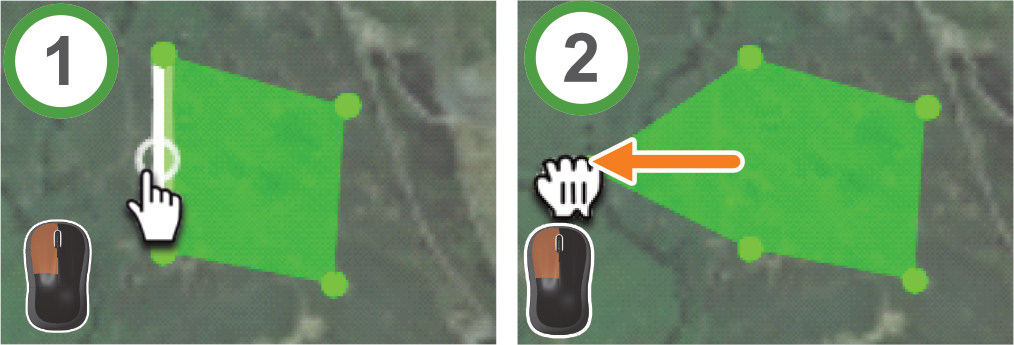
Above: adding facets to a polygon by clicking on a point along its edge and dragging it into position.
Below: deleting a point using the right mouse button.
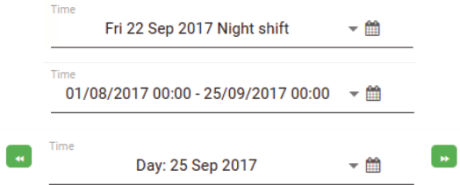
Using the Time drop-down and the calendar picker
Many of the tools offer the ability to select daily, weekly, or monthly periods of time; you can also select shifts, or a customised range, allowing you to filter information within those constraints. The time and calendar picker makes it easy to select the required time range when required.
|
|
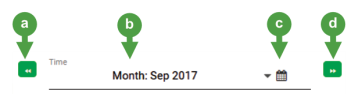


The time and date picker allows you to filter data that falls within a user-defined period using the available controls.
- Open the Time drop-down and select a preset period or shift from the list (shift, day, week, month, etc.).
- Use
 and
and  buttons (if available) to jump to the previous or next time period (shift, day, week, month, etc.), respectively.
 - Click
 to open the calendar picker and select a start and end date, and time. Click
  to save and close the calendar picker.
For each method, the selected time period will be displayed in the Time drop-down.
The following three time periods correspond to a shift, a time range chosen from the calendar picker, and a daily increment.