Getting Started
Learn the essential operation of PointModeller and start working with your data.
Tip: We recommend you also do the free PointStudio Essentials online training course. To access this course, visit Maptek Online Training.
Launching PointModeller
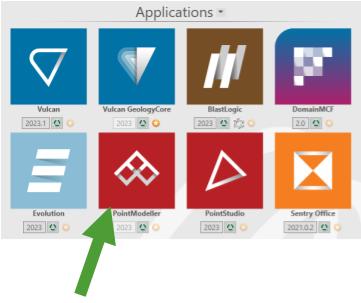
Launch PointModeller from the Maptek Workbench Start Page. Click on the application tile.
When you start PointModeller, the Open Project start-up dialog appears. Here you must choose a project to open. You can select an existing project, or start a new one.
-
To open an existing project, either select it from the Recent projects list, or navigate to its location by clicking Browse.
-
To start a new project, click New.
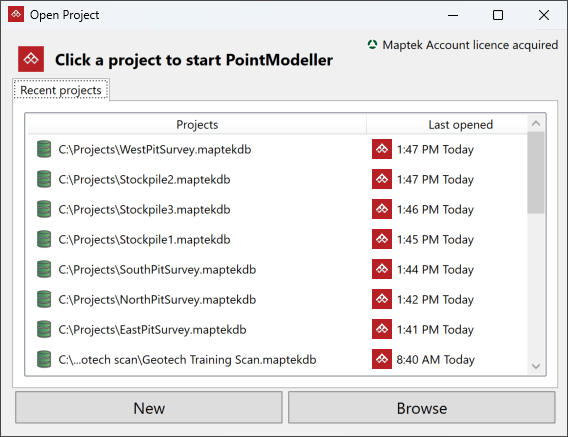
PointModeller will start by loading the selected project. Existing projects will open to their last opened state.
For more details on projects, see Projects.
Interacting with PointModeller
Understand the features and methods of interacting with PointModeller.
User interface
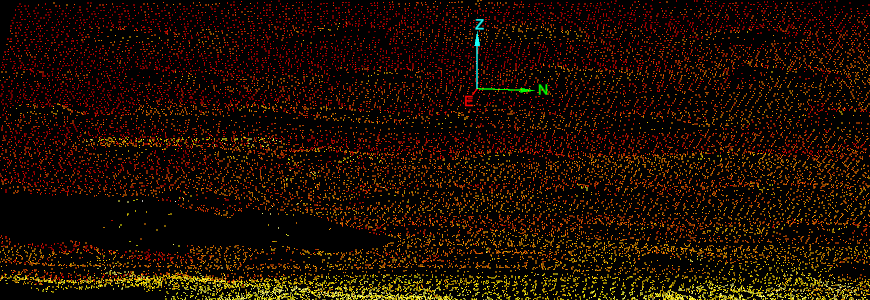
When PointModeller is open, you can explore and interact with the user interface.
|
|
|
Key elements of the user interface referenced in this guide. |
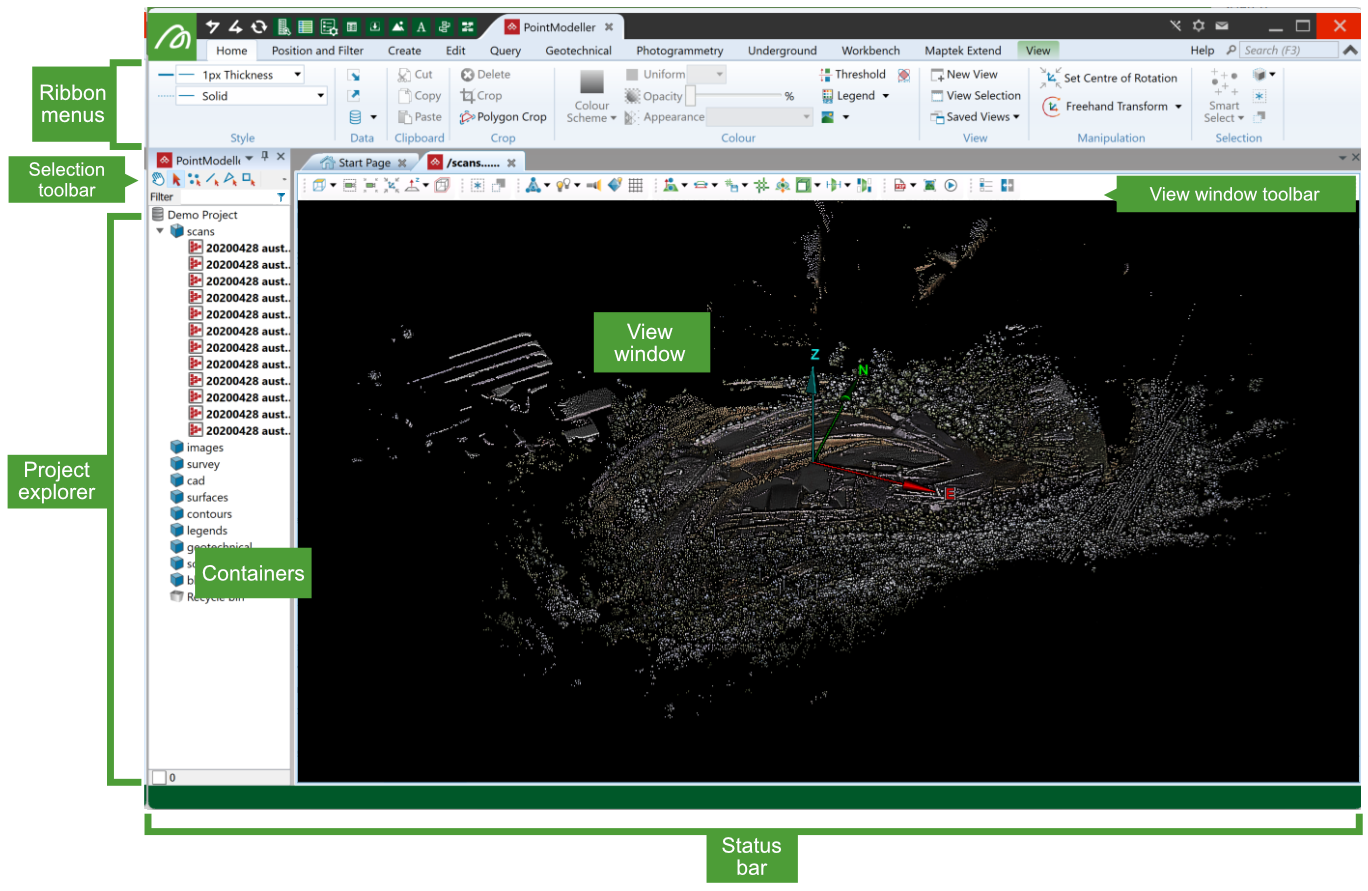
See User Interface to learn about all of its features.
Tool panels
Many tools display panels for you to configure settings, enter coordinates or provide additional information.
Most panels include the following three buttons:
-
OK: Runs the tool and closes the panel. Click this if you only need to run the tool once.
-
Apply: Runs the tool, but leaves the panel open. Click this if you want to run the tool again with different settings or data.
-
Cancel: Closes the panel without running the tool. Click this especially if you have already clicked Apply and do not need to run the tool again.
Many fields in tool panels also have context menus, from which you can set specific parameters.
Mouse controls
To interact with PointModeller you will need to know essential mouse and keyboard combinations.
-
Use the left mouse button for most operations, including clicking tool buttons and selecting individual data.
-
Click the right mouse button to open context menus.
-
Hold down the middle mouse button to drag objects from the project explorer into a view window or tool panel.
-
In a view window, while holding the Alt key:
-
Drag the left mouse button to rotate the view.
-
Drag the middle mouse button to pan the view.
-
Drag the right mouse button to zoom the view at its centre.
-
Use the scroll wheel to zoom at the pointer location.
Tip: You can select
 (Hands-free manipulation) on the selection toolbar instead of holding the Alt key. While hands-free is active, you cannot make selections in the view window.
-
Keyboard shortcuts
Many tools and commands in PointModeller are accessible via keyboard shortcuts, some of which appear throughout this guide. You can also use many generic Windows shortcuts, such as Ctrl+Z (Undo), Ctrl+X (Cut), and Ctrl+V (Paste) in PointModeller.
As you learn to use PointModeller, you will become familiar with many of its shortcuts.
See Keyboard Shortcuts for a complete list of shortcuts available in PointModeller.
Importing data
You must import data into a project before you can work with it.
Note: Changes you make to data occur in the project. The original data files will be unchanged.
-
To import data, on the Home tab, in the Data group, select
 Import, or press Alt+F2.
When the data import tool opens:
-
Click
 and browse to the data location.
 -
Select all files to import and click Open.
-
Click OK on the Import panel.
-
The data will import into the project, and appear in the project explorer, sorted into the appropriate containers.
-
Click
 next to a container to view its contents.
Note: Import is an all-in-one tool that can open multiple data types from the same folder simultaneously. Some data types may require additional configuration; the import tool will request this when required.
For further detail on the import tool, see Import.
Note: You can also export data and objects in different formats for other applications, depending on the types of data selected. See Export for details on data types and instructions on exporting data.
Viewing data
Load data into a view window so that you can work with it.
Loading objects into a view
-
To view an object, double-click it in the project explorer.
-
Double-click a container to load all the objects in the container.
Objects will be loaded into the current view or, if no views are open, into a new view.
Alternative ways of viewing objects are as follow:
-
Select the objects or containers and press Ctrl+Alt+N.
-
Right-click on an object or container and select View <object name> in Current View or View Selection in Current View.
-
Drag objects from the project explorer into the view.
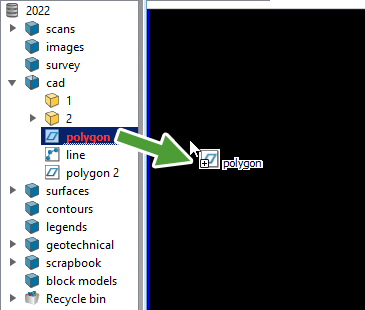
Tip: You can drag-and-drop unselected objects. Any other objects that were selected will remain selected.
Manipulating the view
Manipulate the view to get the best look at data for operations to be performed.
-
To change manipulation mode, click the
 Set Manipulation Mode button on the view window toolbar to cycle through the options.
|
|
Z Up Mode (Z) Constrains the Z axis to moving vertically in your viewing direction, regardless of camera location. |
|
|
Look from Mode (K) Fixes the viewpoint. View rotates around the viewpoint. |
|
|
Plan View Mode (P) Sets the view to look down on the data. |
|
|
Screen Mode (S) Enables unconstrained view rotation. |
-
To set the centre of rotation, click
 on the view window toolbar (or press C), and then pick a location in the view.
Note: In z-up and screen manipulation modes, the axes are displayed at the centre of rotation, so will move accordingly.
-
To manipulate the view, hold down the Alt key while operating the mouse. The table below summarises the operation controls.
Operation Combination  Rotate
Alt+left mouse button drag  Pan
PanAlt+middle mouse button drag
 Zoom (from the view window centre)
Zoom (from the mouse pointer location)
Alt+right mouse button drag
Alt+scroll
Changing the appearance of data
To make it easier to work with your data, you can change its colouring in the view window, as follows:
-
Select the data in the project explorer.
-
On the Home tab, in the Colour group, click
 Colour Scheme and select from the drop-down.
You can also adjust the data appearance with one of the other tools from the Colour group. For more detail, see Colour.
Hiding and showing objects
You can hide objects from view without unloading them.
-
To hide an object in the view, right click on it and select Hide from the context menu.
The visibility editor enables you to control the visibility of objects loaded into the view.
-
To open the visibility editor, press V, or click
 on the view window toolbar or the View tab.
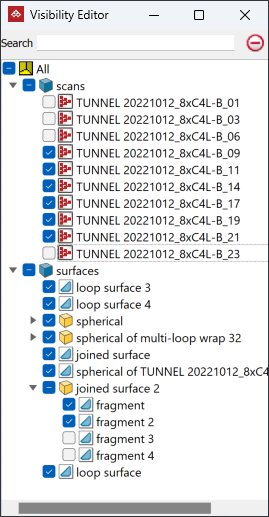
-
Click on the check boxes next to listed objects or groups to manage their visibility.
The table below summarises the keyboard shortcuts for object visibility actions.
| Action | Keyboard shortcut |
|---|---|
|
|
V |
|
|
H |
|
|
H+click |
|
|
Shift+H |
|
|
J |
|
|
Shift+J |
Viewing sections
Define a section view quickly using the Quick Section options in the view window toolbar.
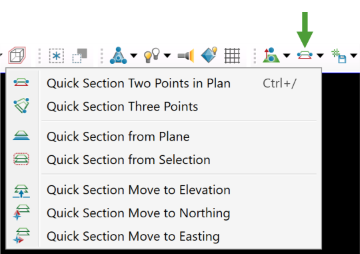
-
To control the section, use the keyboard and mouse combinations summarised in the table below:
Operation Combination  Move section plane
Ctrl+Alt+left mouse button click and drag  Change strip thickness
Ctrl+Alt+right mouse button click and drag
Tiling and tying views
You can tile views loaded with different objects side-by-side to compare objects in the same scene.
Note: Tile and tie tools are only available when there are at least two view open windows.
-
To tile views, on the Workbench tab, in the Tile group, select
 Tile.
Tile.PointModeller will rearrange all open view windows in the user interface side-by-side.
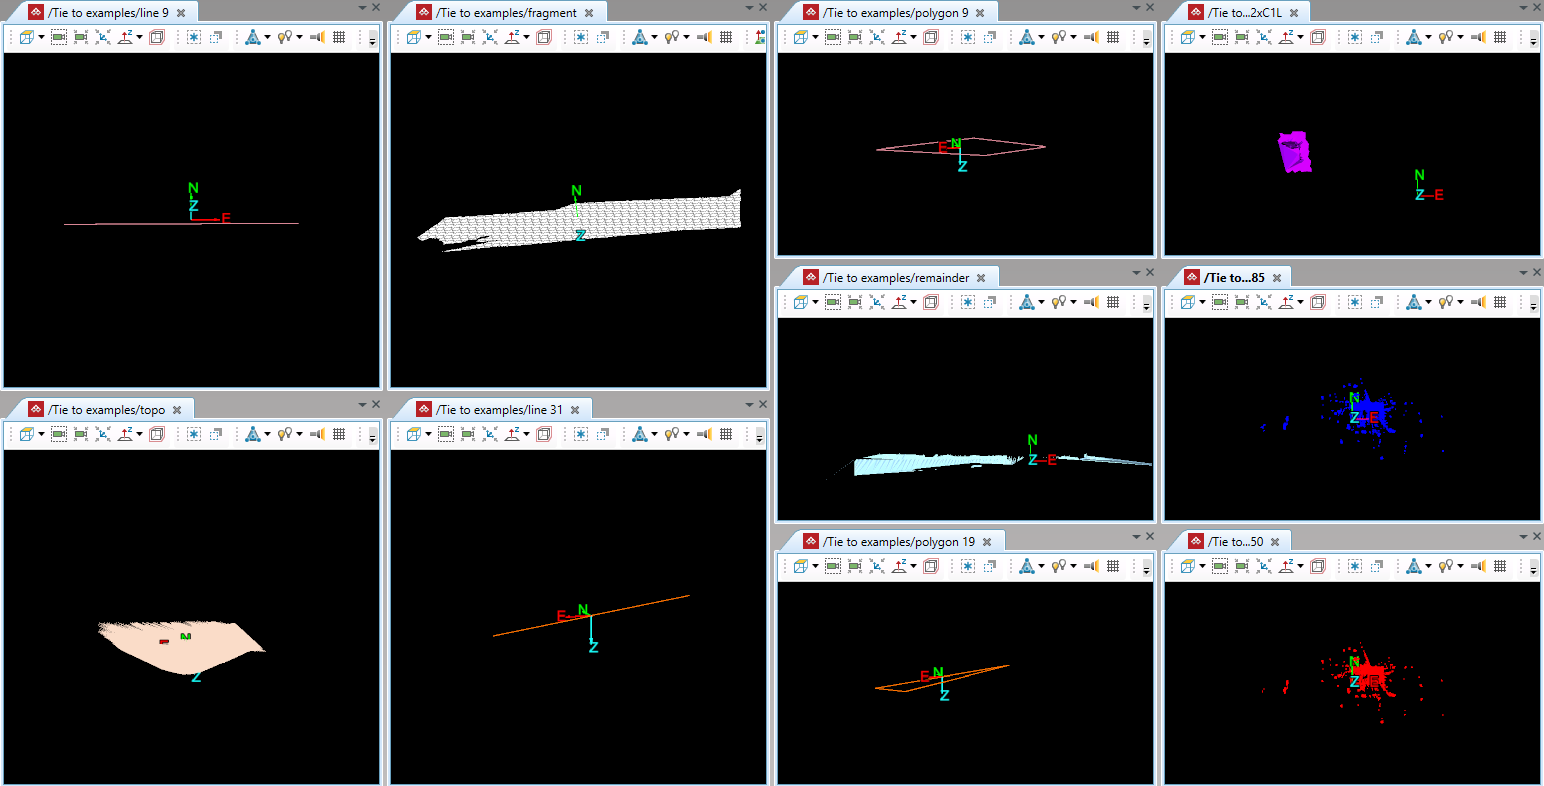
You can also tie views together so that they will all be viewed from the same direction and orientation. When you manipulate one view window, any windows tied to it respond identically.
-
To tie views together, on the View tab, in the Camera group, from the
 Tie to drop-down, select a view window to tie to the current view window. Repeat to tie more windows.
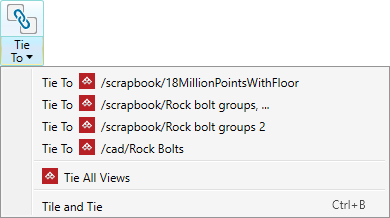
The selected windows will tie together without rearranging.
Tip: You can also find
Tie to on the view window toolbar.Note: Tied views have colour-coded Tie to icons to distinguish between groups of tied views.
-
To tile and tie views in one step, select Tile and Tie from the
Tie to drop-down.All open views will be tiled and tied.
-
To untie views, select a view to untie or Untie All Views from the
 Tie to drop-down.
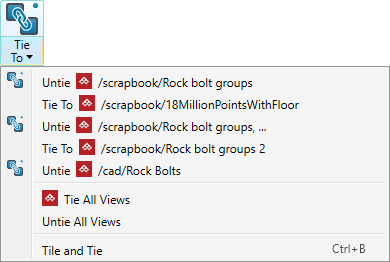
Views will be untied, but will remain tiled.
For more detail, see Tying view windows together.
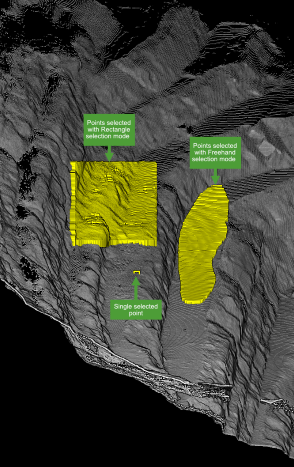
Selecting data
PointModeller selects objects (![]() ) by default. This means clicking on an object in a view window selects the whole object.
) by default. This means clicking on an object in a view window selects the whole object.
Other selection types are: points (![]() ), edges (
), edges (![]() ), facets (
), facets (![]() ), cells (
), cells (![]() ) and blocks (
) and blocks (![]() ). Use these specific selection types to select component points, edges, facets, cells, or blocks in larger objects in a view window.
). Use these specific selection types to select component points, edges, facets, cells, or blocks in larger objects in a view window.
Use the following shortcuts to switch between selection types:
| Type | Shortcut | Type | Shortcut | |
|---|---|---|---|---|
|
|
1 |
|
4 | |
|
|
2 |
|
5 | |
|
|
3 |
|
7 |
Note: While selections in a view window are based on the active selection type, selections in the project explorer or report window always use object selection type.
The selection status bar at the bottom of the project explorer tells you how many objects and primitives are selected. The icons indicate the types of selected objects and primitives.
-
The object type icon is blank when multiple types are selected.
-
The primitives count is not displayed if object selection type (
 ) is active.
 -
The primitive type icon always matches the primitive selection type. It is not possible to select multiple primitive types.
Expand below for detailed instructions on selecting objects.
|
To select objects in the project explorer, either click on a single object to select it, or click on a container to select all the items in the container. Tip
|
|
To select data in a view window:
|
Some panels require you to supply a selection.
-
To populate or add to a selection field in a panel, do one of the following:
-
Click
 above the field to add the current active selection.
 -
Drag the selection from the project explorer onto the field.
-
Click on an object in a view window while the field is active (indicated by a red label).
Tip: You can add an object to a selection field in a panel without changing your active selection by dragging with the middle mouse button.
-
-
To remove an item from a selection field, select it in the list and click
 .
.
Need more detail? See Selecting data in How do I?.
Positioning data
PointModeller includes tools for ensuring objects are in the correct position and orientation relative to each other.
Transforming data
Transform tools enable you to translate and rotate objects into position.
A quick and easy way to transform data is to use the Freehand Transform widget. On the Position and Filter tab, in the Transform group, click ![]() Freehand Transform. The widget will appear in the active view window aligned with the view’s axes.
Freehand Transform. The widget will appear in the active view window aligned with the view’s axes.
|
|
The Freehand Transform widget consists of three sets of manipulation handles:
|
Select data to transform then manipulate the handles with the middle mouse button, as follows:
-
Drag an axis to translate the data in one dimension.
-
Drag a plane to translate the data in two dimensions.
-
Drag a ring to rotate the data about the axis of the corresponding colour.
You can also set a precise one-dimension translation distance and rotation angle:
-
Middle click on a handle then enter a value.
-
For a two-dimension transformation, repeat with the next handle.
Click ![]() Freehand Transform again to toggle the tool off.
Freehand Transform again to toggle the tool off.
To learn more, see Freehand Transform.
Translate and Rotate are also available tool as panels, along with Scale and Mirror. For details, see Transform.
Registering data
The registration tools position and orient objects with respect to each other or global coordinate systems, based on specific criteria. Several tools are available for different situations.
The ![]() Automated Initial Positioning tool is a good starting point for most scans, repositioning and reorienting unregistered scans to approximately align with reference data. See Automated Initial Positioning. You should follow up with the
Automated Initial Positioning tool is a good starting point for most scans, repositioning and reorienting unregistered scans to approximately align with reference data. See Automated Initial Positioning. You should follow up with the ![]() Global Registration tool to fine-tune the registration (see Global).
Global Registration tool to fine-tune the registration (see Global).
For detail on all the registration tools, see Position and Filter and subordinate pages under Register.
Tip: To return a scan to its original position and orientation, on the Position and Filter tab, in the Register group, select ![]() To Origin from the Register drop-down.
To Origin from the Register drop-down.
Filtering data
Filter out redundant or erroneous points to reduce visual clutter and improve data processing.
To remove unwanted vegetation, machinery and infrastructure:
-
Select the scans to filter.
-
On the Position and Filter tab, in the Filter group, click
 Topography.
 -
Adjust the settings as required.
- Click OK
The tool will apply the filter parameters to hide the unwanted points and retain only the topography.
Tip: You can redisplay filtered points
by clicking ![]() Show All. See Show All.
Show All. See Show All.
See Topography and adjacent topics for more information.
|
|
|
A scan to be filtered (truck to be removed). |
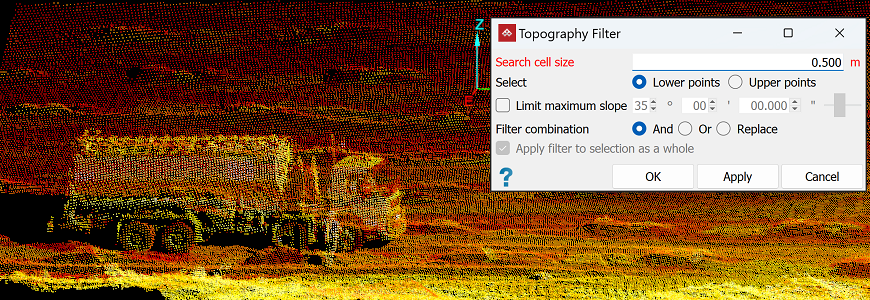
|
|
|
The result of topographic filtering. Any unwanted points remaining must be removed manually. |
CAD and modelling
PointModeller provides a suite of CAD tools to help with data modelling and analysis.
Action plane
The action plane facilitates viewing data in sections and drawing lines and shapes in 3D space.
-
On the view window toolbar or on the View tab, in the Action Plane group, click
 Visibility to show the action plane.
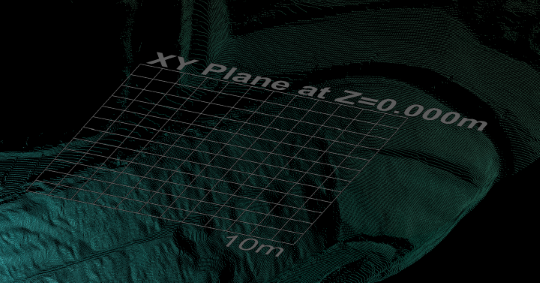
Note: The action plane extends in all directions to infinity, though the displayed grid does not.
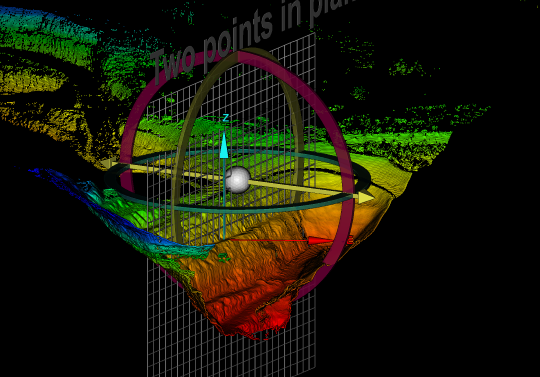
The action plane’s default position is at the mean elevation of the loaded data, parallel to the XY plane, but you can position it wherever needed. Select a suitable option from the ![]() Set drop-down and follow the prompts.
Set drop-down and follow the prompts.
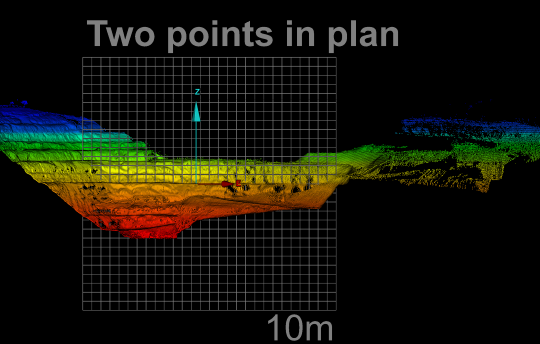
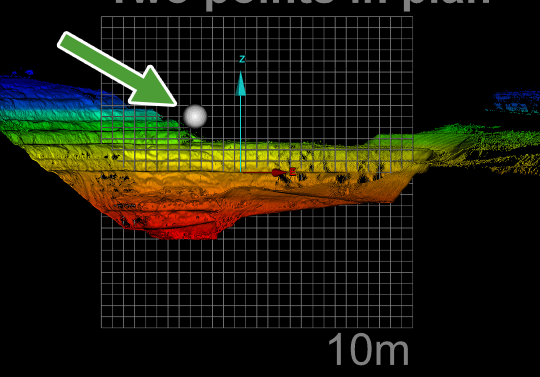
For example, select ![]() Two Points in Plan, then click on two points in the view. This will position the action plane vertically through the selected points.
Two Points in Plan, then click on two points in the view. This will position the action plane vertically through the selected points.
You can also move the action plane using the manipulator tool.
-
To show the manipulator, click
 Manipulator, then middle-click on the action plane where you want the rotation centre for the action plane.
To rotate the action plane:
-
Hover the mouse over a manipulator ring so that it is highlighted.
-
While holding, the middle mouse button, drag the ring to rotate the plane.
-
Repeat with the other rings, as needed.
To translate the action plane:
-
Hover the mouse over the manipulator axis to highlight it.
-
While holding, the middle mouse button, drag the axis to translate the plane.
To reposition the manipulator, do one of the following:
-
Left-click anywhere in the view window, then middle-click on the new location.
Or
-
Middle-drag from anywhere in the view window until the manipulator is in the new location.
Click ![]() again to hide the manipulator.
again to hide the manipulator.
Select the ![]() View From options on the view window toolbar or the View tab, in the Action Plane group to view the action plane from different predefined directions.
View From options on the view window toolbar or the View tab, in the Action Plane group to view the action plane from different predefined directions.
See Action Plane for comprehensive detail.
Entering coordinates
You can manually enter coordinates in some tool panels to set a precise location.
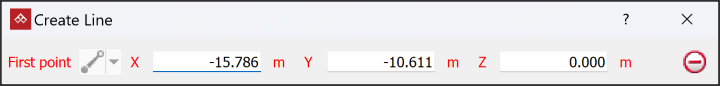
Press Tab to step between fields and Enter to finish.
Some other tools allow you to enter coordinates via the status bar.

Enter coordinates in each field, then click ![]() to accept, or
to accept, or ![]() (when enabled) to finish.
(when enabled) to finish.
Tip: Use this method if you need to place a point at a precise location.
Note: When you pick a point in a view window its coordinates will appear in the status bar fields.
Snapping to points
Place CAD objects accurately with snap modes.
Snap modes assist with point placement when drawing CAD objects, and work in concert with the action plane.
When you select a drawing tool, the snap modes become available at the right-hand side of the status bar.

Snap modes allow you to force a new point onto the action plane or place it anywhere in 3D space.
Snap targets enable you to place drawn points in relation to other points or edges in the view, such as snapping to end or mid points of existing lines, or at an angle to another line.
See Snap Modes for further detail.
Drawing lines or shapes
Define regions of interest by drawing lines or shapes along boundaries or around features.
To draw a line:
-
On the Create tab, in the Draw group, click
 Line.
Line.Note: You can only draw 2D objects on the action plane. Place the action plane in where required.
-
Select an appropriate snap mode.
-
Create the first point.
-
Create as many subsequent points as are needed.
-
Right click to complete the object.
Note-
When you click in empty space, the point is placed on the action plane.
-
When you click on an object, that point on the object is picked.
-
When you select
 (Pick Mode 2D), only points on the action plane are picked.
 -
When you select
 (Project to Action Plane), picked points are projected perpendicularly to the action plane.
Tip: Press 0 to increase line thickness in the view.
-
Follow this procedure for other lines and shapes.
Editing lines or shapes
The Edit tab has many tools to modify drawn objects to fine-tune designs and models. For example, with ![]() Add Points you can extend a line and with
Add Points you can extend a line and with ![]() Insert Points you can reshape an object, as follows:
Insert Points you can reshape an object, as follows:
-
In the Primitives group, click
 Insert Points or
  Add Points.
 -
Select the point on the line to extend from, or line segment to reshape.
As you move the mouse, transient geometry enables you to visualise the changes.
-
Create the new point.
For more detail, see Editing a line or polygon (edge network). Also, see the tool descriptions under Edit, especially in the Line and Primitives groups.
Modelling data
Surfaces are networks of triangles created by joining adjacent points. There are several different tools for creating surfaces, suited to different situations.
Create surfaces to model your data for volume calculations, as-built versus design comparisons, excavation plans and more.
For example, to model a stockpile:
-
Load and display all scans of the stockpile in a view window.
Note: There would normally be multiple scans from different directions to completely cover a stockpile.
-
Press C and pick a point near the stockpile base to reposition the axes.
-
Put the horizontal action plane at the elevation of the stockpile base:
-
On the View tab, in the Action Plane group, click
 XY from the Set drop-down.
 -
Select
 Move to Axes from the Set drop-down.
-
-
Draw a polygon on the action plane, around the base of the stockpile.
-
Reduce the scans to just the stockpile:
-
On the Position and Filter tab, in the Filter group, select
 Polygon from the Filters drop-down.
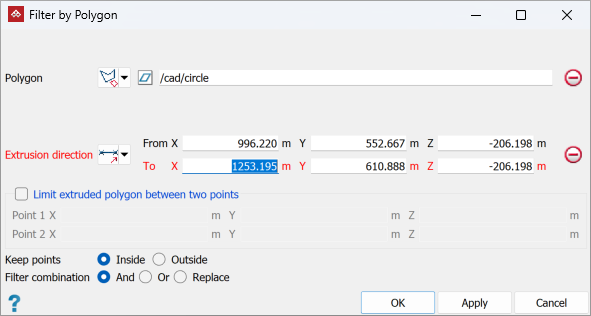
-
Drag the polygon drawn in step 4 into the Polygon field.
-
Ensure that Keep points is set to Inside.
-
Click OK.
-
-
Create a topographic surface of the stockpile:
-
Select all the scans of the stockpile.
-
On the Create tab, in the Surface group, click Topographic Surface.
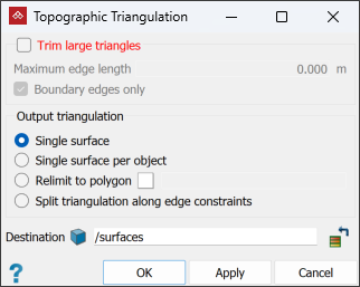
-
Under Output triangulation, ensure that Single surface is selected.
-
Click OK.
PointModeller will create the surface and place it in the
surfacescontainer. -
Note: The surface might have anomalies to be repaired before further modelling. See Despike and Fix Surface.
Now you can calculate the stockpile volume, as follows:
-
On the Query tab, in the Surface group, click
 Surface Volume.
 -
Drag the stockpile surface into the New surface(s) field.
-
Under Original surface, select Action plane, representing the base of the stockpile.
-
Click OK.
PointModeller will display the stockpile volume in the report window.
Refer to Common Tasks > Modelling data where several key data modelling procedures are described.
