

Getting Started
This section provides an overview of commonly used controls and introduces the various parts of the web-based user interface. If you are new to MaterialMRT or setting it up for the first time, please read through this section first to learn the basics of using MaterialMRT.
Note: Foreground and background colours on buttons and controls displayed in MaterialMRT Help may vary from those depicted herein. They can vary, depending on your operating system and browser colour scheme.
Signing in
MaterialMRT supports Microsoft Azure Active Directory for system access. Follow the sign-in method used by your organisation or as otherwise instructed. Typically, the steps are as follows:
-
Open the URL hosting MaterialMRT.
-
In the landing page, click
 .
. -
In the Sign in panel, enter your user name (or pick an account to log in to, if the option is available).
-
In the Enter password dialog, enter your password (or select an alternative sign in option, if available), then click
 . Once you sign in, the Dashboard page will open.
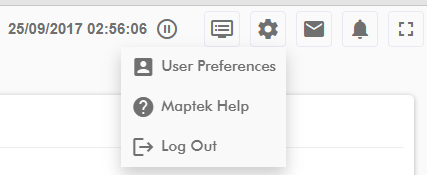
To log out, click  , then select
  .
.
Permissions and access to pages and tools
When a user profile is created, certain roles will be assigned. These roles not only determine what pages and tools you may use. Certain menus and controls discussed in MaterialMRT help may not appear unless certain privileges are granted. To learn more about roles and how they work, see System Preferences > Roles .
Navigating the MaterialMRT user interface
MaterialMRT has two globally available elements along the top of the browser window; these are as follows:
-
The system bar at the upper right-hand corner of the browser performs several functions. Administrators can manage the system using Site Configuration and System Preferences under System Tools. All users can update their telemetry preferences, log out of the system, and contact Maptek for assistance.
-
The User toolbar either opens a single tool in a browser window—such as Dashboard, Stockpiles, Viewer, or Trip Editor—or expands into a menu with several related tools. To learn more about each tool, click User Toolbar in the navigation pane and select an item.
|
|


|
System bar |

|
User toolbar |
Note: The default starting page after you log in to MaterialMRT is the Dashboard. To learn more, see User Toolbar > Dashboard.
Setting up for the first time
MaterialMRT requires your site parameters and zones to be configured upon deployment by the administrator. To learn more, see Site Configuration and System Preferences to set the specific configuration options and values used by MaterialMRT.
Visualising topology in MaterialMRT
MaterialMRT features interactive 3D viewers that can display the following:
-
Terrain with imagery
-
Zones
-
Stockpiles
-
Resource models
-
Tool-specific markers, labels and other indicators
Items that may be displayed or available in a specific viewer depends on the viewer used. The table below summarises the basic functions of each viewer.
| User toolbar button | Tool |
|---|---|
|
|
|
|
|
|
|
|
|
|
|
|
 Viewer
 Material Movements
 Outflows
 Mine Plan
|
|
|
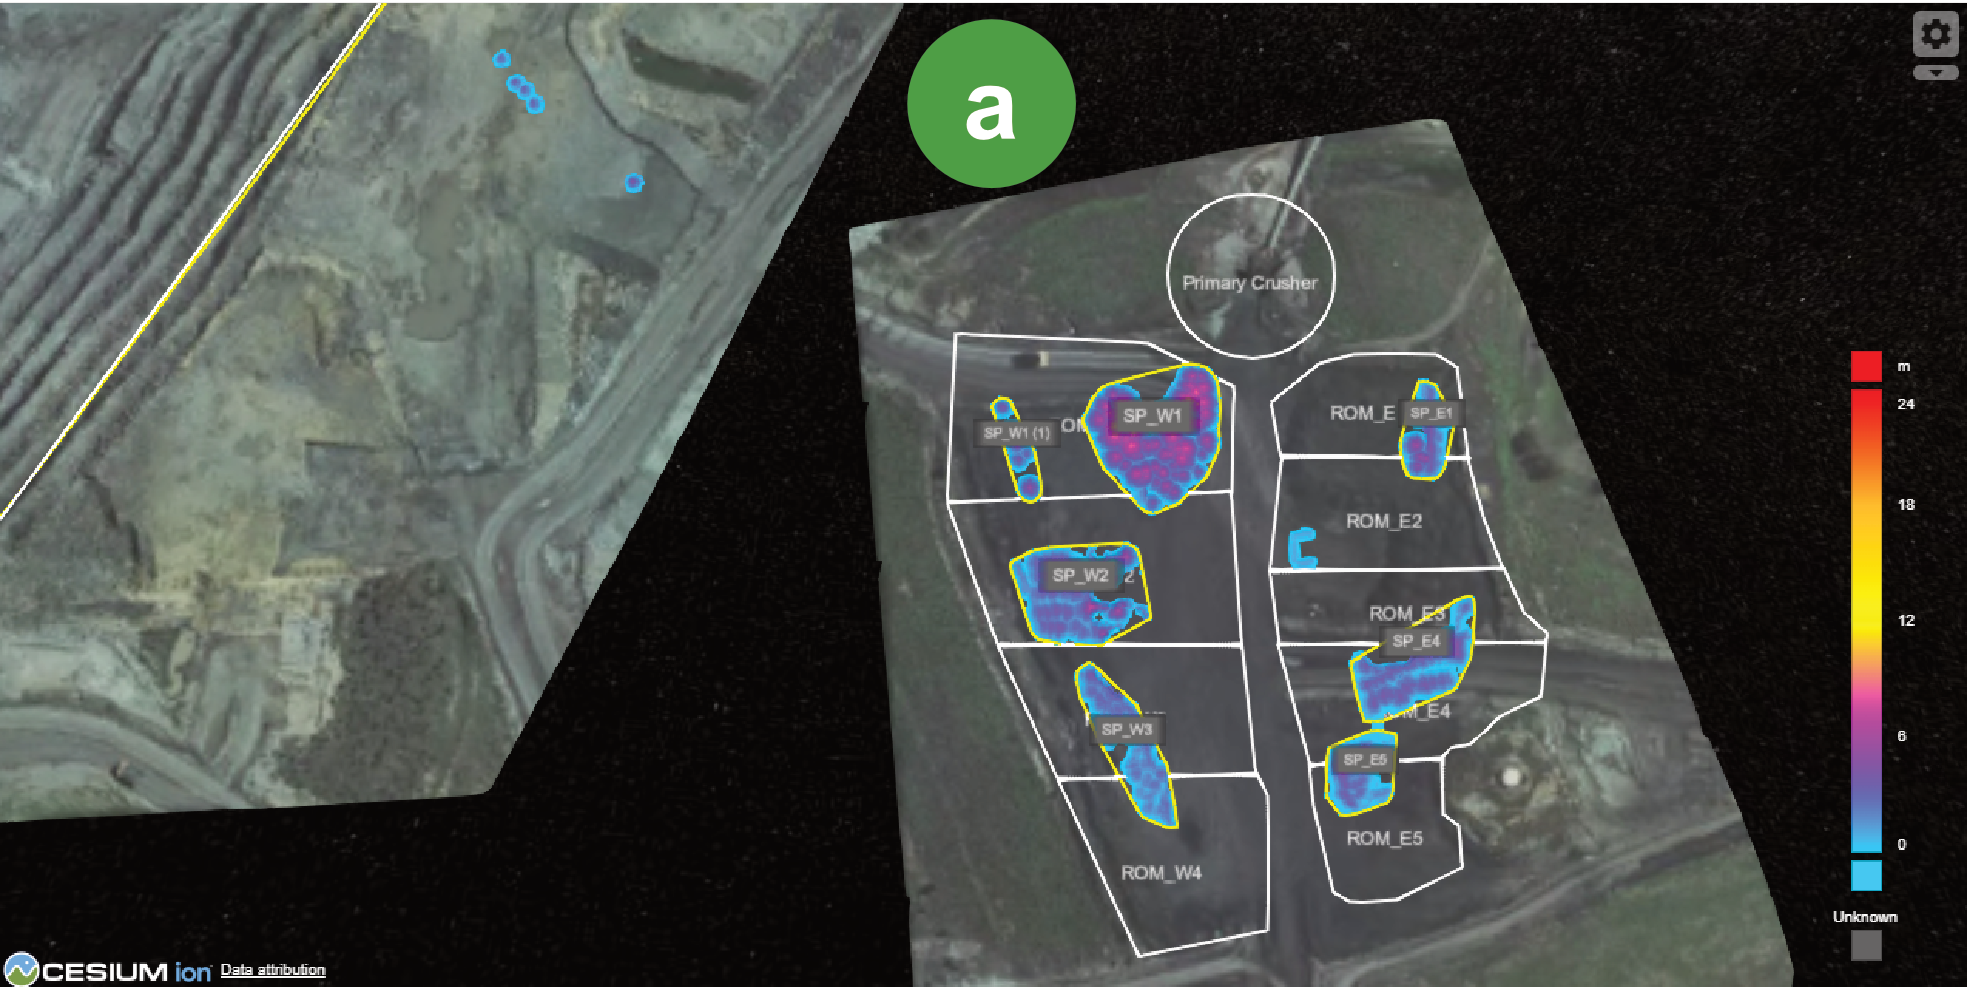
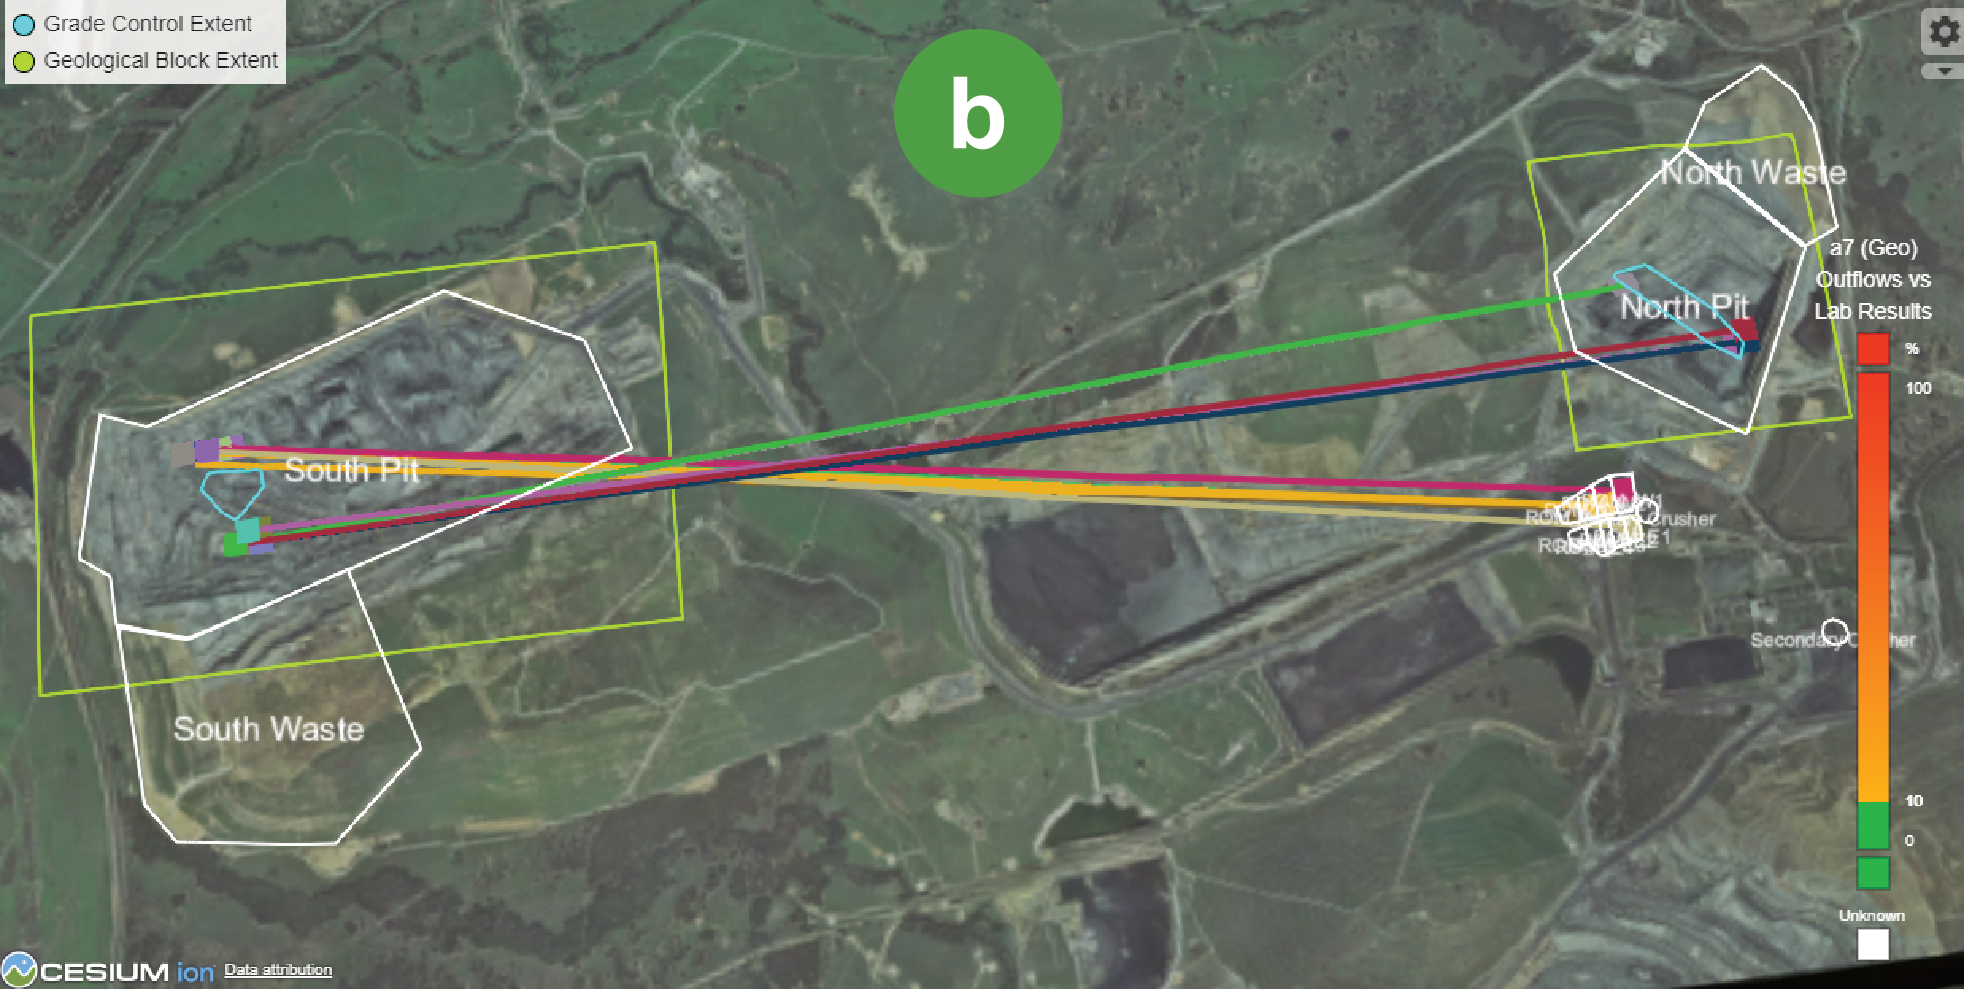
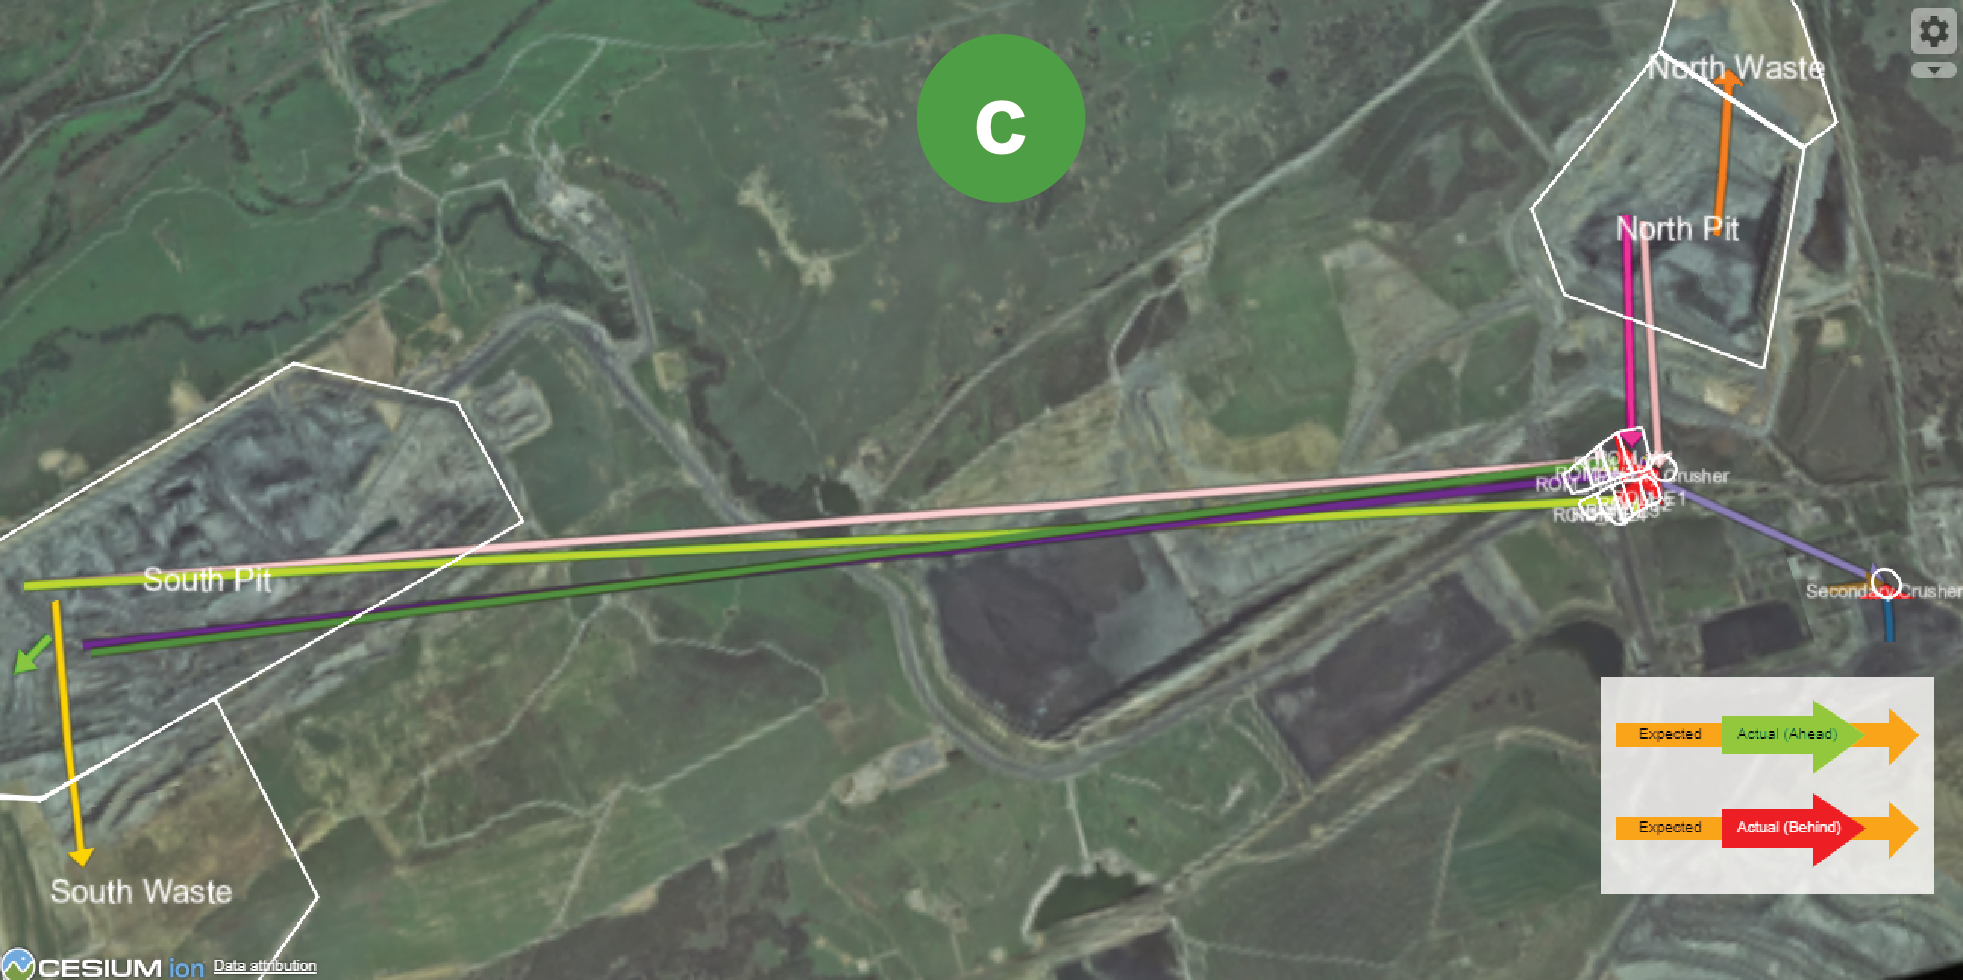
Examples of different viewers are: Viewer , Outflows - Viewer by Time , and Mine Plan Viewer  .
.
In-viewer configuration controls
The controls to customise what you view are inside the viewer panel, near the top right-hand side, as follows:
|
|
Click the cog to open the Options panel. The available options are grouped into categories—expand a category drop-down to view its settings. These settings are explained below. |
| Imagery |
Imagery (such as Cesium ion) refers to geospatial and photographic data layers—typically 2D satellite, aerial, or topographical map images—that provide spatial context and background in the site visualisation. Open the imagery drop-down to select an image map. To enable it, select its checkbox. If no image is selected, it defaults to Bing Maps. To add an image map (if available), click |
| Zone |
A zone is a defined spatial area within a site—typically represented as a polygon—used to specify operational locations or domains for tracking material movements and inventory. Zones can encompass pits, crushers, conveyors, stockpiles, dumps, or any other meaningful segment of a mine or plant. Click the Zone toggle to show or hide all zones. In the Show Zones drop-down to select which zones to display in the viewer when Show Zones is enabled. |
| Stockpile |
A stockpile in MaterialMRT is a managed, spatially-defined accumulation of mined material—such as coal, ore, or waste—used to temporarily store, blend, and track inventory as it moves through a mining operation or processing plant. Open the stockpile drop-down to configure the following:
|
| Grade Control Model |
Grade control models represent the expected spatial distribution of material grades and provide the reference for reconciling actual movements and assay results against planned grades in MaterialMRT. Open grade control model drop-down to change the following general options:
|
| General |
Under General are additional viewing options. Open its drop-down to adjust the following:
Click |
|
|
This button drops down |

|
Recentre Camera Orientation returns the camera’s tilt, bearing, and zoom to the default position at the centre point of the current view, as illustrated.
|

|
Go to position opens the Navigate to: panel.
|
 , then in the Add Imagery panel, in Imagery Name, enter a name, and in Imagery ID, enter its code. Click
  to update the imagery and close the panel.
 to confirm your preferences or click in the view outside of the options panel.
 to close the hide the buttons.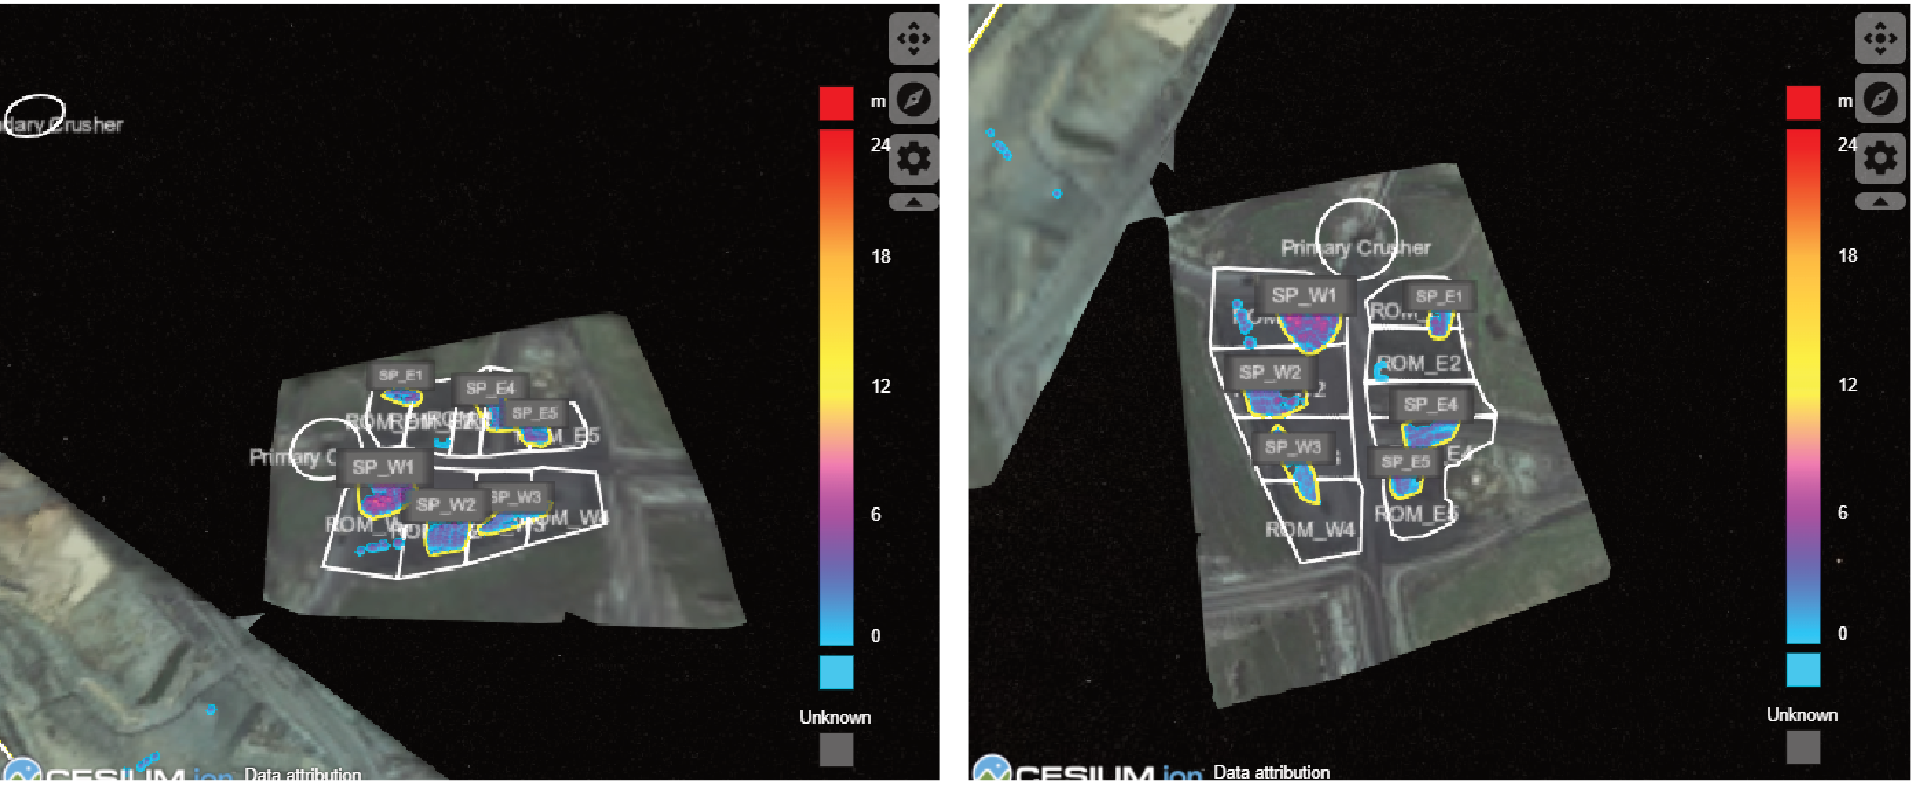
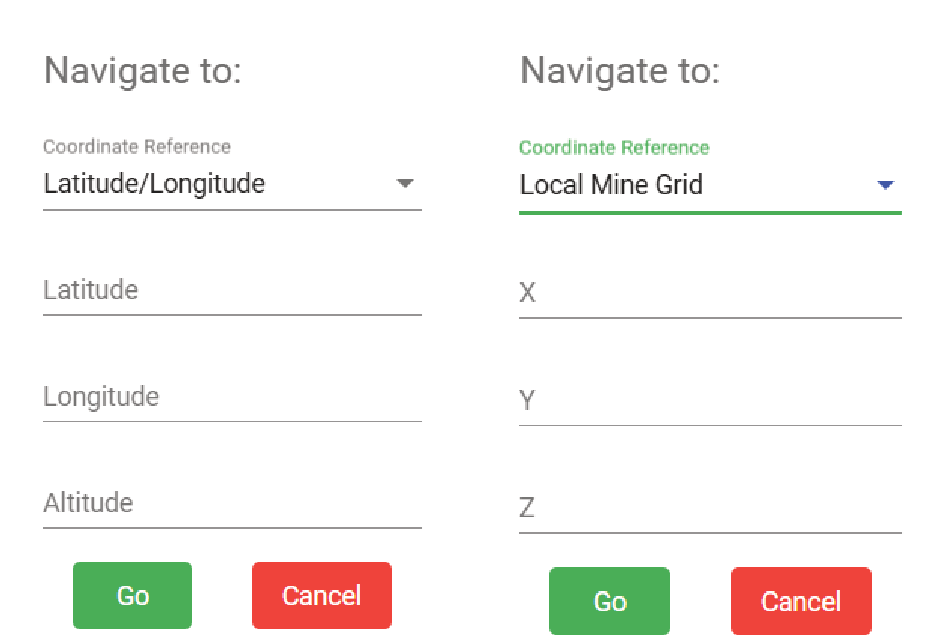
 to centre the view to the selected coordinates.
 View manipulation (panning, rotating, and zooming)
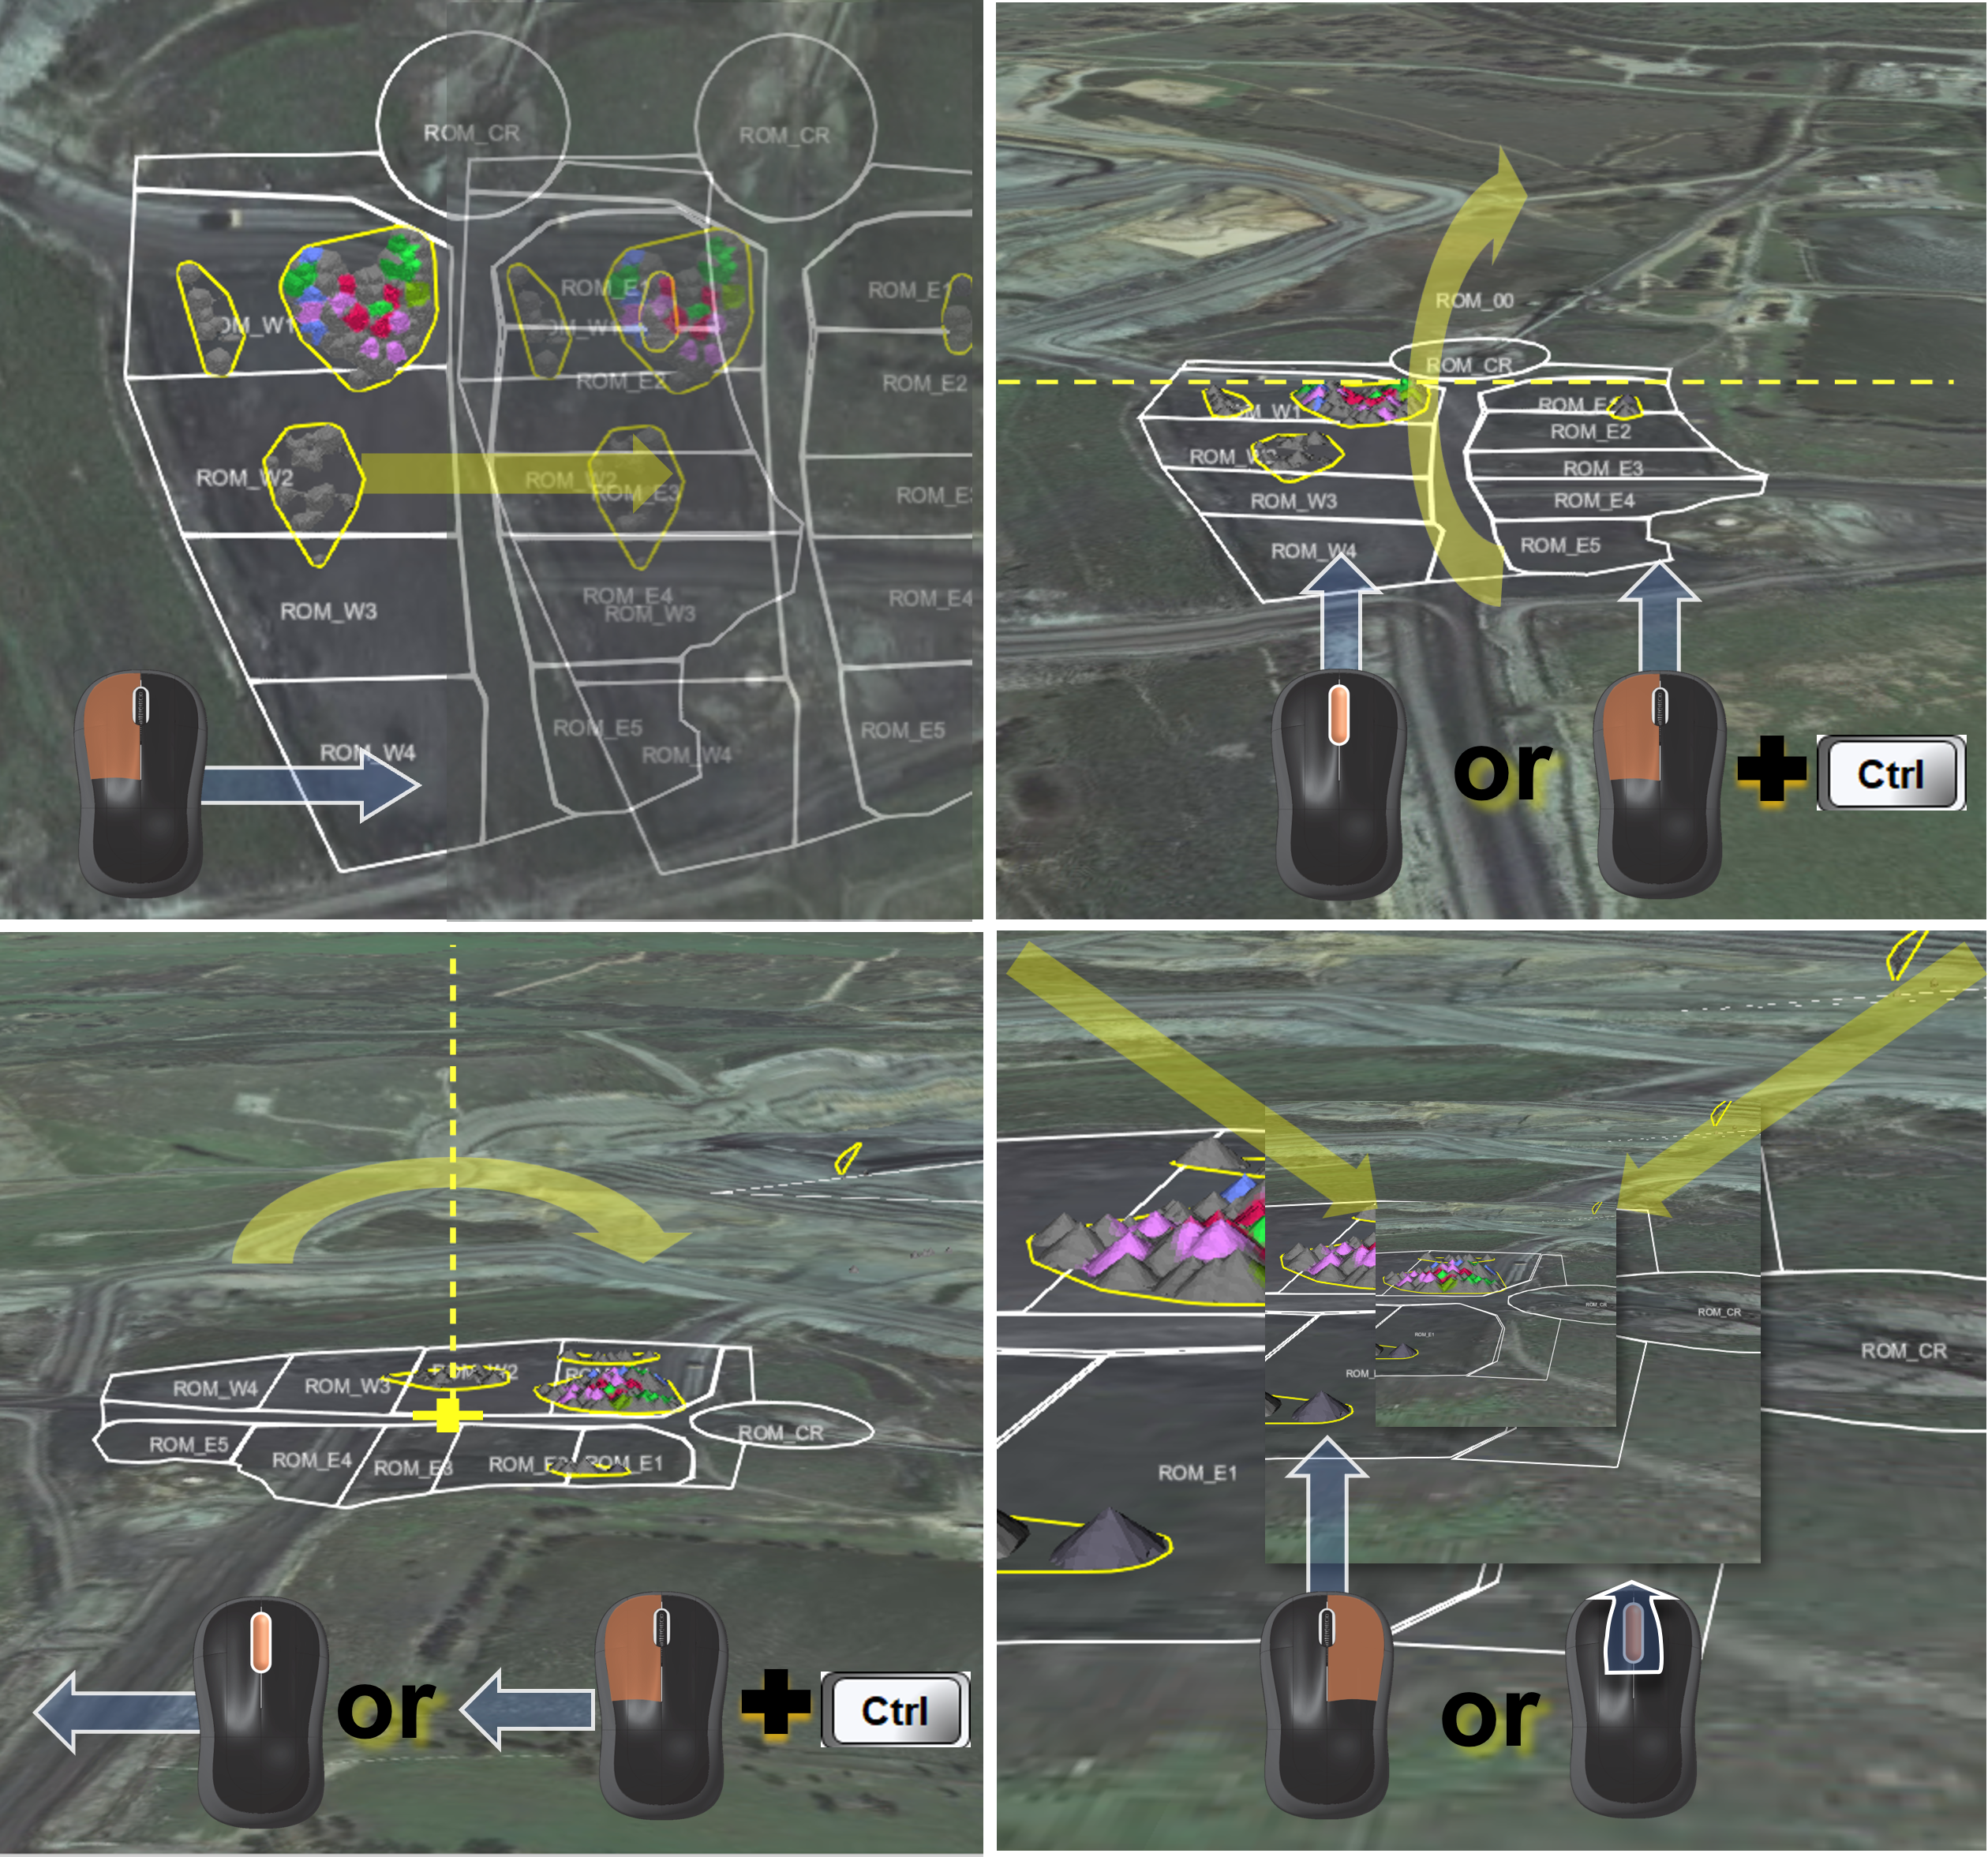
Control panning, tilting, and viewing in any viewer using the mouse and keyboard combinations shown below. Alternative combinations for tilt, rotation, and zoom are also illustrated.
Use the mouse to control the direction of the action you perform, as illustrated below, for example:
-
Move the mouse while pressing the left mouse button to pan.
-
Move the mouse while pressing the middle mouse button to rotate or pitch around the z-axis.
-
Move the mouse button while pressing the right mouse button to zoom, or scroll the middle mouse button for less precise stepped zooming.
Making polygons to create an area or zone
Create polygons to select an area of interest, if available. The usage case depends on the viewer. To begin, click the  button, then continue with these steps:
-
Place your mouse pointer over the required location and click to add the first point of your polygon.
-
Move the mouse pointer and click to add more points until the desired area is created.
-
Press Space to finish.
Tip: Press Esc or click
to remove polygons from the viewer. Example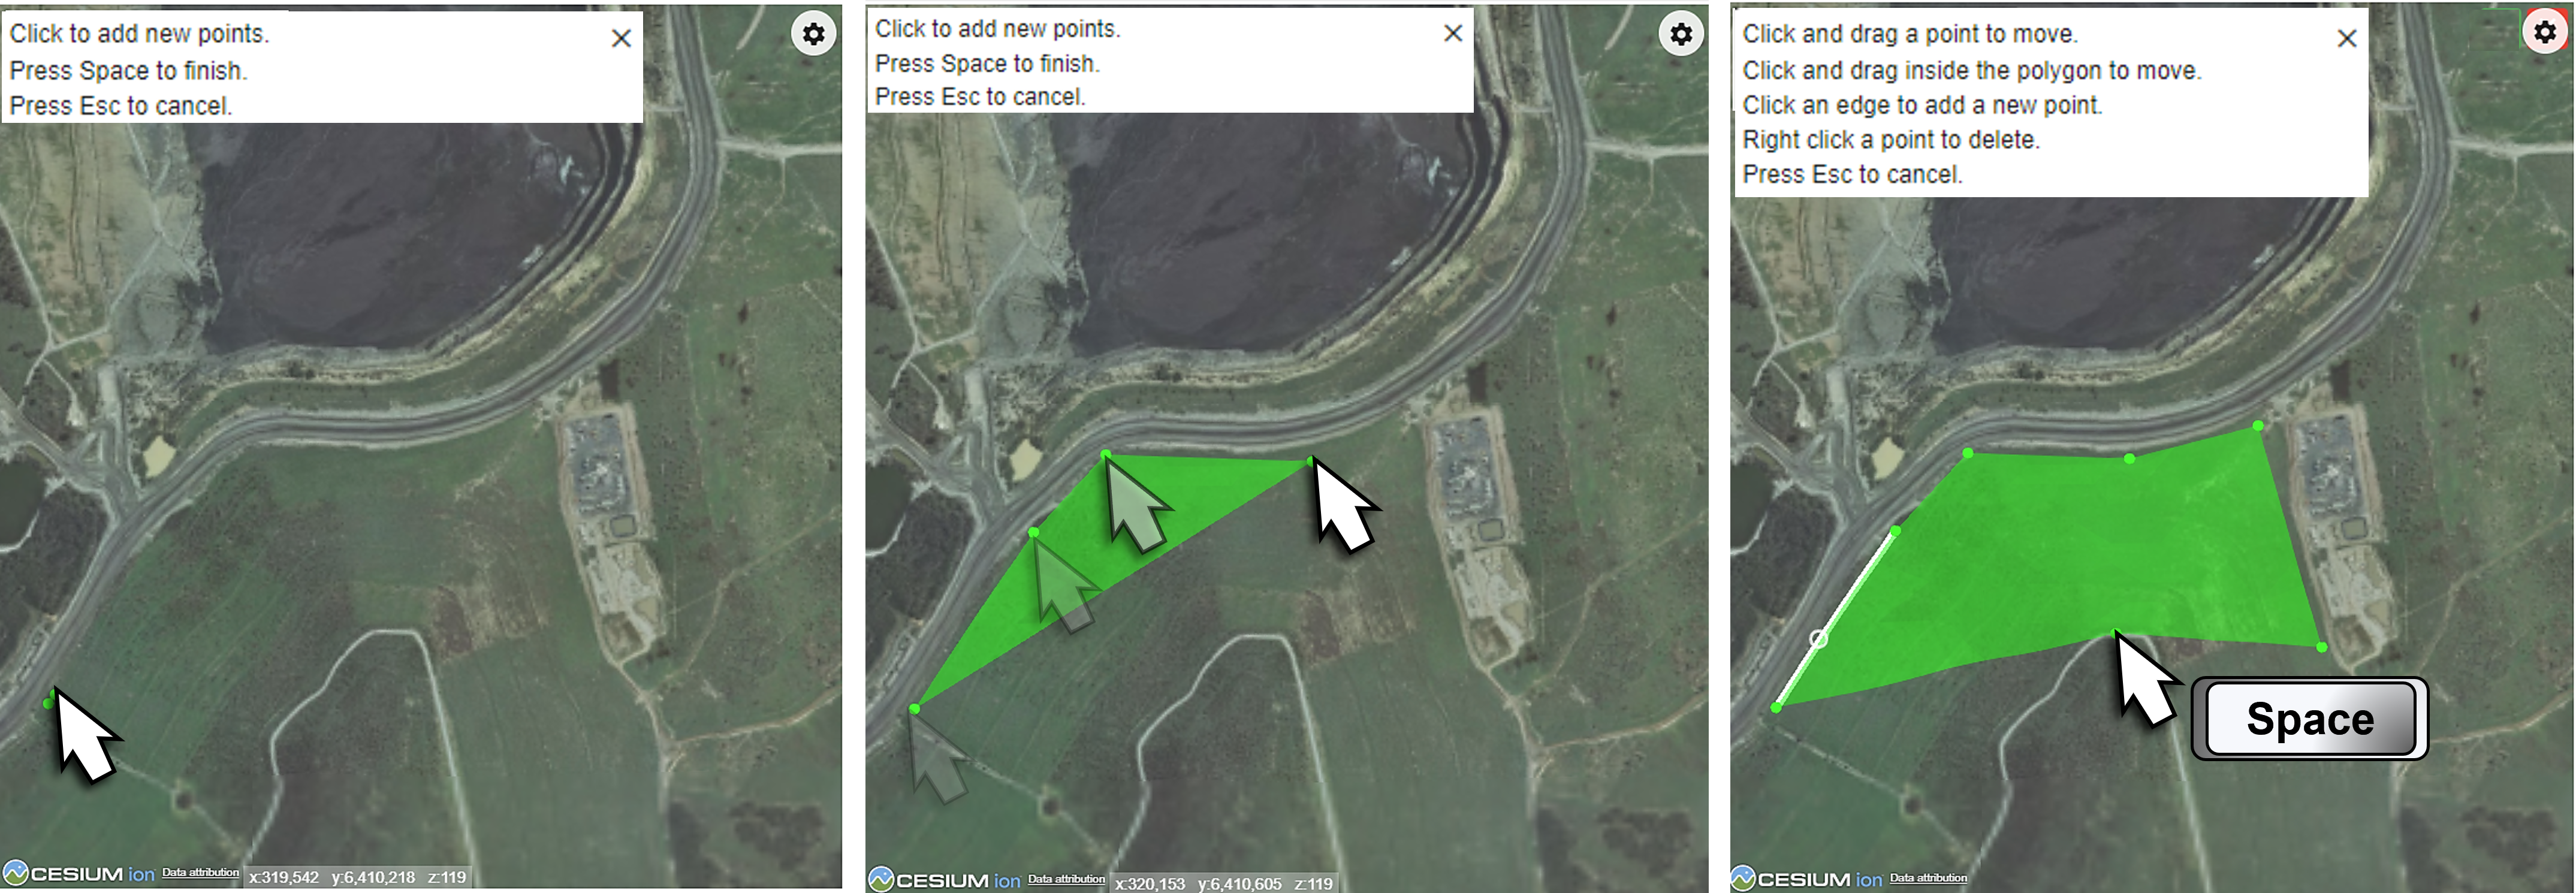
Note: When more than one polygon is created, each polygon is allocated a different colour.
Modifying polygons
Polygons can be modified as needed, by adjusting any of the following:
-
Drag any point in the polygon to change its size and shape.
-
Click anywhere along an edge of the polygon to create a new point.
-
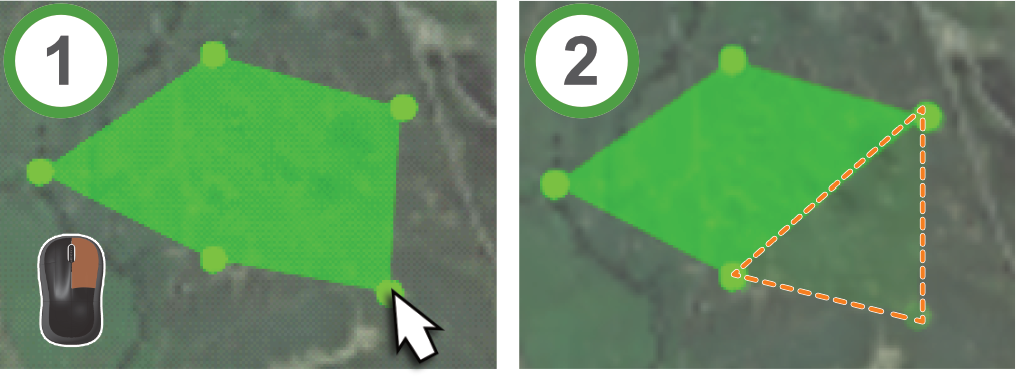
Right-click on a point to delete it.
-
Click inside the area and drag the polygon to another location in the view.
-
Press Esc to remove the current polygon.
Example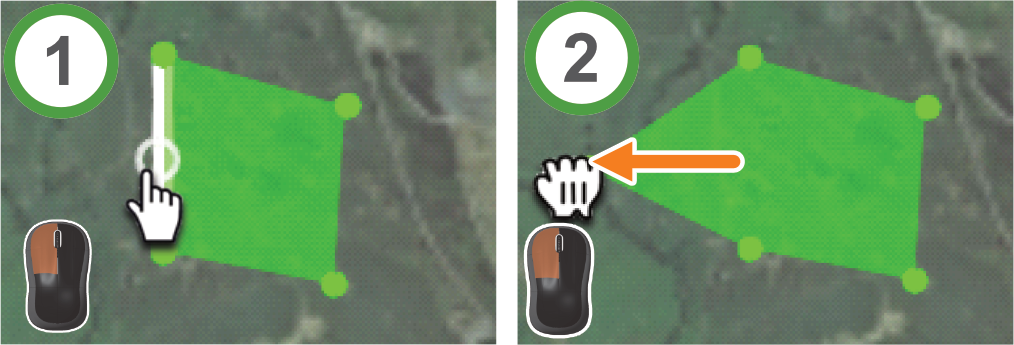
Above: adding facets to a polygon by clicking on a point along its edge and dragging it into position.
Below: deleting a point using the right mouse button.
Using the Date Time Picker
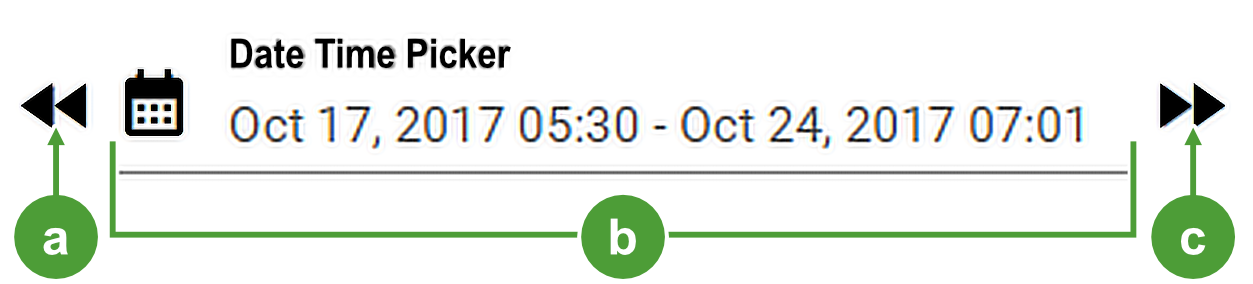
The Date Time Picker appears on anywhere where time-based or scheduled events are part of the dataset. Clicking anywhere in inside the displayed time interval opens a calendar interface where you select daily, weekly, or monthly intervals, including shifts or custom date and time ranges. The selected period filters the displayed data to match specific operational or historical timeframes, enabling users to focus on relevant activity within those limits.
|
|
|
|
Jump to previous time interval. |
|
Jump to the next time interval |
|
|
Clickable Duration combo field. Click to open the calendar tool. |
Note: Clicking  or
or  retards or advances the time by the interval you set. For example, if the interval is a shift, then clicking either button jumps to the previous or the next shift respectively.
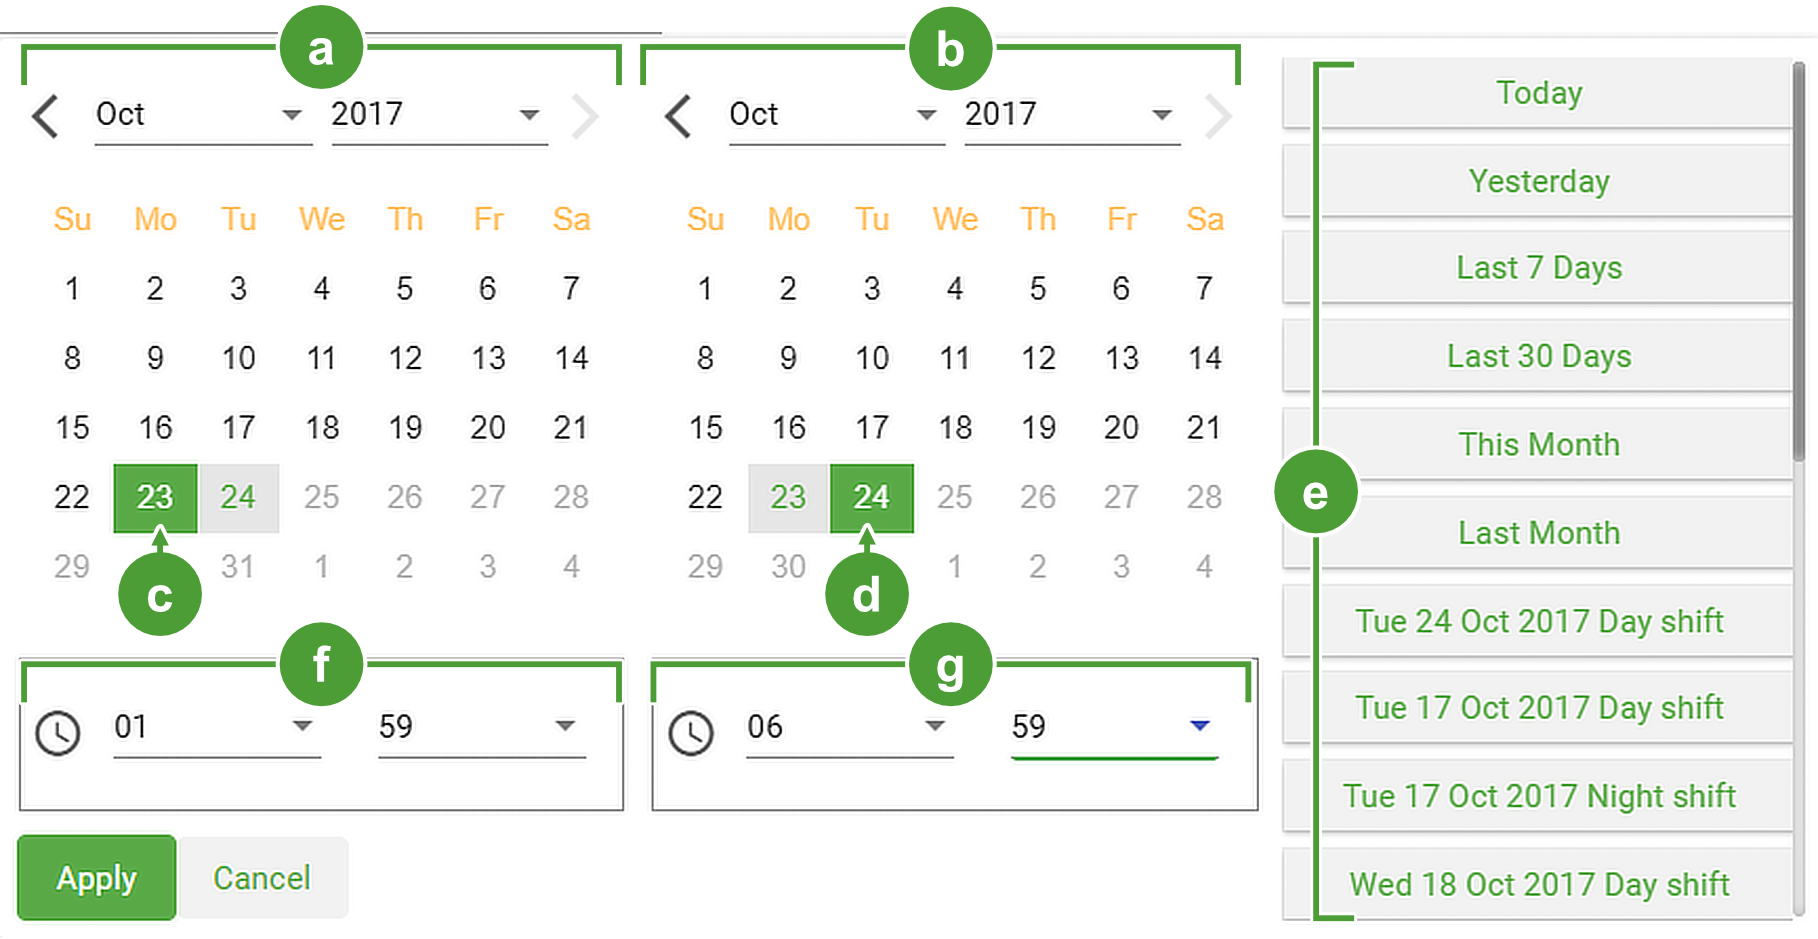
To use the calendar, click anywhere inside the duration field. This opens the following panel, as illustrated below.
|
|
|
|
Start of interval calendar |

|
Interval presets |
|
|
End of interval calendar |

|
Interval start time |
|
|
Starting date selection |

|
Interval end time |

|
Ending date selection |
Using search and sorting items in tables
In many cases, information is presented in tabular fashion, and in most cases controlled by applying various restrictions to filter your data. The following are commonly available tools found throughout MaterialMRT:
|
Search... |
The search field allows users to use keywords to find entries in a table, there are two search methods available: Simple search: Type a single phrase to locate anything with a matching character string. Advanced search: Search selected columns using search operators such as OR and AND with each column tab and keyword separated by commas, such as in the following example: <column> , <keyword> , <OR> , <column> , <keyword> , <AND> , <keyword> , <column> , <keyword> Digger, EX103 , or , Digger , EX105 , and , Working Section , LID7 , |
|
Sorting Drop-down lists |
When the
|
 icon is displayed in a drop-down list, it allows you to drag and drop an item to change its order in the list and the order of appearance in the table.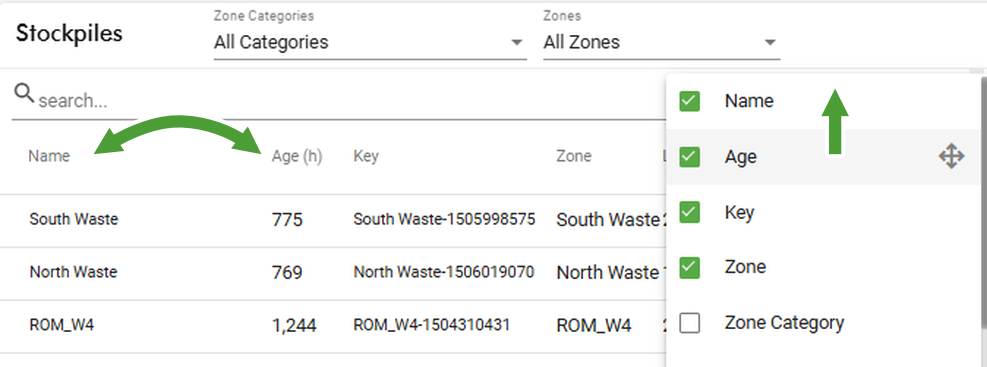
Creating or modifying colour maps
Colour maps are used to distinguish variations in the value ranges of a property, such as grade, quantity, or other metrics. They provide colour-coded legends for displaying data in gauges, charts, 2D, and 3D models.
|
|
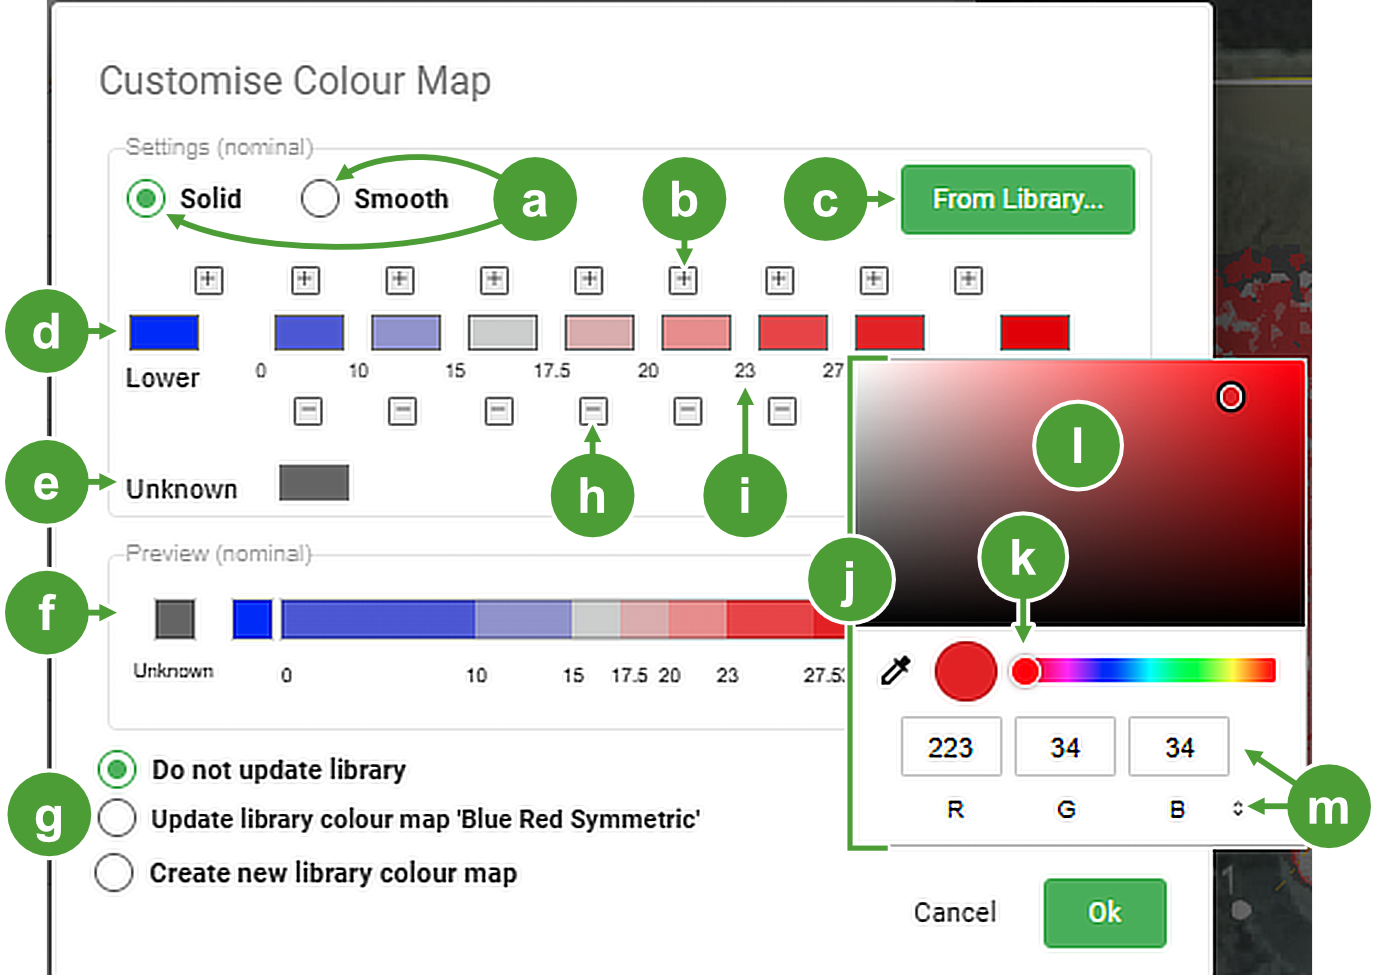
|
|
Colour rendering type radio buttons |

|
Remove the above interval |
|
|
Insert a new interval after the one below |

|
Interval value (click to edit) |
|
|
Open the colour map library panel |

|
Colour editor sub-panel |
|
|
Lower extent colour (before the first interval) |

|
Spectrum bar (hue) |
|
|
Colour for unknown or missing values |

|
Colour field (brightness and saturation) |
|
|
Colour map preview |

|
Colour selector and colour system toggle |
|
|
Colour map save options |
Colour maps are derived from an external database or created from scratch when new materials or other metrics are introduced. To create (where allowed) or customise a colour map, follow these steps:
-
Click
 to open the Customise Colour Map panel.
 -
In Setting (nominal), click
 to select a different pre-made colour scheme, otherwise, click Cancel if you prefer to customise the current one.
 -
Select the colour rendering by clicking the Solid or Smooth radio button. Solid provides a distinct shade for the allotted value range and smooth creates a blended colour gradient with its neighbouring value ranges.
-
Insert or remove intervals to the colour map by clicking + or - respectively. As intervals are added or removed, a corresponding colour is assigned.
-
Change the colour of any interval as required by clicking on its thumbnail to open the colour picker.
-
Click within the colour field to adjust the current colour’s saturation and brightness.
-
Drag the circle in the spectrum bar to change the hue, or enter RGB, HSL, or HEX values in the fields below the spectrum bar. To select the colour system click
 to toggle through the three options.
 -
Update value ranges of intervals as required by clicking on its number, then enter a new value.
-
-
Assign Lower and Upper range colours to suit (to signify values outside the lower and upper range constraints).
-
Assign a colour for unknown values. The default is grey.
-
Decide how to save the colour map.
-
Select Do not update library to save your changes locally. scheme in the system.
-
Select Update library colour map [selected map] to overwrite the library’s colour map.
-
Select Create new library colour map to add it to the library. With this option, enter a name, measure, and unit type.
-
-
To complete the colour map and close the panel, click
 .
.
