

 Viewer
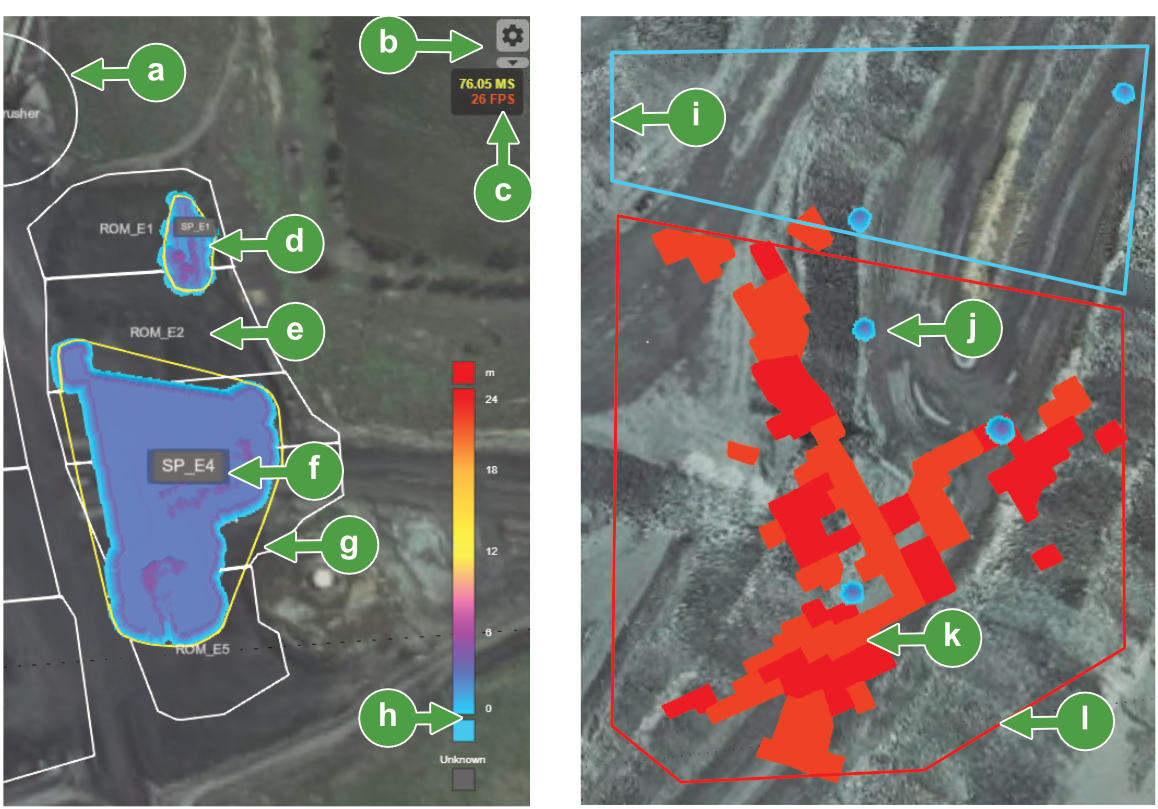
The viewer displays the mine site, including detailed terrain, stockpiles, zones, and resources. It provides users an interactive overview on real-time spacial and material data. Pan, rotate, and zoom controls allow viewing from different perspectives and to guide analysis. The viewer map is highly interactive, clicking or selecting map areas opens a panel which reveals key statistical and properties data. Static and context-sensitive and tools enable detailed analysis to help identify material movements, resource grades, and quantities and update or change information.
|
|

|
Zone boundary |

|
Dynamic stockpile boundary (yellow indicates not selected) |

|
Settings |

|
Legend (scheme selected by the user) |

|
Frame rate counter |

|
Static boundary (cyan indicates mouse-over state) |

|
Stockpile |

|
Stockpile in a static boundary (such as a pit or waste dump) |

|
Zone label |

|
Geological blocks (enabled in the view) |

|
Stockpile label |

|
Static boundary (red indicates selected by mouse click) |
Using the viewer
Manipulate the view using the mouse to pan, rotate, set the centre of rotation , and zoom to the subject of interest. MaterialMRT uses similar dedicated viewers in other pages, all of which share these common functions. To learn more, see Getting Started > Visualising topology in MaterialMRT.
-
To move the view in any direction, left-click and move the mouse.
-
To rotate the view for all axis, middle-click and move the mouse.
-
To zoom, right-click and move the mouse up or down.
-
To set the centre of rotation for all axis, left click over the desired point.
Using the View details panel
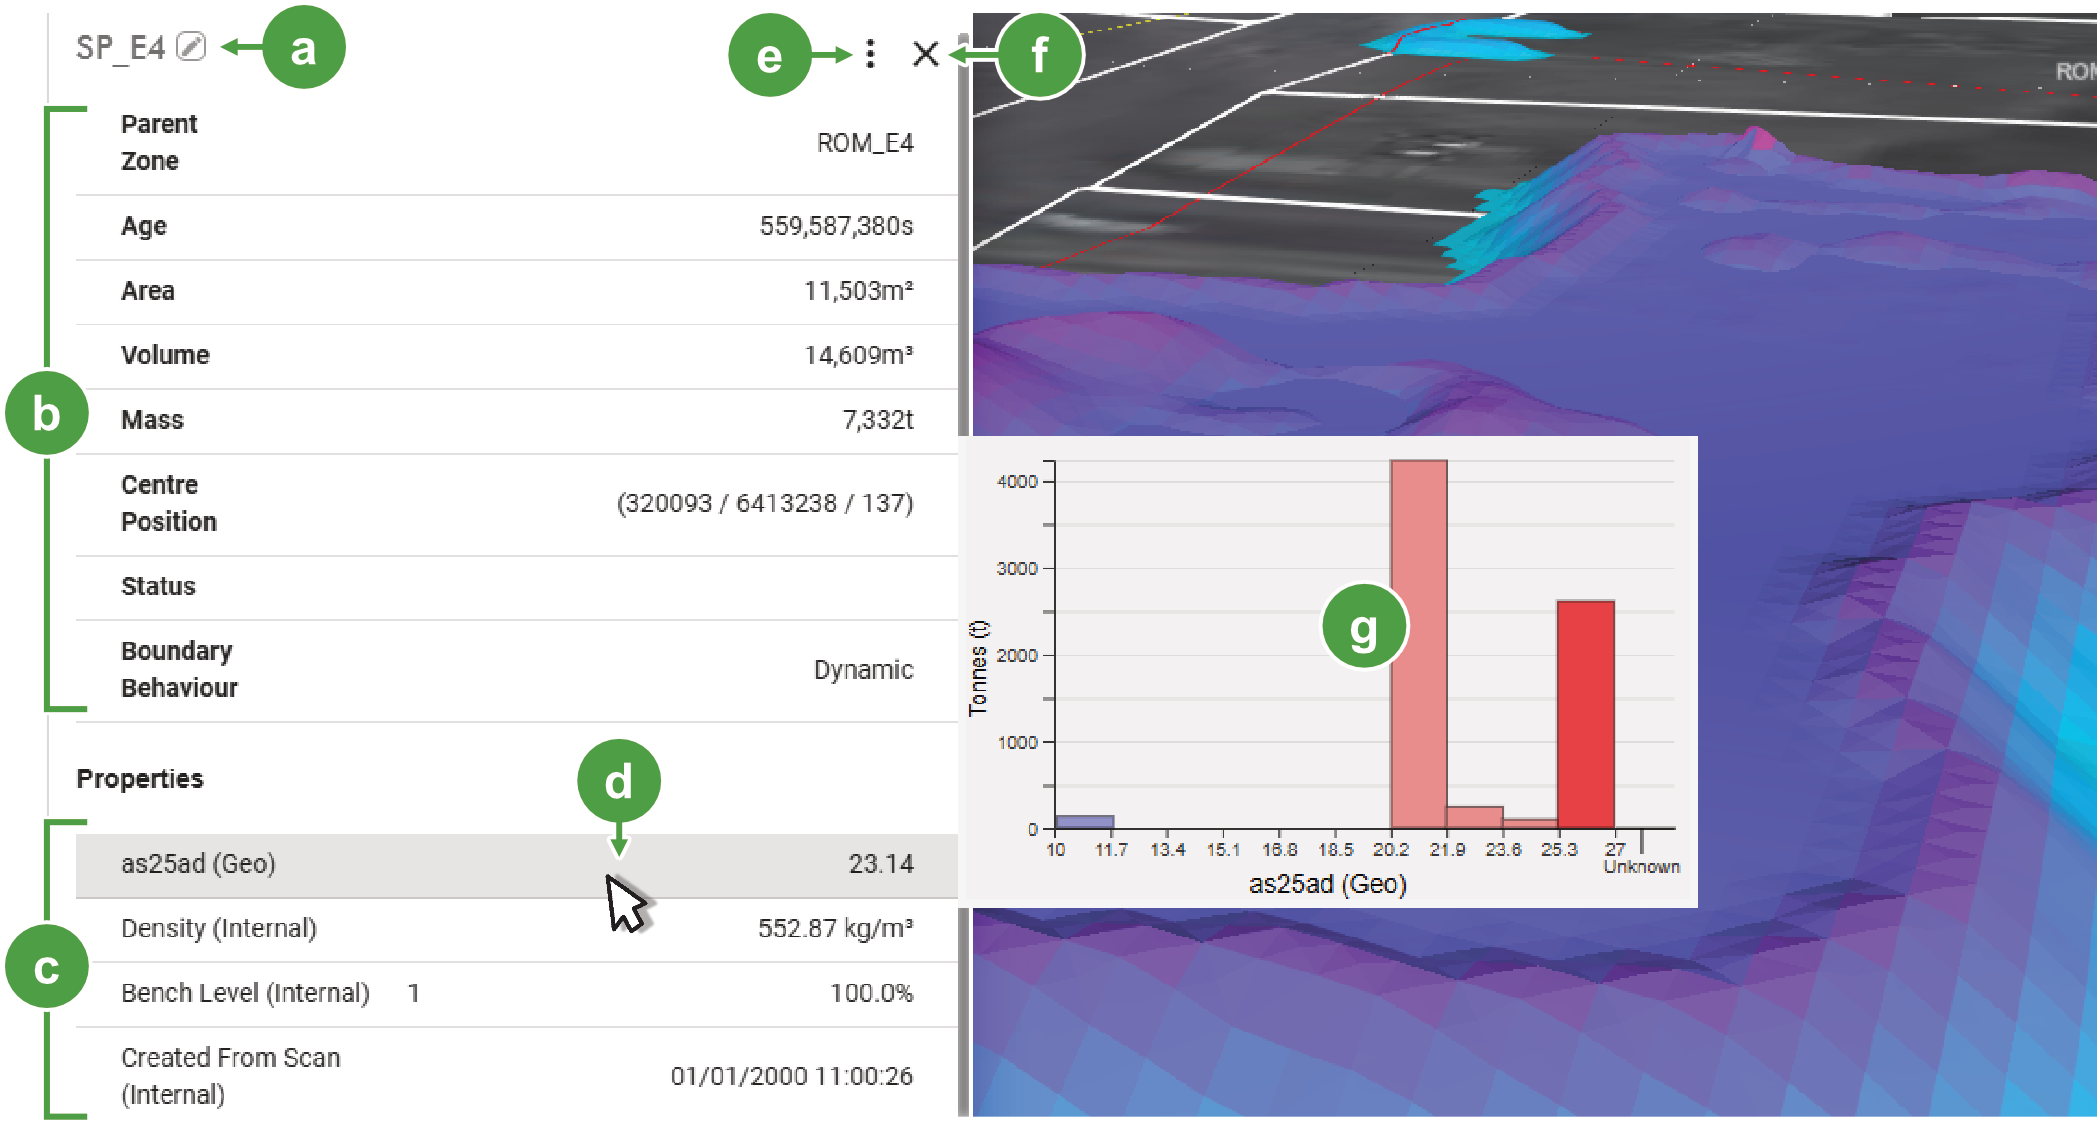
The View detail panel opens when you click anywhere inside a zone or stockpile in the viewer, or by right-clicking and selecting  from the context-sensitive menu. General information such as the name, parent zone (if applicable), age, and the dimensions, mass, volume, and position are are listed, followed by a list of properties. To see stockpile properties located outside of a parent zone, click
  . The list often extends beyond the limits of the browser, if necessary, scroll to see off-screen items. To close the details panel, click
  at the top right, or in the viewer, click in a vacant area outside of zones.
|
|
|
|
Editable stockpile name heading |
|
View details tools menu |
|
|
General information for the selected stockpile |
|
Close the View details panel |
|
|
List of properties within the selected stockpile |
|
Tool tip chart of the selected property |
|
|
Property selected by mouse-over |
The view details panel is arranged as follows:
-
General information headings are defined in the following drop-down list.
 Click to see definitions for general information items
Stockpile Name
The name of the stockpile (see the first tip that follows)
Parent Zone
The zone in which the stockpile is located
Area
The calculated area of the stockpile
Volume The calculated volume of the stockpile Mass The calculated mass of the stockpile Centre position The coordinates of the centre area of the stockpile
Status An optional field to flag arbitrary conditions, such as surveyed, empty, or building
Boundary behaviour
-
Properties within the selected zone, stockpile or other area
-
Use the mouse wheel or scroll bar to scroll through the list of items, if required.
-
Hover over a property with the mouse pointer to display a tooltip chart of the selected property.
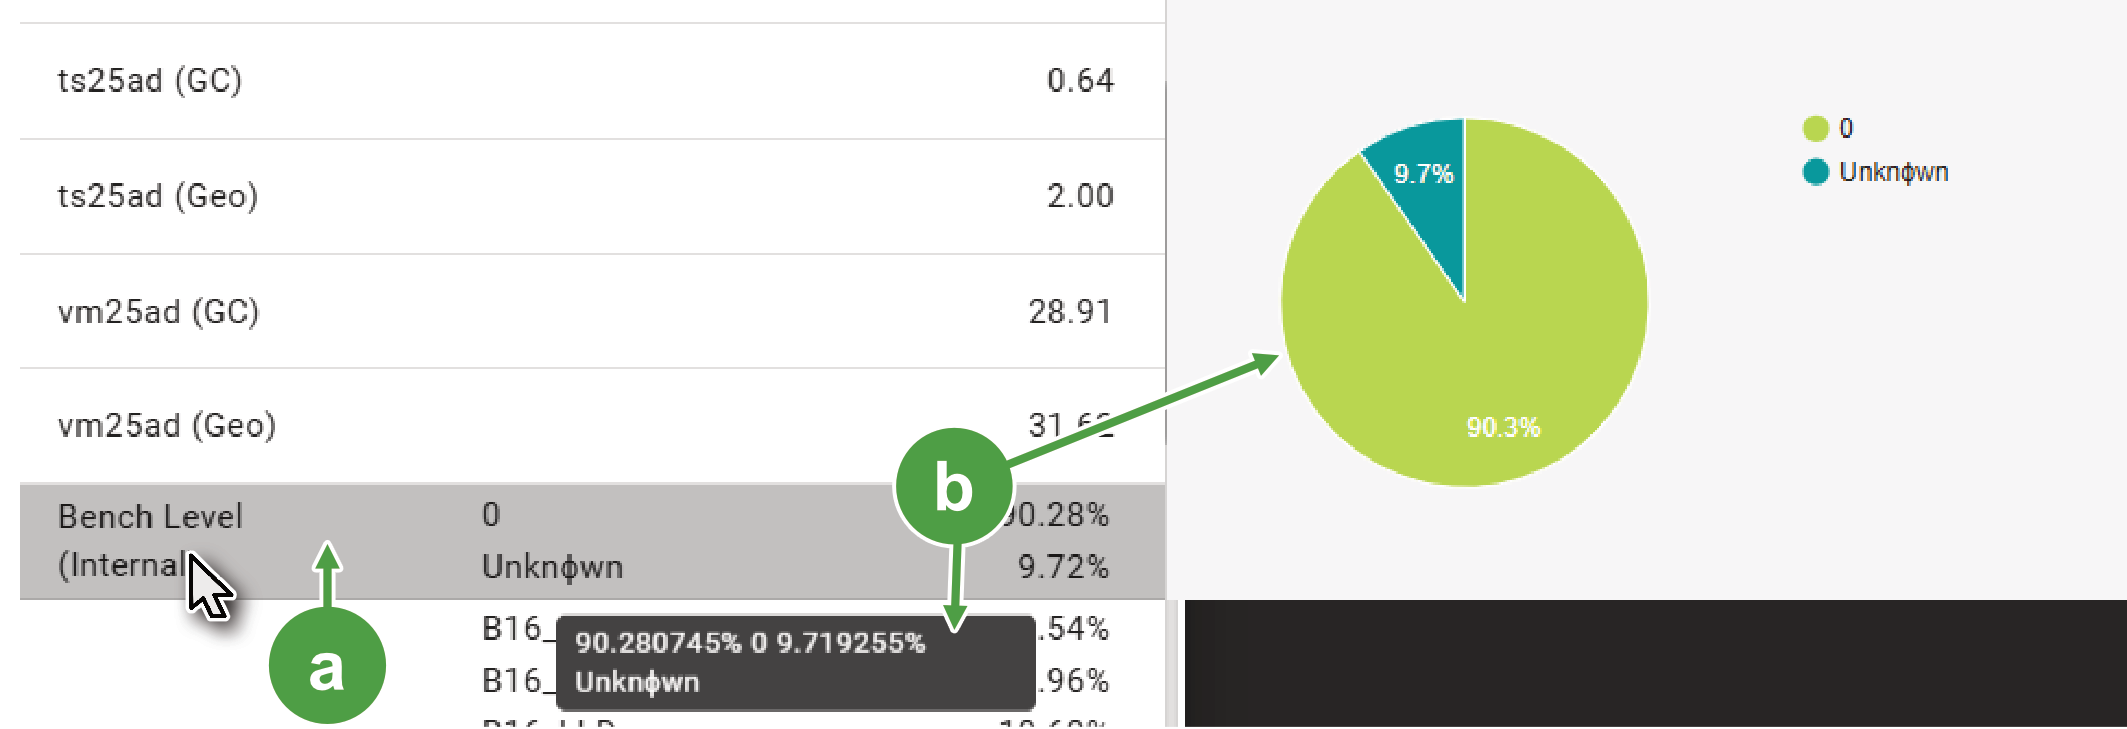
Example of hovering over a text property
Property selected by hovering the mouse pointer over it
Tool tip displaying the chart for the selected property -
Click
 to open the context menu containing stockpile editing and export tools.
 -
To edit a stockpile name, click on the name heading or
 , enter the new name, then click
  to save it.
-
View details context-sensitive tools
View details has tools that enable you to modify, remove, or export stockpiles, as follows:
|
|
Click on a stockpile in the viewer to open the View details panel. Then click to show the tools listed below. |
|
|
Right-click on a stockpile in the viewer to open the New stockpile name panel. Enter the new name, then click |
|
|
Merging combines adjacent stockpiles into a single boundary. Click to see instructions for merging stockpiles
To use the Merge Stockpiles tool, follow these steps:
|
|
|
Adjust volume can be applied immediately, or at a previous point in time and allows for corrections to be made as needed to the stockpile. Click to see instructions for adjusting stockpile volume
To use the Adjust Volume tool, follow these steps:
|
|
|
Transform to benchconverts the default mound structure into a stockpile with one or more benches. It uses an intelligent algorithm to calculate the shape and footprint, either with configurable parameters or by importing a model. Click to see instructions for using the transform to bench tool
To use the Transform to Bench tool, follow these steps:
|
|
|
Clear stockpile removes the selected stockpile and its material properties. This tool can be used to update MaterialMRT when material has been removed (or re-purposed for non run-of-mine purposes), and hasn't been modelled. Click to see the instructions for clearing a stockpile
To use the Clear Stockpile, tool, follow these steps:
This also works with the |
|
|
Export Surface converts the selected stockpile into a AutoCAD DXF or Vulcan triangulation file 00t. You can also export a selection within a polygon using the Click to see instructions for exporting a stockpile to a surface file
To use Export Surface, follow these steps:
|
|
|
Export to ASCII creates a CSV file contained in a ZIP folder. The data forms sub-blocked block models for importing into Maptek Vulcan or similar block viewers. You can also export a selected area using the Click to see instructions for exporting a stockpile as ASCII
To use the Export as ASCII tool, follow these steps:
|
|
|
This tool only appears when |
|
|
This tool only appears when |

 . This duplicates clicking
 .
. to confirm the action, then
  to dismiss the Success confirmation . The new boundary is formed around the merged stockpile.
 to open its panel.
 , to open the Transform Stockpile Options panel.
 then click from base to where the ramp ends at the stockpile. A red line representing the ramp between the start and end points will be displayed, as illustrated.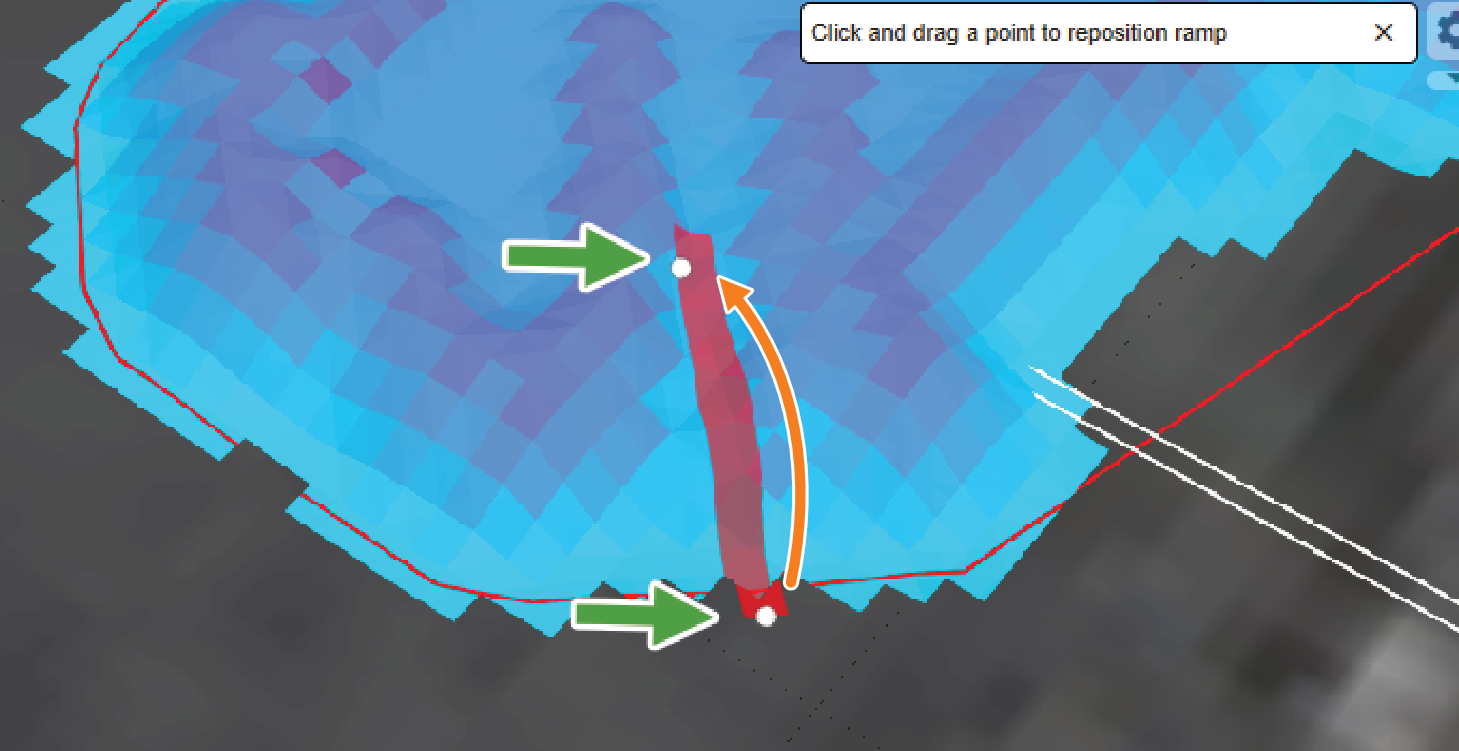
 .
. and create your footprint. The polygon can later be modified or removed by clicking
  or
or  respectively.
 to see transform effects. If necessary, continue to modify the transform parameters and preview.
 . The Clear stockpile panel opens.
 to open the Export to Surface File panel.
 from the menu. The file will be immediately created and saved to the browser's download folder.
Viewer tools
Viewer tools provide additional options for visualising and analysing stockpile structures and material content, including interactively moving material to other locations. These are described below:
|
|
This tool allows you to visualise the stockpile through its cross section from the Explore Cross Section tool. To learn more, see Using the cross section tool. |
|
|
Use this tool to male a polygon over a specific area and enable the Reclaim, Edit Properties, and Clear Material in the view information panel. It also adds |
|
|
Manually transfer material from one location to another, as if using a truck. To learn more, see Moving material in a stockpile to another location. |
|
|
Choose the preferred stockpile colour scheme. Select from Coloured by Height, Vertical Column, and Stockpile. When Vertical Column or Stockpile is selected, open the Metric drop-down to choose one. The preferred colour scheme legend is shown at the bottom-right of the viewer, and all stockpiles are coloured accordingly. |
|
|
Zoom To opens a list containing all zones inside the terrain map. You can do any of the following:
|


 to centre the default location in the viewer.
Using the cross section tool
Cross Section allows you to place a line across a stockpile enabling you to analyse the profile and content of the current model and compare it to available scan files. In this section, we describe how to create the cross section, open the Explore Cross Section tool, and configure its settings to your preferences.
To create a cross section, follow these steps.
-
Click
 , then in the viewer, move the mouse cursor to the cross section start point (P1) and click to set its position. Repeat this to set P2, as illustrated.
.

The yellow line P1 - C - P2 is displayed. The cross section can be adjusted as necessary, as follows:
-
Move P1 or P2 in any direction by dragging its node.
-
Move the entire line by dragging the centre node C.
After you have created a cross section, a simple profile graph plotting Height versus Distance from P1 will appear, along with the Explore Cross Section tool.
-
Exploring a cross-section
After creating a cross section, click  to open Cross Section in a new browser tab. Here, additional tools to enable more information to be added as follows:
| Graphing type |
Set the resolution displayed on the graph with respect to the default, as follows:
Below is comparison between a graph with (1 x 1 ) Raw cuboids (top) and the same graph when Resolution is 2 is used (bottom). 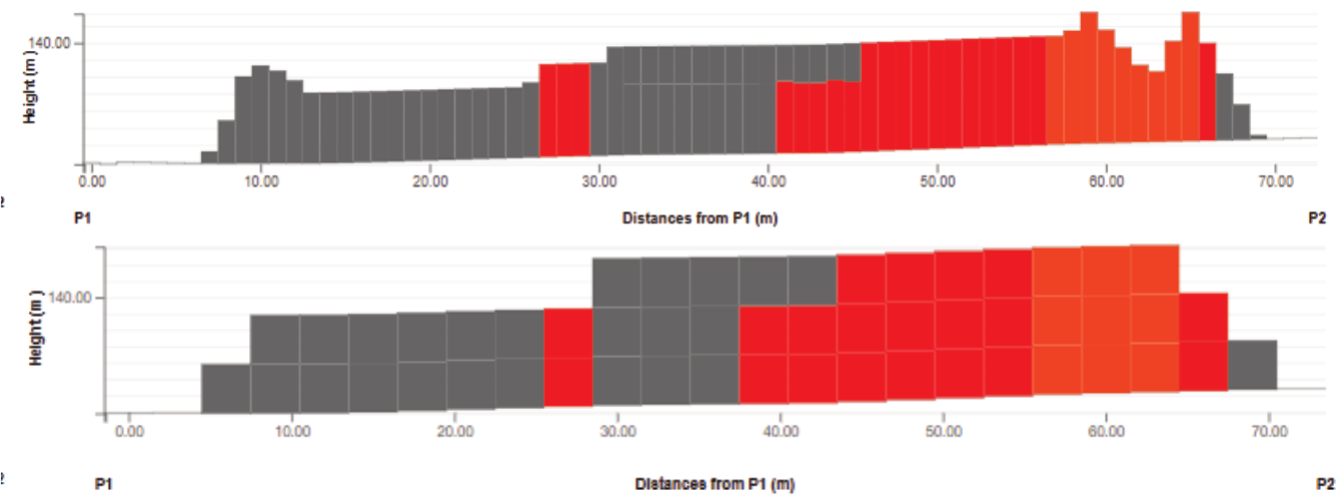
|
||||
| Stockpile base |
Determines whether the stockpile conforms to the terrain or is referenced to fixed axis, as follows:
The image below compares the stockpile base when following terrain (left) and horizontal (right). Also note the effect on the vertical scales; following terrain references the actual terrain height as its base, while the horizontal stockpile base is level. 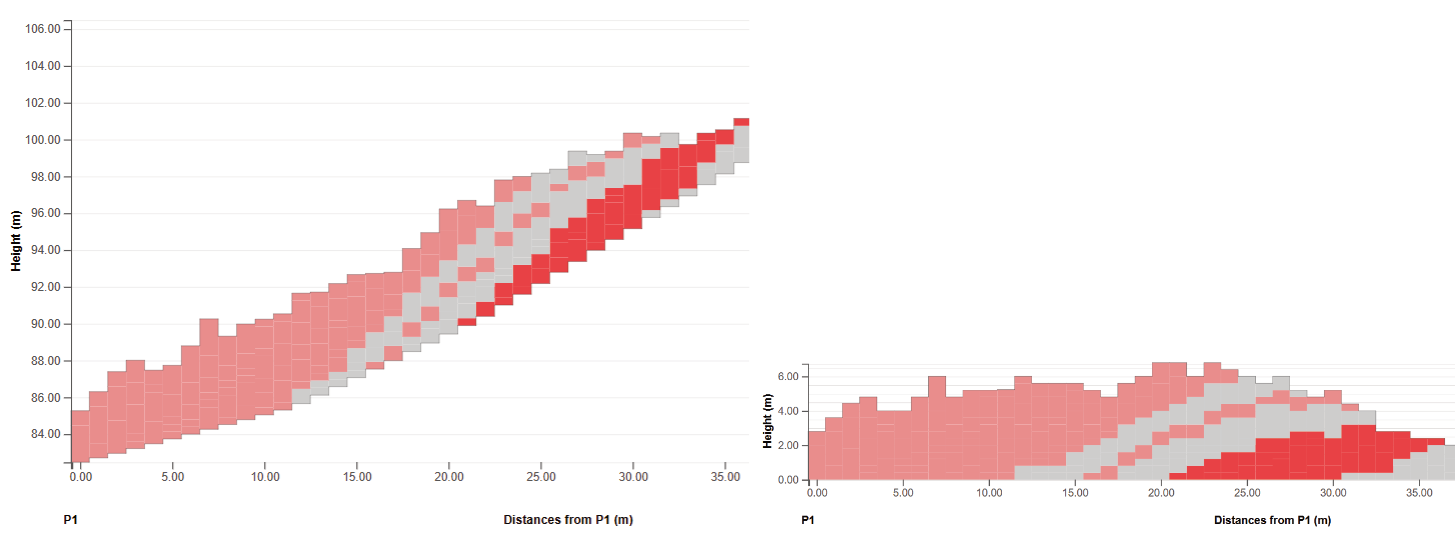
|
||||
| Tooltip properties |
Tooltips will appear as you mouse over a specific cuboid block. To control the detail of information to display, choose either of the following:
|
||||
| Colour by metric |
Use the drop-down to select the metric you prefer to display in the graph and Show selected tooltip. This information provides a colour-coded profile based on the selected property, and displayed as stacked cuboids, similar to histograms. |
||||
| Resolution | This field appears when Graphing type is set to Averaged. Enter a number to set the cuboid's width and height. The higher the number, the coarser the resolution. | ||||
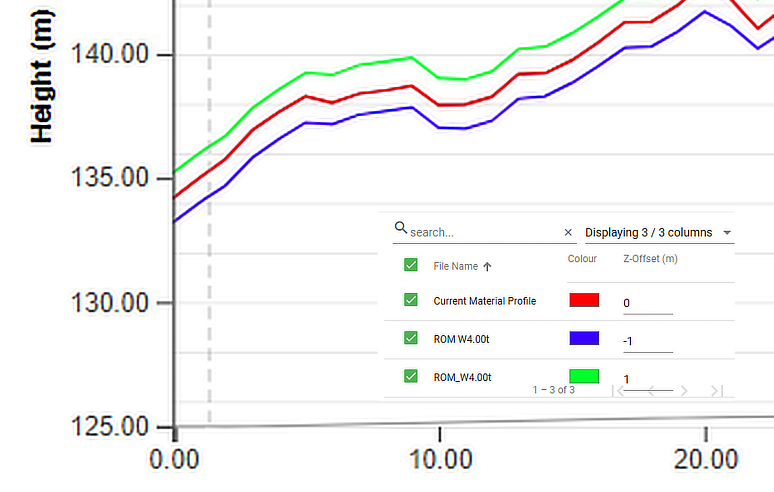
| Offset profile |
Stockpile surfaces selected as Available for Cross Section in the Measurements - Stockpile Surface page are listed are included in the cross section page.
|
||||
Adjusting the cross section in the viewer
The viewer in the cross section page retains the cross section created in the Viewer page. If required, you can adjust section P1 - P2, and C by dragging their respective nodes within this viewer. The graph is updated accordingly.
Comparing surfaces to the current cross section
Scans or design surfaces can be added to the stockpile. When enabled, they are displayed with the existing cross section. This allows you to compare any of the scan files to the current cross section, as shown below:

To compare a design to the cross section profile or metric, set Stockpile base to Follow terrain and do any of the following:
-
Select any available scan files in the Stored scan files list.
-
Temporarily import scan files into the Compare scan files drop zone. They must be reloaded if you close the cross section page.
-
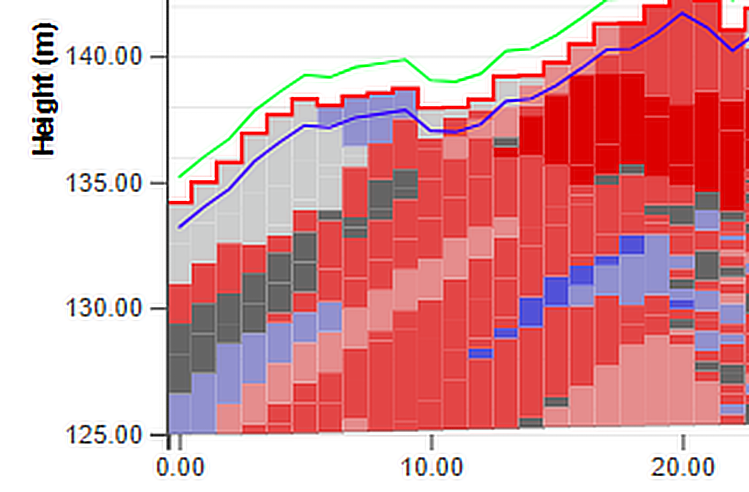
Apply an offset value, if required. Offsets can be applied in cases where a particular property must be accounted for in comparison the cross section. The offset can be used to place the scan file to comply with the intended design height.
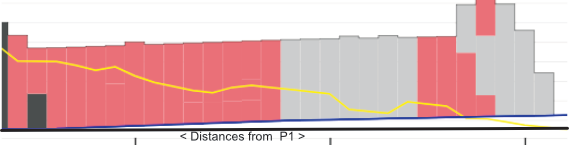
ExampleA dump is known to consist of 6 m (19.7 ft) of waste material that must be factored into the modelling assessment which the user applies to the scan file to allow for this. The effect of this offset is displayed on the graph below.
In this example, the yellow profile is a scan file with no offset applied, and the blue line with the offset (no part of the design encroaches into the block cross section).
Using the Select Area tool
The Select Area tool is used to query material properties in existing zone polygons and solids, and filtered into categories such as stockpiles, and other run-of-mine sources and storage points. It also uses the polygon tool, allowing you to create polygons anywhere within zones with resources. The details panel provides an overview of the selected area’s mass and volume and itemises its properties similarly to clicking on a stockpile and seeing its details. Select area is also a companion for any tool that creates polygons, such as Clear Stockpile, Transform to Bench, and other stockpile modifiers under the menu.
The options for filtering data includes the following:
-
Filter by Categories, Zone Polygons, and Zone Solids. Use the drop-down lists to select areas in the viewer, including any combination of zones, zone solids, or stockpiles. Categories selects material sources, storage points, and report solids. The selected areas are itemised, and their combined properties are shown in the details panel, as in the example below.
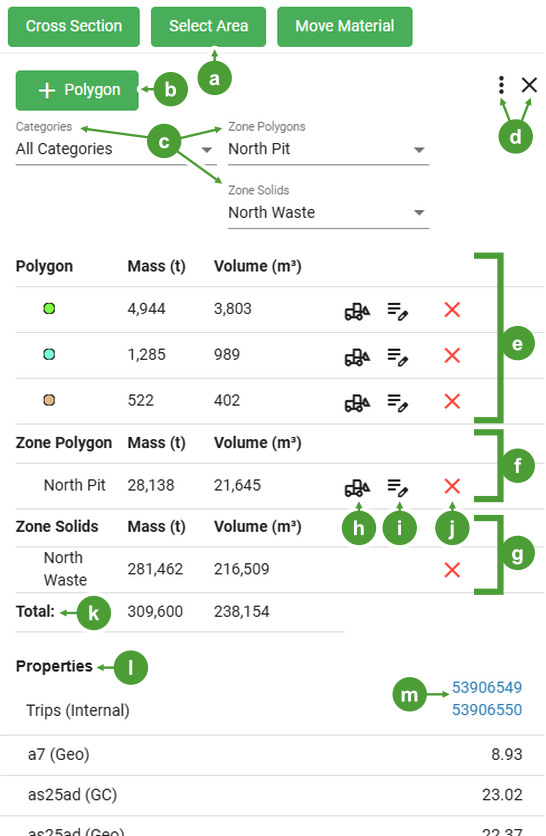
Select Area button (opens a blank details panel).
Reclaim Area button
Add a polygon (initiates digitising mode on the viewer).
Edit Properties button. List of aggregate properties
Stockpile and zone filtering options
Remove Polygon button
Context menu and close panel buttons
Aggregate mass and volume of listed items
List of digitised user-made polygons.
Properties list (aggregate quantities).
List of zone polygons. 
Trips properties linked to open in the Tip Editor.
List of zone solids. -
Click
 to open Reclaim Options dialog.
 -
Click
 to select a point in time or a date range, then click
  .
. -
Enter a value for Mass to Reclaim and the Mass per Load fields respectively.
-
Enter the Digger Name and Truck Name in their respective fields.
-
Expand the Destination drop-down and select one from the list.
-
Click
 to update the reclaimed material removed from the run-of-mine chain.
 -
Click
 to add a new value (added to the bottom of the select numeric, text, or list property list). Then, select the property to assign an applicable value.
 -
Click
 to remove any property from the list.
 -
Click in any Value field of a selected property and enter a new value, if required.
-
Click
 to save your changes.
The polygon section displays the mass and volume within, and additional tools enable you to do the following:
|
Reclaim ( |
Adjusts material in the selected area by allocating it to an appropriate sink (such as a crusher). To reclaim material, follow these steps: |
|
Edit Properties( |
Click on Edit Properties to open the properties editor. |
Remove Polygon ( ) ) |
Click to remove the polygon from the viewer. |
 )
)-
Click
 and select an area to query the underlying terrain properties. Multiple polygons can be created, each are given a unique colour and added to the view details panel. Their combined properties are aggregated under Properties.
-
Hover your mouse over a listed polygon marker to see a tool-tip showing its properties.
-
Hover your mouse over an individual property to open a tool tip showing a chart, similar to a dashboard widget.
-
-
Click
to enter editing mode, make a polygon within a stockpile, solid, or zone, allowing you to use the following tools:-
Click
to use the  ,
,  ,
,  ,
,  context tools.Click to view instructions for splitting a stockpile
-
Click
 to open a panel.
 -
In the Categories drop-down list, select Stockpile.
-
Click
to enter editing mode, then make a polygon around the area to separate from the current stockpile. Press Space to stop editing. 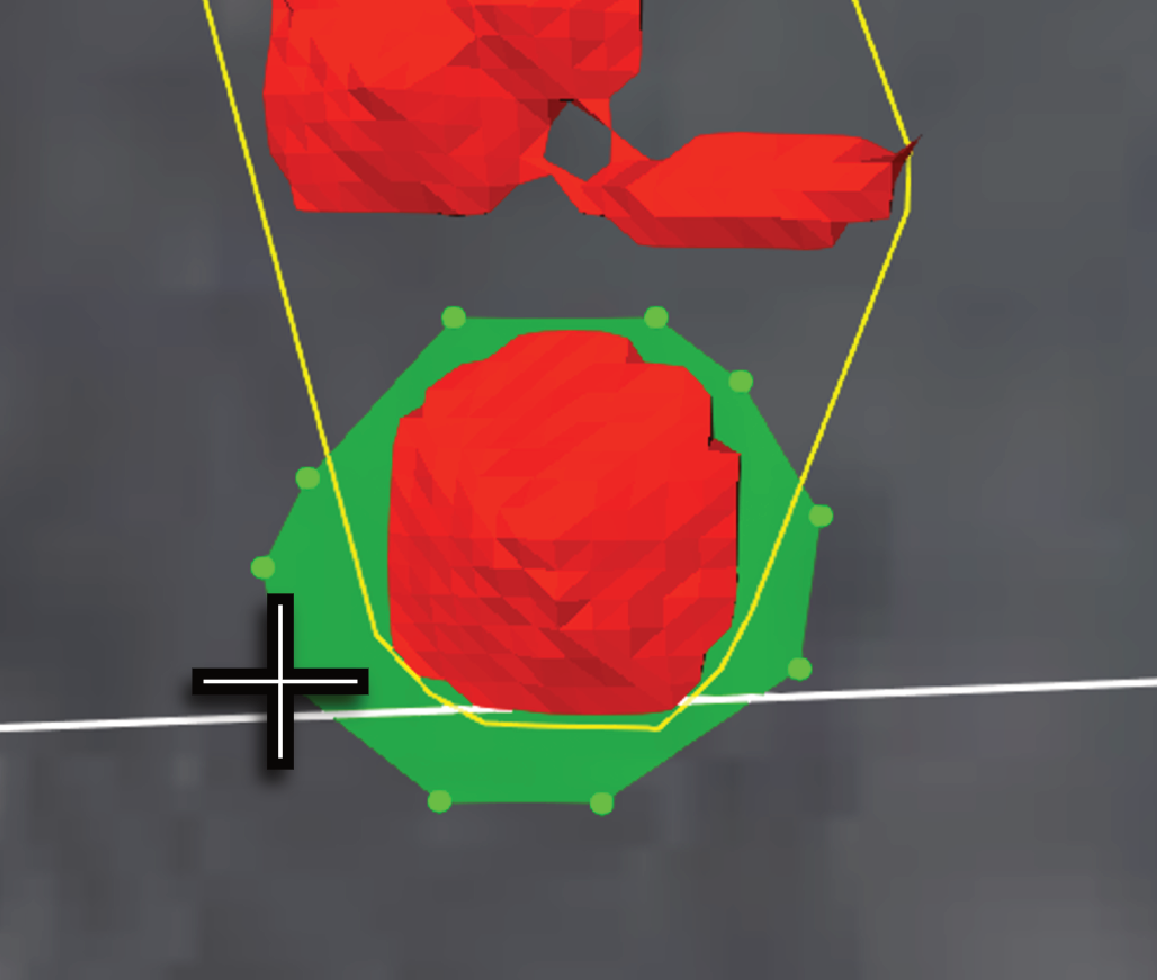
- Click and select .
-
In the Enter name for the new stockpile panel, type a name In the Name field, then click
. The new stockpile is saved, and both stockpile boundaries are dynamically updated, as illustrated.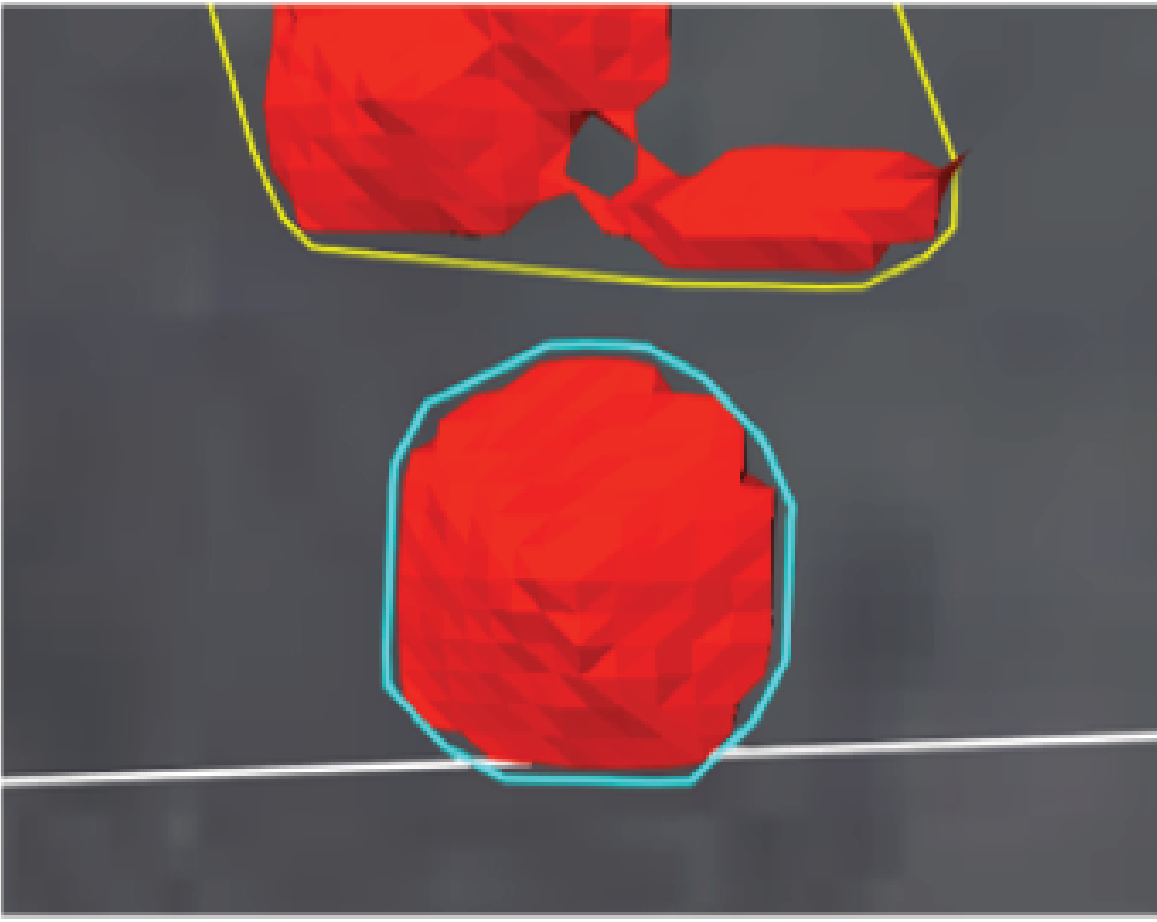
-
-
Click to view instructions for clearing material from a stockpile
-
Click
to open a panel. -
In the Categories drop-down list, select all that apply.
-
Click
to enter editing mode, then make a polygon around the area to clear. Press Space to stop editing. -
Click
and select . -
In the Clear Material confirmation, click
 .
.
-
-
Click to view instructions for exporting a polygon selection as a surface or ASCII file
-
Click
to open a panel. -
In the Categories drop-down list, select all that apply.
-
Click
to enter editing mode, then make a polygon around the area to clear. Press Space to stop editing. -
Click
and select , or . For exporting a surface, select the file type, then click
 . The file is named [SurfaceExport] in the chosen file format.
For exporting as ASCII, the file is immediately generated and saved in a ZIP folder named
[Selected Polygon Ascii Model].
-
-
Moving material in a stockpile to another location
Move material allows you to manually move material within the site from one point to another using simple point-and-click gestures. The placed material follows the Site Configuration material modelling settings in the system bar. To move material, follow these steps:
-
Adjust your view to identify the source location of the material.
-
Click
 . The mouse pointer will change to a cross.
 -
Click to select the source location from which the material will be moved.
-
Move your mouse pointer to the destination point and click to set (a yellow line connects source and destination points).
-
In the Movement Options panel, confirm or update the following information:
|
Load location |
The coordinates where the material will be loaded according to the location chosen in step 3. |
|
Load time |
The intended time (and date) at which the material will be loaded. This can be adjusted using the calendar picker. |
|
Load location |
The coordinates where the material will be dumped according to the location chosen in step 4. |
| Load time | The intended time (and date) that the material will be dumped. This can be adjusted using the calendar picker. |
| Payload mass | The tonnage of the material to be moved. This value can be adjusted if required. |
| Digger Name | The name of the equipment used to load material into the truck. You can edit this field if required. |
| Truck Name | The name of the truck moving the material. You can edit this field if required. |
-
Click
 to complete the task. MaterialMRT updates the data and performs a replay to update the system (but not the FMS source itself).
Note: Material sent to any non-sink zone is modelled on the terrain. Material sent to a sink will not be displayed.
