 Outflows
The Outflows tools reconcile operational material grade data against lab and quality control results focused on maintaining compliance, quality, and quantity control of material sent to crushers and processing plants. Outflows, offer the following tools:
-
Viewer by time: Compare a selected outflow metric alongside lab results in real time or over a preceding period. To learn more, see Viewer By Time.
-
Viewer by area: Compare a selected outflows and lab metric within a selected area. To learn more, see Viewer By Area.
-
Chart: Compare outflows alongside analyser and lab results in real time or over a prece
ding period. To learn more, see Chart.
Viewer By Time
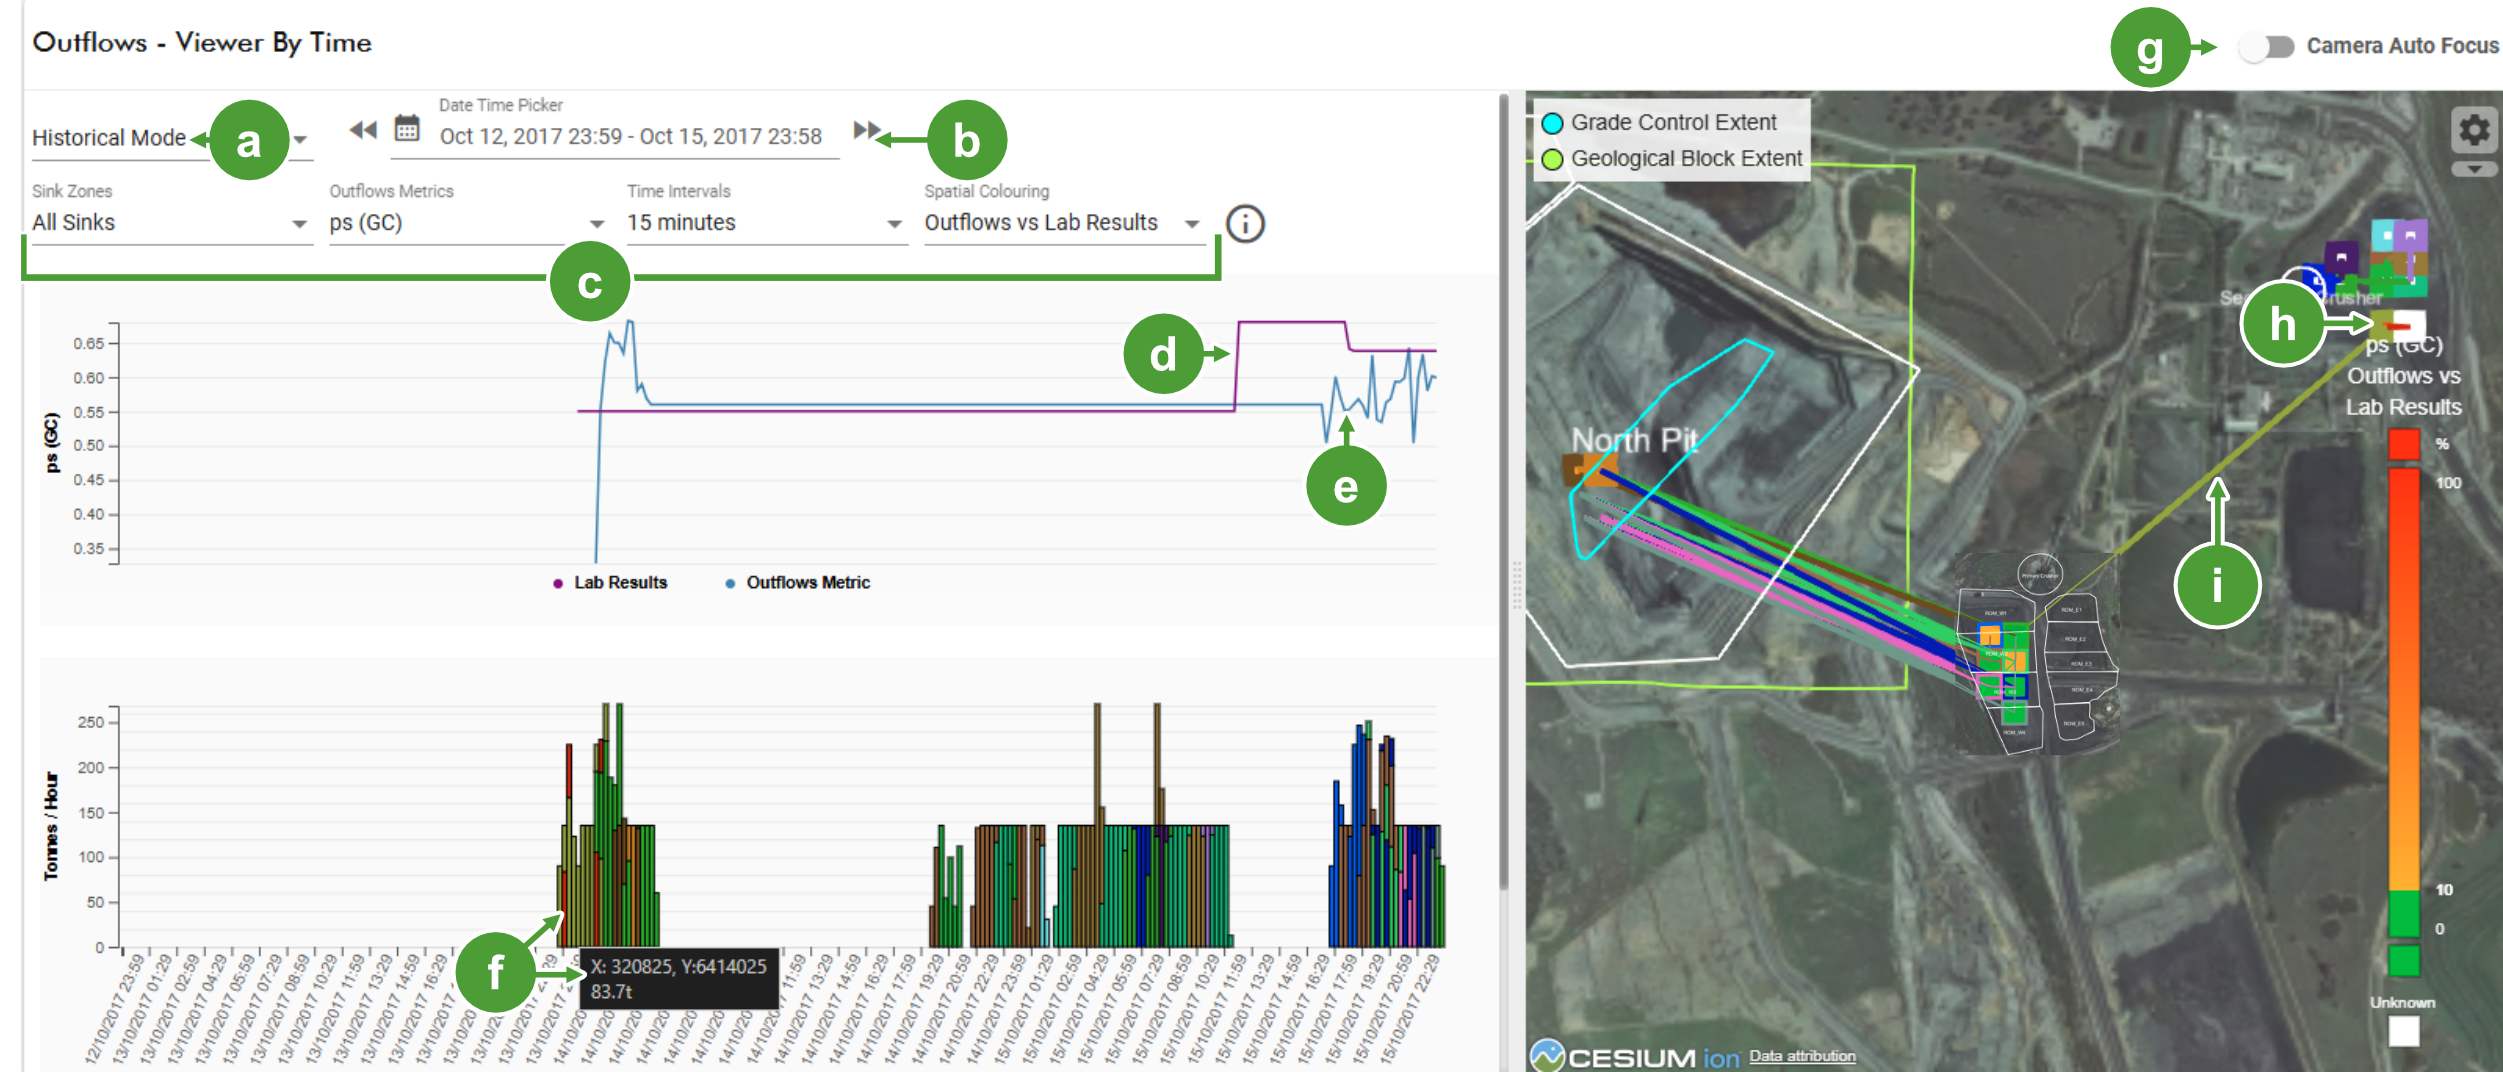
The Outflows - Viewer By Time page reports the grade and tonnage of a selected outflow metric. The grade data is displayed on a chart and its tonnage of over time appears on the graph below. The interactive viewer allows you to locate and identify specific geological and colour-coded grade control blocks.
-
Click on a bar in the Tonnes/Hour-Tonnes Per Source graph to centre the block in the viewer.
Tip: Enable the
 toggle to allow the camera to recentre and zoom to show blocks selected from the graph.
 -
Click on a block in the viewer to highlight its data in the same graph.
-
Hover your mouse over a block in the viewer to see a tooltip showing a summary of the block’s coordinates, outflows, and lab results.
-
Hover your mouse over a bar in the graph to see a tooltip showing a summary of the block’s coordinates and tonnage.
|
|

|
Latest Mode / Historical Mode selector |

|
Graph data mouse-over and tooltip |

|
Time Date Picker for historical mode |

|
Camera Auto Focus toggle |

|
Outflows dataset parameters |

|
Location marker highlighted by item |

|
Lab results plot |
|
Link representing rehandled movement |

|
Outflows Metric plot |
Generating a Viewer by Time query
Create your query by following these steps:
-
Select the time instance to sample from the Latest Mode/Historical Mode drop-down
If you select Historical Mode, proceed to step 2.
If you select Latest Mode, proceed to step 3.
-
Use the Time drop-down to select a set period, or use the calendar picker.
-
Expand the Zone drop-down and select any of the available sink zones.
-
Expand the Outflows Metric drop-down and select the property type to sample.
-
Expand the Time Intervals drop-down and select the required sampling rate.
-
Expand the Spatial Colouring drop-down and select one of the following: Outflows vs Lab Results, Outflows, or Lab Results.
Based on your selection the following information will be displayed:
-
A line chart that displays the selected outflows metric and spatial colouring.
-
A stacked bar graph representing the tonnage rate of all outflows and sources.
Note-
Grade control blocks only appear within light blue boundaries.
-
Geological blocks only appear within light green boundaries.
-
Viewer By Area
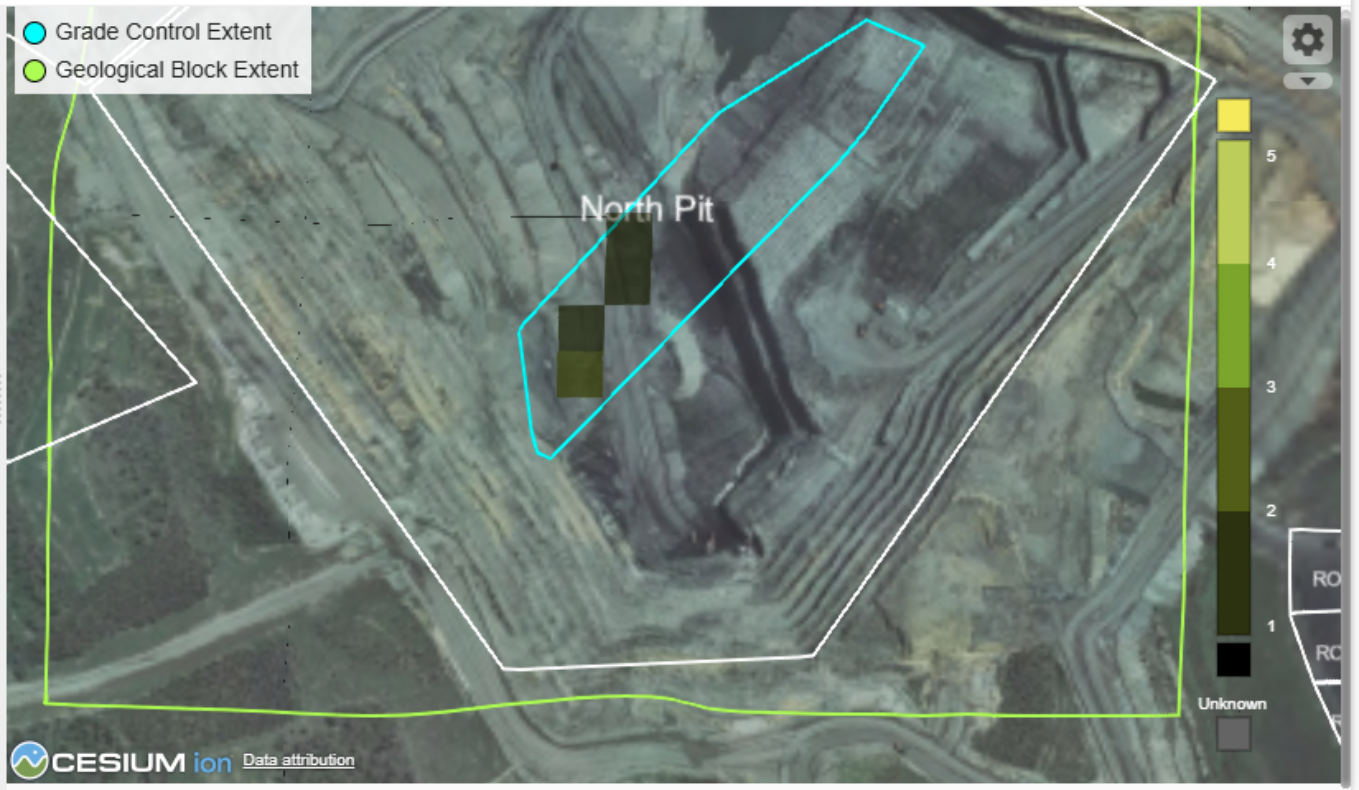
The Outflows - Viewer By Area page allows you to display grade control or geological blocks by selecting an area to examine. The blocks represent every movement that occurred at that area, displayed in the selected spacial colouring scheme.
To acquire outflow data to display in the viewer, follow these steps:
-
Click
 , then create a polygon over the area of interest.
Note: To see any geological or grade-control blocks, the selection polygon must lie within the respective boundaries in the viewer.
-
Expand the Tile Size drop-down and select one that is suitable.
Tip: Tiles that are less than 25 m2 are suitable if high-accuracy coordinates and GPS data are used at the site, otherwise, the recommended block size is 30 m2 or greater.
-
Click
 to display any geological or grade control blocks within the selected area.
 -
Expand the Outflows Metric and Lab Metric drop-down and select the required metric for each.
-
Expand the Spatial Colouring drop-downs and select any of the following:
-
Over/Under Outflows vs Lab Results: This scheme indicates variance of material outflow compared to the lab results.
-
Outflows vs Lab Results: This scheme shows the variance between the selected outflows metric and compares it to a selected lab metric.
-
Outflows: This scheme shows the outflow values only.
-
Lab Results: This scheme shows the lab results only.
-
Applying filters
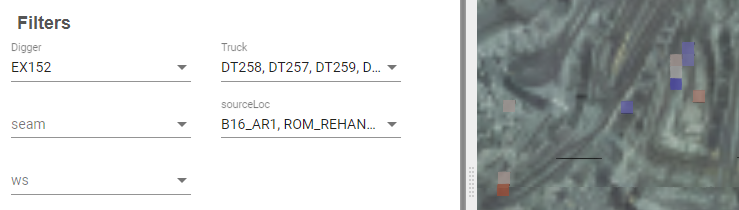
The Filters section lets you narrow down which outflows are included in the analysis so you can focus on specific equipment, material, or elevation ranges. Each drop-down in this section represents a different attribute (for example: digger, truck, seam, working section, etc.), and choosing values in a drop-down restricts the results to only those items; leaving a drop-down unset effectively means “all” for that attribute.
Filter by Z Level
Filter your current results by setting an upper and lower vertical extents boundary. This is useful when isolating information related to a particular bench or allowing for changes in the local terrain. To apply the z level filter, do the following:
-
Enable the
 toggle.
 -
In the Z level Lower bound field, enter the lowest allowable height.
-
In the Z level Upper bound field, enter the highest allowable height.
Confidence
Confidence allows you to set the amount of blending of the lab and surveyed material properties by the number of source samples over a time period. Select the following Crusher Blending Tolerance radio buttons:
-
Low: Time periods only blend materials from relatively few sources.
-
Medium: Time periods can blend materials from a moderate number of sources.
-
High: Time periods can blend materials from many sources.
Direct feed only
Enable the  toggle to only include data that has not been rehandled.
Chart
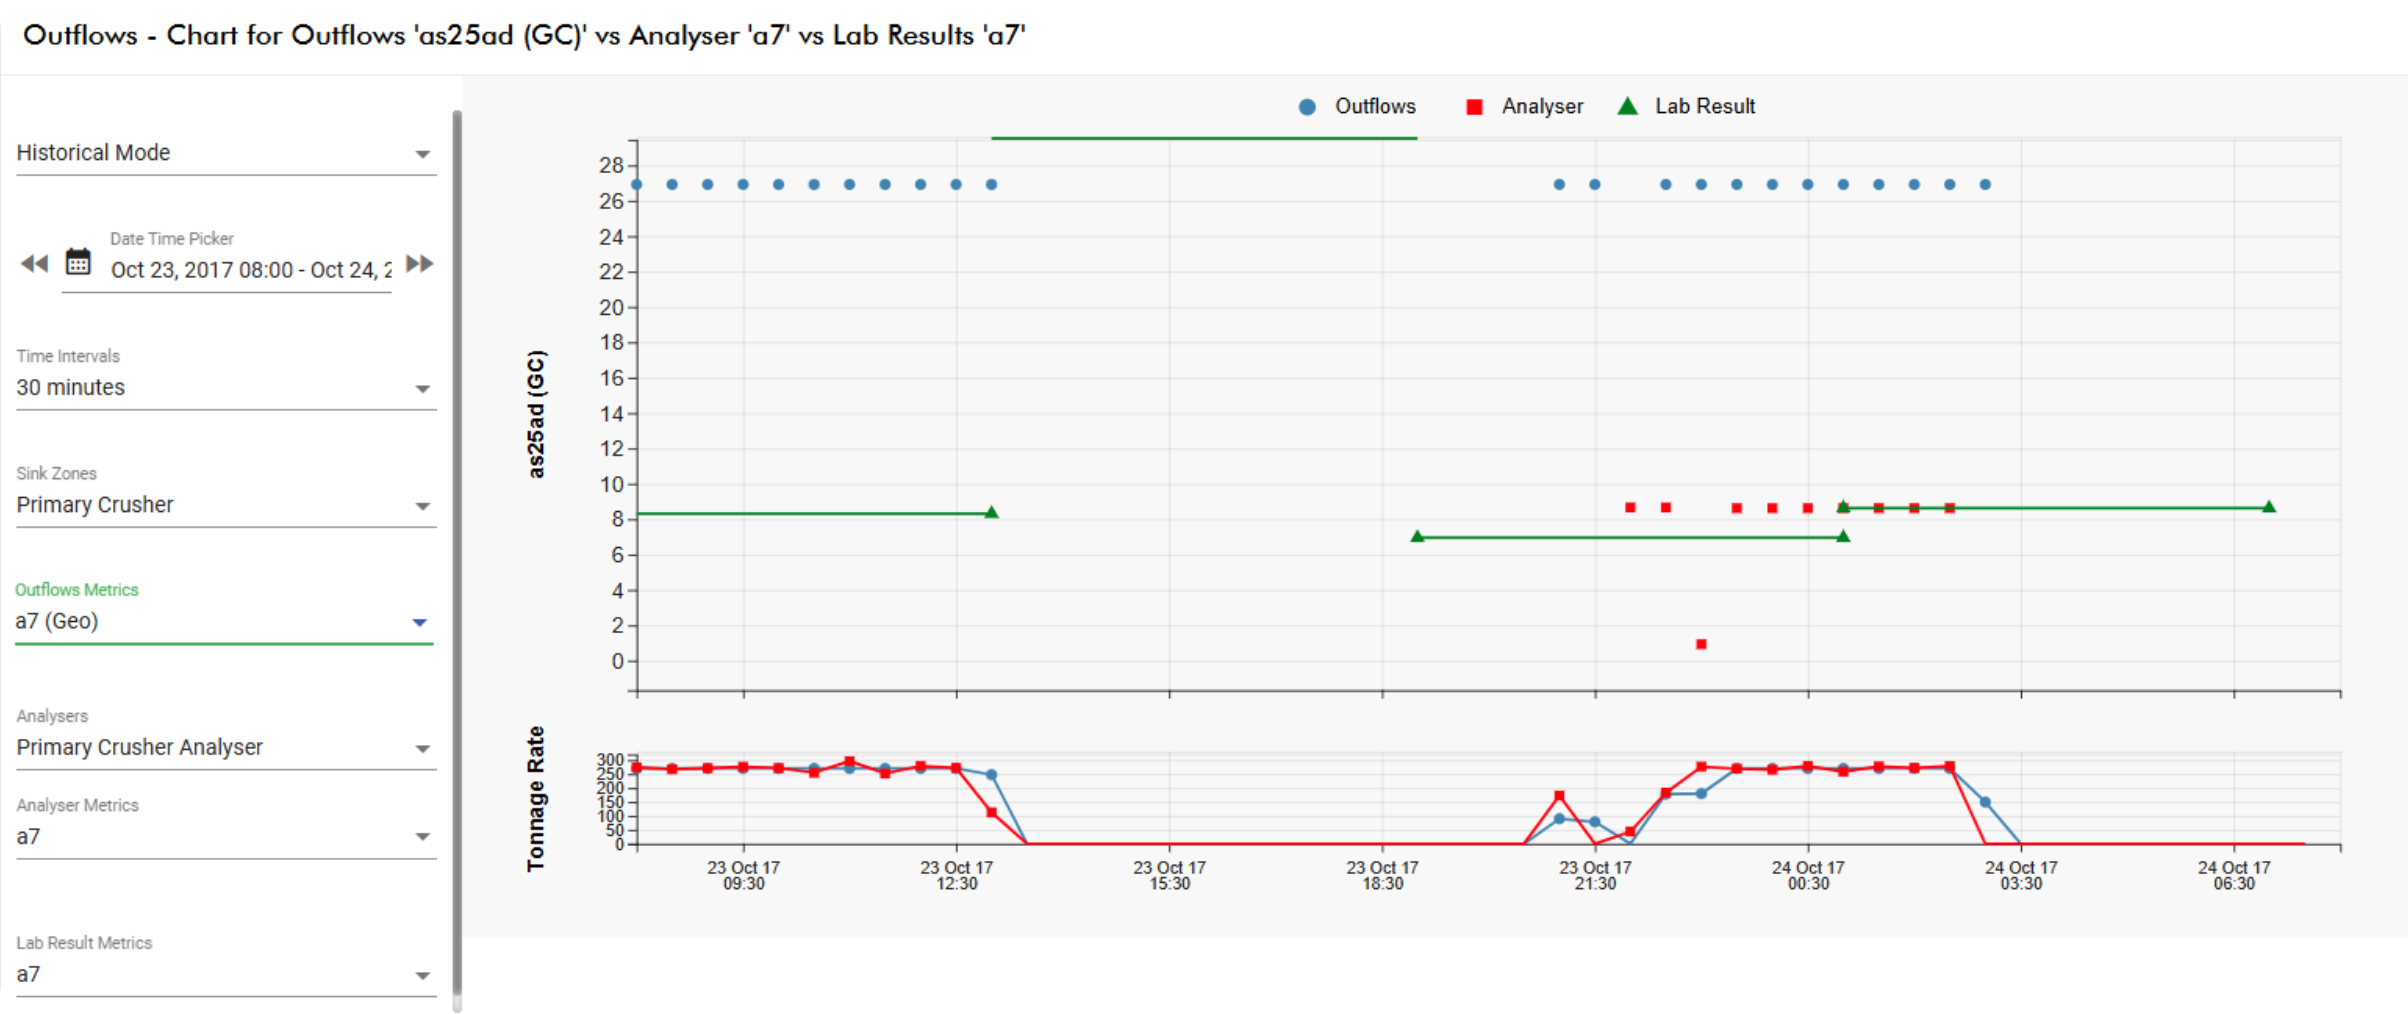
The Chart page allows you to compare an outflow metric with concurrent lab and analyser measurements. Alongside results presented by metric value and tonnage rate, you can also include modelled or planned metrics to reconcile actual outcomes against expectations. Flexible options let the analyst select the desired metrics and time periods, which helps to observe trends, deviations from planned outcomes, and assess production and quality performance in context.
Creating a chart query
To create a query, follow these steps:
-
Select Historical Mode or Latest Mode from the drop-down.
For Historical Mode, use the Date Time Picker to select the start and end period, or a specific interval.
-
In the Time Interval drop-down, select the interval that best matches the rate that samples are taken.
-
In the Sink Zones drop-down, select the outflow destination, such as a crusher or processing plant.
-
In the Outflows Metric drop-down, select which outflow to monitor or sample.
-
In the Analysers drop-down and select the analyser (if required).
-
In the Analyser Metric drop-down, select an available property.
-
Expand the Lab Result Metrics drop-down, select an available property.
The chart is automatically updated as selections are made. The top chart shows your outflows values alongside analyser and lab results. The bottom graph displays the outflows and analyser tonnage over the same time interval. Note that lab results are shown as continuous lines, indicating the latency between acquiring a sample and obtaining a result.