Create Control Points
The Control Points tool helps you model stratigraphic sequences more accurately by automatically creating additional guiding points that enforce realistic geological behaviour in areas where depositional surfaces pinch, swell, or are discontinuous. This is especially useful when building stacked depositional surfaces where unit thickness varies or where drillholes do not fully intersect the sequence.
The tool generates two key types of points:
-
Pinch-out points - Added as zero-thickness intervals where the logged geology indicates that a unit is absent. These points force the corresponding surface to terminate correctly rather than being unrealistically carried through the model.
-
Stacking control points - Added as interpolated intervals at the top or base of drillholes that do not intersect the full sequence. These ensure that surfaces honour the correct stratigraphic order and do not cross over younger or older units.
Together, these points give the Modelling Manager enough control to generate stratigraphic surfaces that honour drillhole data, unit terminations and thickness variations, including within faulted sequences, without requiring extensive manual editing.
The guiding control points are presented, with the logged data, as simplified constructed drillholes in a Control Points database. These are fully compatible with and integrated into the GeologyCore modelling system, to create fully controlled stratigraphically consistent models.
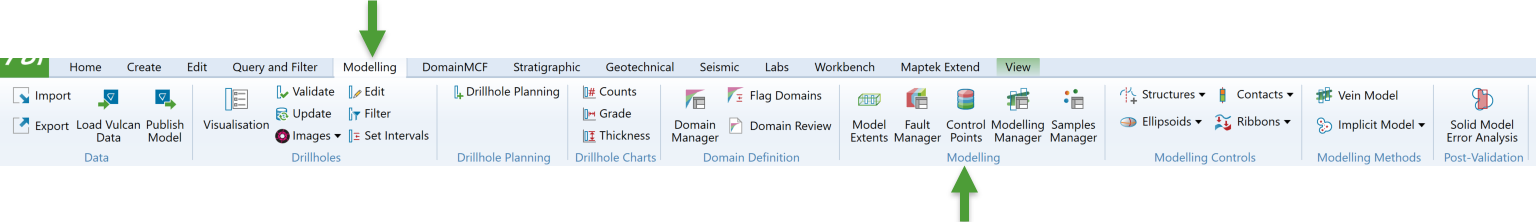
The Control Points tool is located under the Modelling section of the Modelling ribbon tab.
Selecting this option will open the Control Points panel, which has multiple tabs.
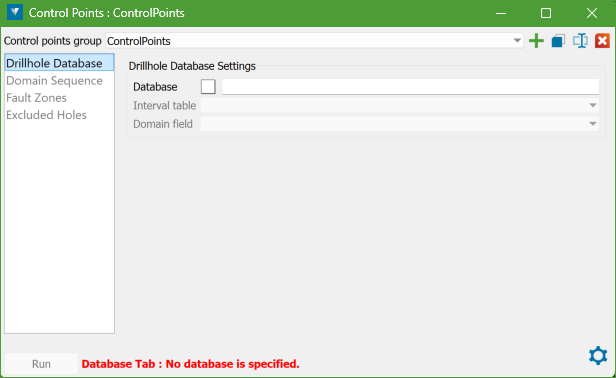
Note: You need to work through the tabs in order, from top to bottom. The lower tabs will stay locked until you have correctly filled in the higher tabs. If something is wrong, a message will appear at the bottom of the panel in a warning colour, showing the errors. Once these errors are fixed, the Run button will be available. The panel updates in real time, so there is no Cancel button. You can close it at any time, and any changes you have made will be saved. If you reopen the panel, your settings will be restored. You do not have to fix all errors or finish setting it up before closing. You can also undo or redo changes using the usual GeologyCore controls.
Control Points Group
A Control points group object acts both as a container for storing data and as a set of specifications. These objects are created within the GeologyCore system’s control points container.
The Control Points Group container serves as the repository for the resultant control points database(s) created by running the tool using the associated specifications of that Control Points Group.
Control Points Group controls
The drop-down list contains all the available Control Points Group objects. By default, it will show the last Control Points Group that was in use when the panel was closed. If you're opening the Control Points panel for the first time in a project and no Control Points Group objects have been created yet, a new, empty Control Points Group object will automatically be created, named ControlPoints by default. You can rename or modify this object using the controls provided in the panel.
|
|
Create a new control points group |
|
|
Make a copy of the current control points group |
|
|
Rename the current control points group |
|
|
Delete the current control points group |
Note: While setting up the specification, the panel status is displayed at the bottom of the panel. The status message shows the first invalid item detected. There may be additional issues, but only the first one is displayed at a time. Once the item is corrected, the next invalid item will appear. If no status message is shown, the specifications are self-consistent and ready for creating Control Points.
Control Points Workflow
The workflow in the Control Points panel follows a top-to-bottom order through the tabs, as shown on the panel's side bar. Not all tabs require to be filled but it is important for users to review it before moving forward in the setup process.
Follow these steps to get started with Control Points:
-
The Control Points tool uses a drillhole database as input that contains at least one geology table with a downhole interval data.
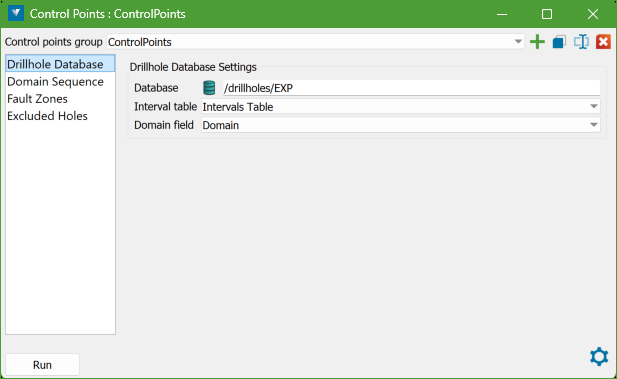
To choose the database, drag and drop it onto the Database field in the panel. Then it automatically picks the most likely table containing geological intervals from that database and fills in the Interval table field. After that, it selects the most suitable domain field from that table and places it in the Domain field option.
If the database has several tables that could contain geology, the tool uses the first one it finds. Where possible, it prefers an intervals-type table with a domain field created using the Domain Manager.
-
This tab lets you set up the sequence of horizons or domains that will be used to create control points.
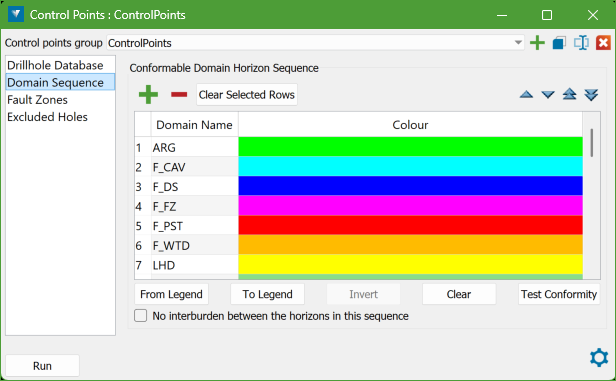
It presents a datagrid where you can enter the names of the geological horizons or domains you need, and attribute a colour to each one, coming likely from a legend specific to the Control Points specifications.
You can also specify whether the horizons are expected to have interburden between them (as in a typical coal sequence), or whether they represent a set of domains with no interburden. In the latter case, the contiguous sequence itself describes the full stratigraphy.
In many cases, a legend already exists from other GeologyCore tools, containing some or all of the domain names and colours you want. You can either fill in the grid manually to create a new sequence, or load an existing legend you’re already satisfied with.
The sequence entered must be conformable with the geological sequence in the database. Likewise, the database holes must be conformable with the sequence on this tab to be used as the control points data.
The sequence does not need to represent the complete geological sequence for the selected geology table. It can be a subset containing only the horizons of interest, and some horizons may be omitted if not required. However, to accurately represent a stratigraphy where no interburden is expected, all contiguous horizons in the subset must be included.
Sequence Controls
There are controls provided to edit and adjust the defined sequences, and to test both the sequence and the holes for conformity.
Controls above the sequence datagrid:

Add a new row to the datagrid 
Delete a selected row from the datagrid 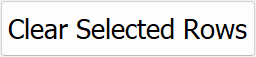
Clear the selected row(s) in the datagrid 

Move the selected row(s) up or down in the datagrid 

Move the selected row(s) top or bottom of the datagrid Controls below the sequence datagrid:
From Legend Import the names and colours of horizons or domains from an existing legend. To Legend Export the sequence table to a legend object. Invert Invert the selected block of rows, or the entire sequence table if nothing is selected. Clear Clear all entries from the sequence table. Test Conformity Test the sequence for conformity against the drillhole data. Using an Existing Legend
You can load an existing legend either by dragging and dropping it onto the datagrid or by selecting the From Legend button. Only string legends are accepted.
Drag and drop
Dragging and dropping a legend onto the datagrid replaces the entire current sequence table with the contents of the legend.
From Legend
Selecting From Legend opens the legend selection panel.
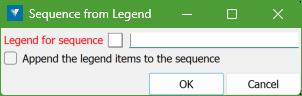
A legend can be dragged onto the selection field. You may either replace the current sequence or append the legend to the existing entries. This allows a complete sequence to be built from several separate legends if needed.
Creating a New Legend
Selecting the To Legend button opens the create legend panel.
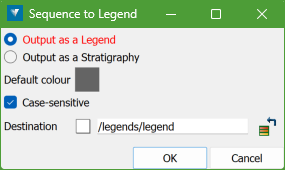
Here, the defined sequence can be saved as either a standard legend item or a stratigraphy legend.
Test Conformity
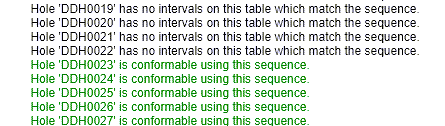
This option checks whether the holes in the selected database follow the sequence defined. It helps confirm that logging follows stratigraphic order, and also whether the sequence itself is appropriate for the geology.
Some holes may not be conformable. This is not a problem for Control Points. Such holes can be added manually to the Excluded Holes tab, although they will be excluded automatically during processing.
Running the Test
Select Test Conformity button to generate a report for all holes in the database (excluding those already listed in Excluded Holes).
A hole is considered conformable if the named intervals in its interval table occur in the same order as in the sequence table. Intervals with names not included in the sequence are ignored for this test.
Holes that contain the correct sequence but in reverse order are still considered conformable, and will be reported as inverted. The Control Points process can handle these cases, such as underground holes drilled upwards.
Results
If all holes are conformable, the report contains a single summary line.

If any holes are unconformable, the report lists each hole and the issues found.
A message is also displayed to alert the user. The unconformable holes can then be added to the Excluded Holes list if desired.
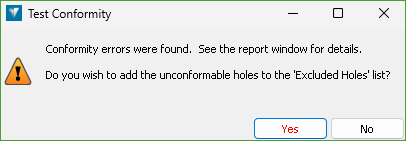
Adding them is optional. They will be excluded automatically during processing, but listing them provides an audit trail, can speed up the Control Points generation, and produces a cleaner final report.
-
The Control Points tool allows for the use of defined fault zones. It divides holes according to these zones, splitting them if necessary, and creates a separate Control Points database for each zone. This ensures that subsequent modelling generates surfaces that interact with the faults in a geologically consistent way.
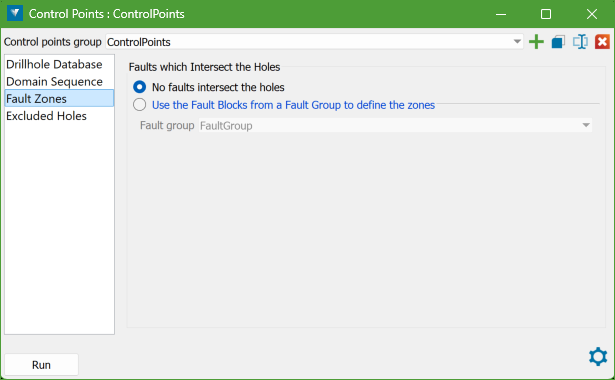
No faults intersect the holes
If there are no faults defined for the geology, select this option. A single Control Points database will be created.
Use the Fault Blocks from a Fault Group to define the zones
If faults have been defined in the Fault Manager, select this option and choose the appropriate Fault Group object. A separate Control Points database will be created for each fault zone defined in the Fault Group.
-
This tab is entirely optional. It allows you to exclude holes from the processing step when Run is pressed.
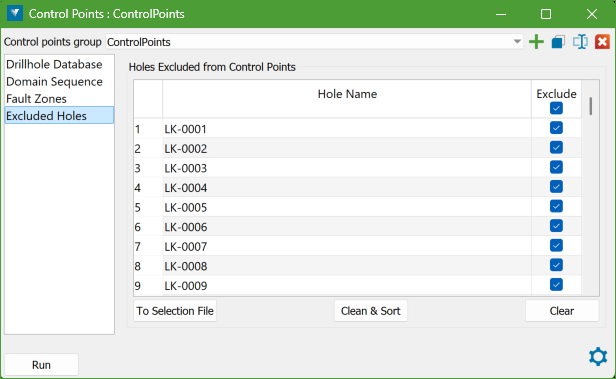
This is useful for items that cannot be fixed, such as holes with unconformable horizons or no intercepts. The list acts as an audit trail, keeps the run cleaner, and can improve processing speed.
Adding Names
Names can be added in three ways:
-
Manually, by typing them.
-
Merging them from a conformity report (see Test Conformity).
-
Dragging and dropping a selection file onto the data grid.
Once the datagrid is populated, each item has a checkbox. This can be checked or unchecked to include or exclude the hole without removing it from the list, allowing easy experimentation.
-
Datagrid Controls
When the datagrid is populated, the three controls below it become active:
-
To Selection File: outputs the ticked names to an exclusion-type selection file, named after the Control Points Group and saved in the selection files container.
-
Clean & Sort: removes duplicate items and sorts the list alphabetically.
-
Clear: removes all items from the data grid.
Advanced Settings
These settings rarely need to be changed, but the option is available if required. Clicking the ![]() button at the bottom right of the panel opens the Advanced Settings panel.
button at the bottom right of the panel opens the Advanced Settings panel.
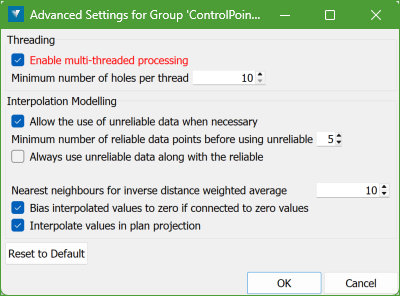
Settings apply only to the current Control Points Group. Each new group uses the default settings.
Enable multi-threaded processing
Control Points processing is multi-threaded by default for efficiency. When working with large datasets, you may restrict the number of threads, or turn off threading entirely, to free resources for other applications. This will slow the process but may be useful if other tasks are running simultaneously. In most cases, the default multi-threading is sufficient.
Interpolation Modelling
Interpolation uses measured interval thicknesses and applies inverse distance weighted averaging to compute values.
Allow the use of unreliable data when necessary
Intervals that start at the top of a hole, end at total depth, or intersect a fault may not represent complete thickness. Such intervals are considered unreliable. By default, unreliable data is used only if necessary (i.e., when there is insufficient reliable data for interpolation).
Turning off the checkbox prevents any use of unreliable data. This may cause some horizons to be reported as unfixable and halt the process.
Alternatively, there is an option to always use the unreliable data, for example, if intervals at total depth or starting at the collar are known to be complete.
Nearest neighbours for inverse distance weighted average
This sets the number of nearest neighbours used for averaging. Increasing the number may include distant points with little relevance and slow processing. Decreasing it can improve efficiency when averaging sparse data.
Bias interpolated values to zero if connected to zero values
If a point is surrounded only by zero values, it is best to exclude non-zero neighbours to avoid artificial thickness in what should logically be zero. This option is enabled by default.
Interpolate values in plan projection
Enabled by default, this speeds up typical stratigraphic modelling. For steeply dipping stratigraphy (>20°), complex domains, or vertical vein modelling, turn this off. The interpolation will then follow the plane of best fit for the data.
Reset to Default
Resets all advanced settings to factory defaults.
Running the Control Points creation
Once the required panel settings are configured and the status message is clear, the Run button becomes enabled.
Clicking the button starts the Control Points creation process. For longer processes, a progress bar will appear. The title of the progress bar updates to show each stage of the process.
When complete, a report summarising the success or failure of the process will be displayed on the Report Window, along with a toast message.
Output Databases
-
If the project contains no faults, a single Control Points database is created.
-
If a Fault Group is used, a separate database is created for each fault zone.
-
Any holes outside all defined fault zones will result in a database named No_Zone.
Each database is placed in the ControlPoints specification container within the control pointssystem container in the Project Explorer.
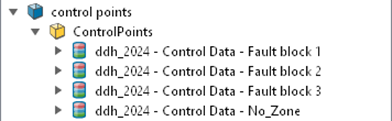
Databases are identified by a Control Points database icon and named after the parent geology database. Names include Control Data, and for faulted collections, the fault zone name is also added.
[Parent Geology Name] – Control Data – <zone_name>Control Points Data
The Control Points databases produced behave like standard drillhole databases and can be used in any application that accepts a drillhole database as input.
Each database contains only the holes that are conformable with the sequence, either within a specific fault zone or across the whole project. In faulted projects, a hole may be split between zones. Parts of a hole may be conformable in some zones and not in others. If data appears to be missing, check the run report, which includes a conformability report.
The structure of each Control Points database is identical to the parent drillhole database, with a few additions:
-
Renamed holes in faulted projects:
The hole name includes the fault zone name. For example, hole DDH0029 may appear as DDH0029_Fault_Block_1. This ensures holes are distinguishable when loading data from multiple zones.
-
Extra field on the collar record:
An additional field, Fault_Zone (localised), stores the name of the fault zone.
-
New table: Control_Points:
This table contains the Control Points results and is described below.
Control_Points data table
This table uses the same structure as the Interval table defined in the Control Points specification, with several extra fields:
Status fields
Each interval includes two status fields describing how the From Depth and To Depth values were handled:
-
From_Control_Status
-
To_Control_Status
(localised field names)
Possible values:
-
Blank: the value is unchanged from the parent database.
-
Fixed: the depth was changed or interpolated because it was unreliable, clipped, or missing.
-
Clipped
-
Unreliable: these may appear but are usually replaced with Fixed during processing. They may indicate a failure; check the run report and contact your Maptek representative if needed.
Interpolated Thickness
The Interpolated_Thickness field (localised) contains a value only when one or both depth fields have been fixed.
This is the modelled interval thickness at that location. It may match the measured thickness or differ if the interval was clipped or pinched out.
Modelling Manager uses this value to determine pinch-out behaviour between holes.
Interval Entries
The Control_Points table includes at least one interval for each item in the sequence table. It may include multiple intervals for horizons or domains that were represented by multiple intervals in the original data.
For example, in the data shown in this help, only domains 4 and 5 were present in the original data. All other domains were interpolated or clipped for that fault zone.
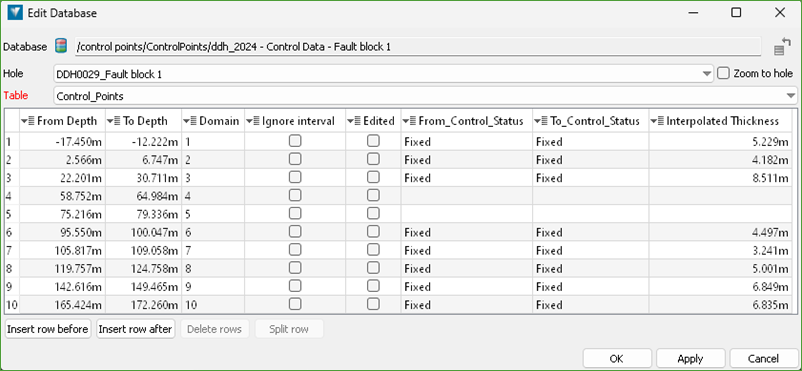
Some upper domains appear above the collar (negative depths), indicating erosion in the original geology.
When an interval is based on a parent interval rather than fully interpolated, any fields not used in Control Points processing retain their original values, for example, Ignore interval and Edited.
Modelling with Control Points data
The Modelling Manager is fully aware of Control Points databases and is designed to use their specialised fields. This allows it to build stratigraphic models that follow the rules of stratigraphy and remain consistent with the Control Points data.
Comparison with FixDHD
For users familiar with Vulcan’s FixDHD tool, the following comparison may help:
FixDHD was developed specifically for coal seam modelling and is optimised for that purpose. It includes several coal-specific assumptions, for example, that coal seam thickness is more strongly autocorrelated than interburden, which gives coal intervals greater weight during interpolation. It is not designed for highly folded or complex stratigraphy, such as the metalliferous settings.
For coal modelling, FixDHD remains the preferred tool because it provides more detailed controls and is tuned for coal-style deposits.
For most general modelling tasks, Control Points performs equally well. Its strengths lie in handling complex stratigraphic veins and domain-based geology. It is tightly integrated with the GeologyCore implicit modelling system used by the Modelling Manager and directly influences the models produced.
