Interface Overview
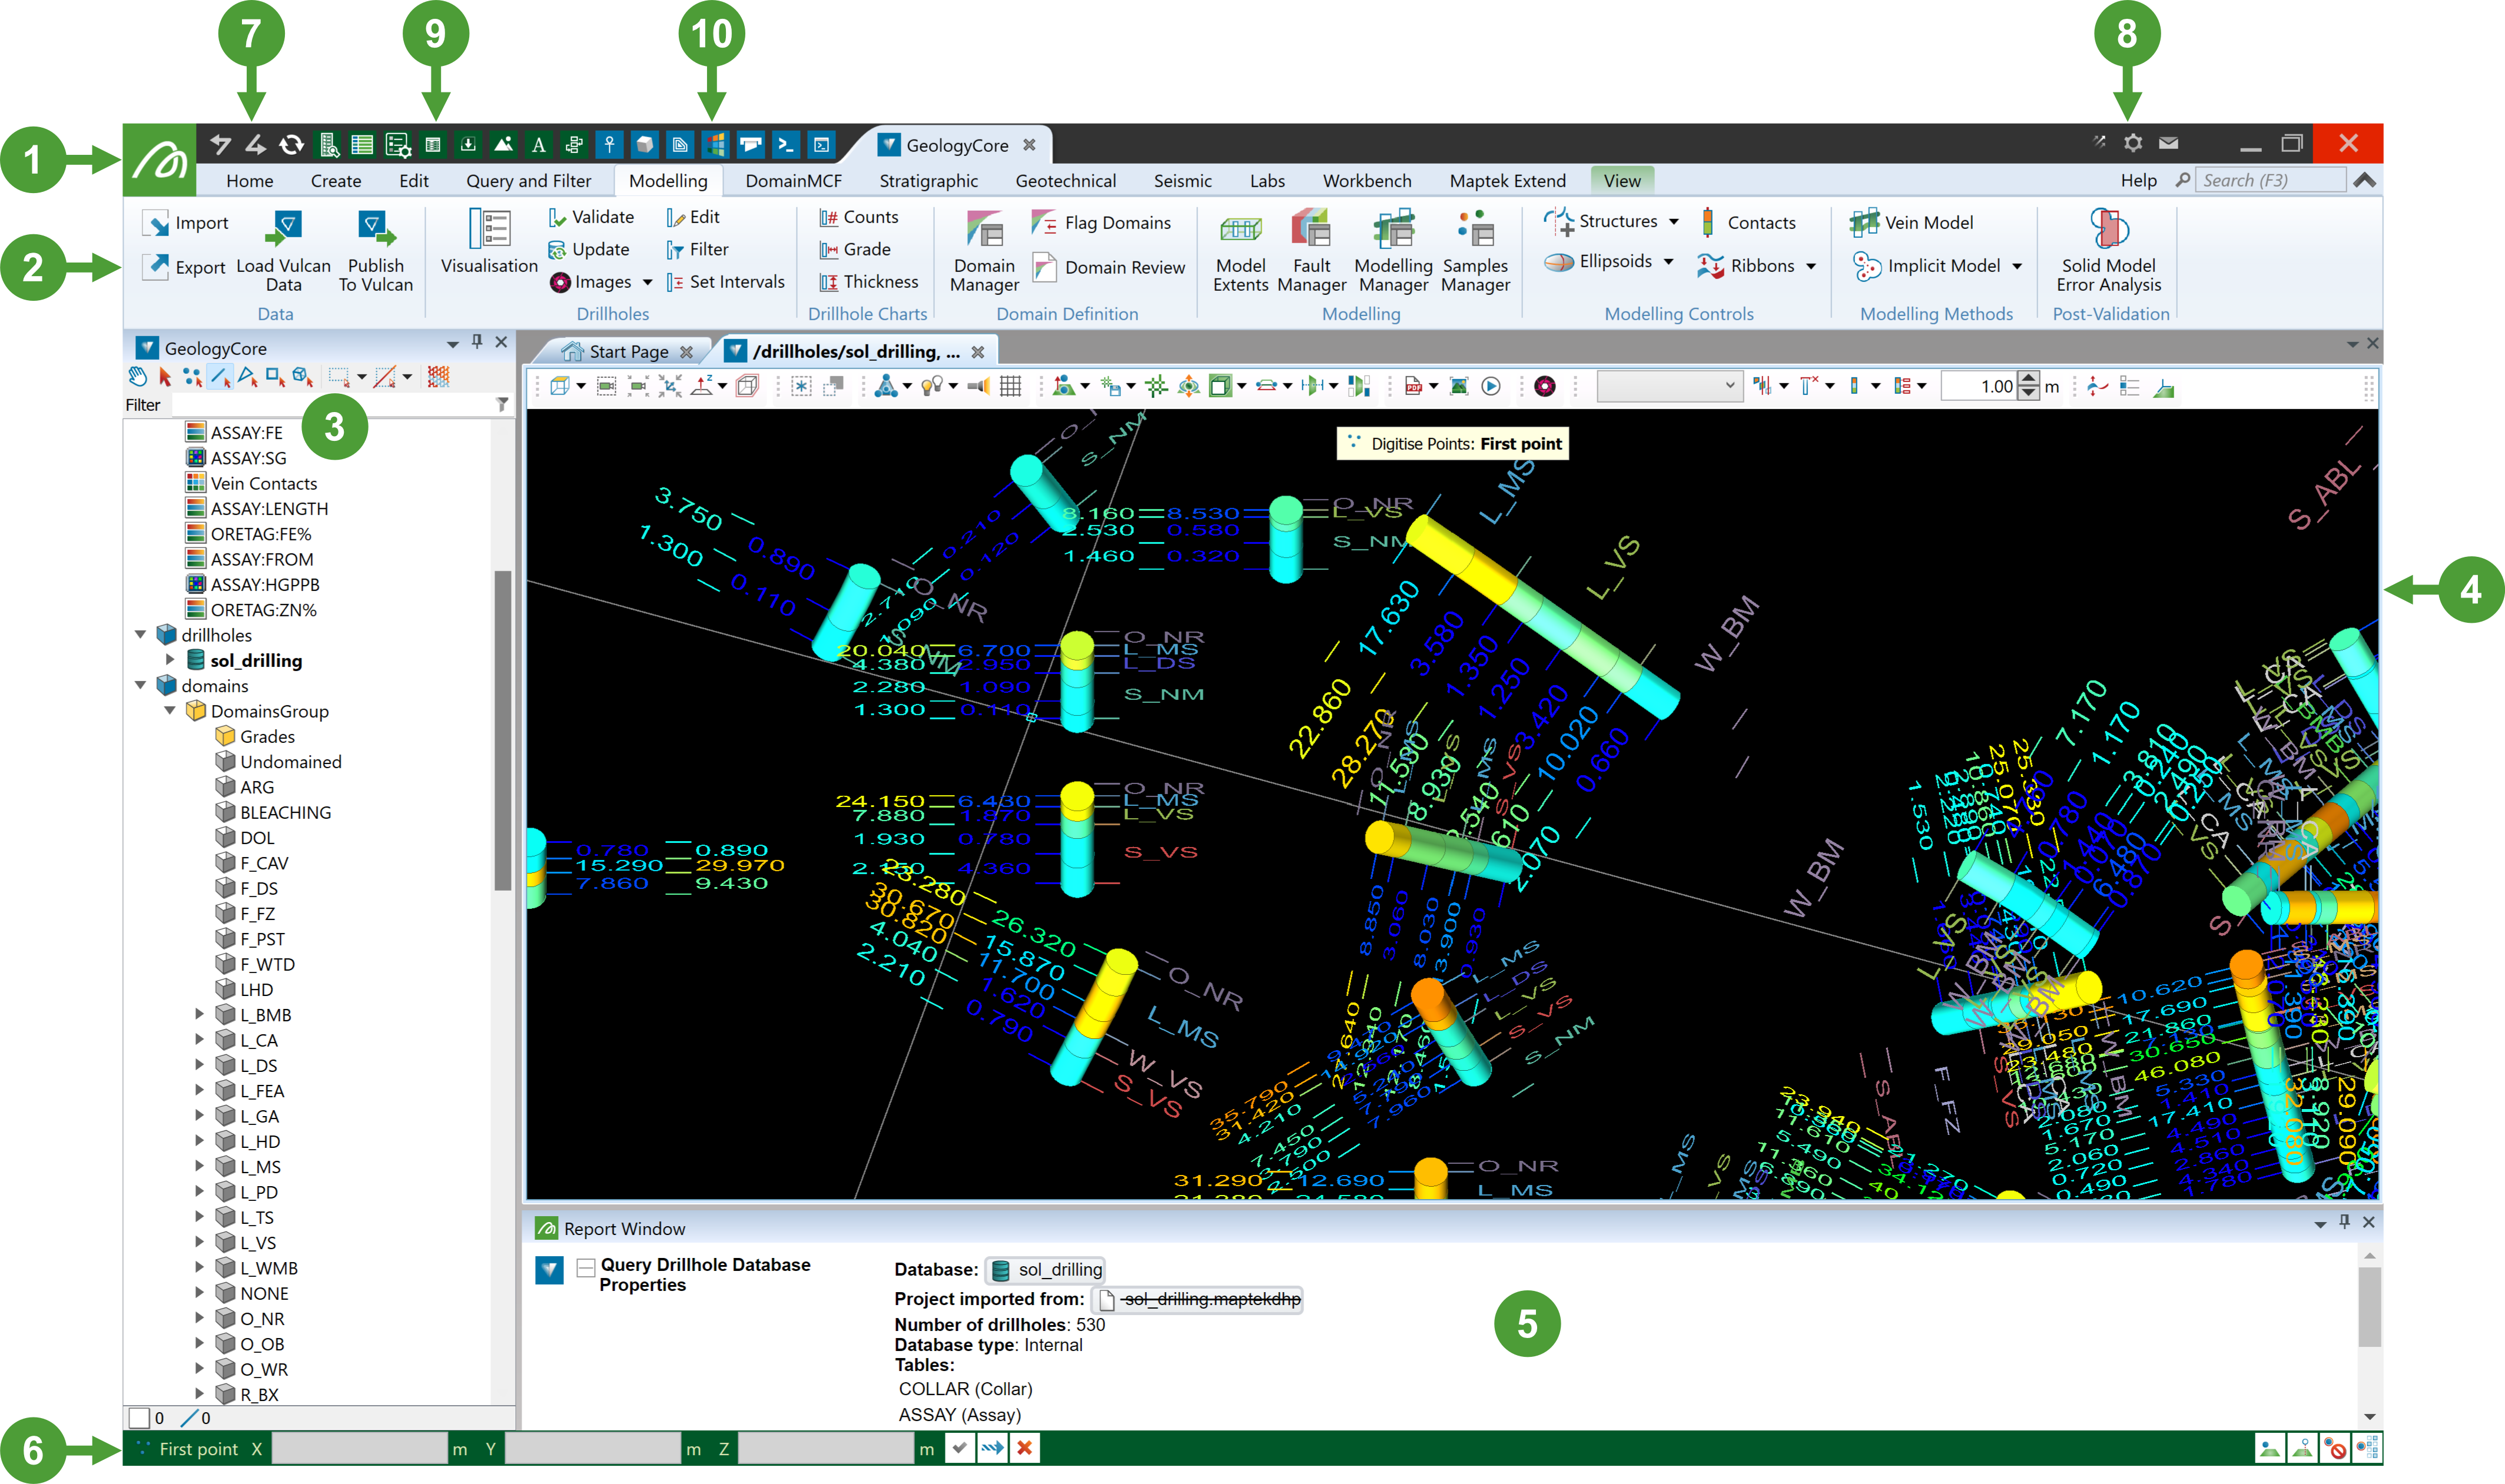
Maptek GeologyCore is hosted within Maptek Workbench. You can switch between other Maptek applications and Workbench tools, all within a single window.
|
|
-
The Workbench Launch Button
 is a general menu containing a few relevant options. From here you can launch GeologyCore, the application preferences panel, and various other tools and utilities.
 -
Ribbon menus organise groups of related tools together. These groupings either relate to a type of operation, or a workflow. Some ribbon menus (such as View) are context-sensitive, meaning they only appear when that category of tools is relevant. Some ribbon menus are only shown if you have the relevant licence entitlement. Click on a ribbon menu tab to show the tools in that menu.
-
Home — Provides access to the most common and general operations such as data import and export, object appearance, and selection management.
-
Create — Create new objects such as points, lines, polygons, text annotations, surfaces and more.
-
Edit — Perform fundamental object transformations, such as translation, scale, and rotation.
-
Query and Filter — Interrogate object properties and attributes, search for objects spatially, or show/hide object points by various criteria.
-
Modelling — Create vein and implicit models.
- DomainMCF — Create block models using advanced cloud-based machine-learning techniques via Maptek DomainMCF. Requires add-on licence.
-
Stratigraphic — Create stratigraphic models from correlated drillhole data.
-
Geotechnical — Perform geotechnical analysis on surfaces. Requires add-on licence.
-
Seismic — Visualise and analyse seismic data. Requires add-on licence.
-
View — Configure view window behaviour and control the action plane, including sections. Context sensitive.
-
-
The project explorer allows you to browse, organise, and select your project data.
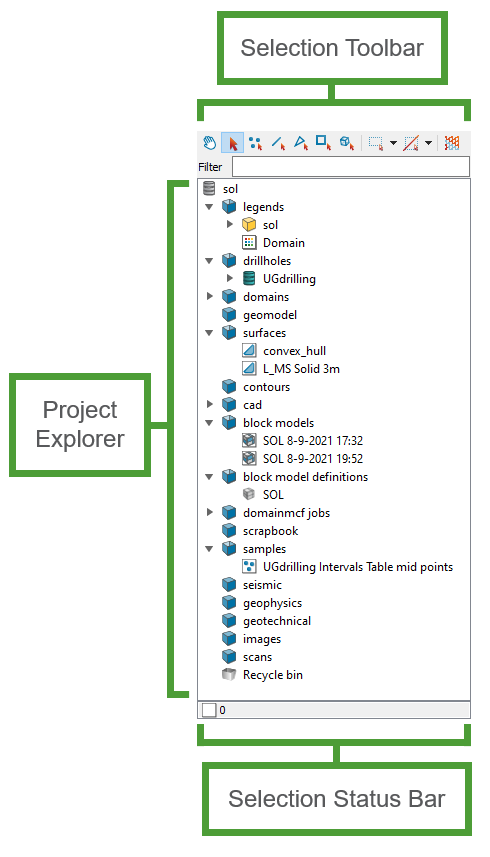
Selection Toolbar
At the top of the explorer window is the selection toolbar, which allows you to alter the way selections are made in views.
Project Explorer
The middle part of the explorer window is a listing of the objects in your project. Objects are organised in a hierarchy of containers. Standard containers
 are the default location for any objects you import or create. These cannot be deleted.
You can organise objects as you like within the project.
-
Drag and drop objects within the project explorer to move them.
-
To create your own custom container
 , right-click anywhere in the project explorer list and select New Container from the context menu.
Selection Status Bar
The selection status bar at the bottom of the project explorer summarises how many objects you currently have selected, and, if there is a primitive selection, how many primitives are selected.

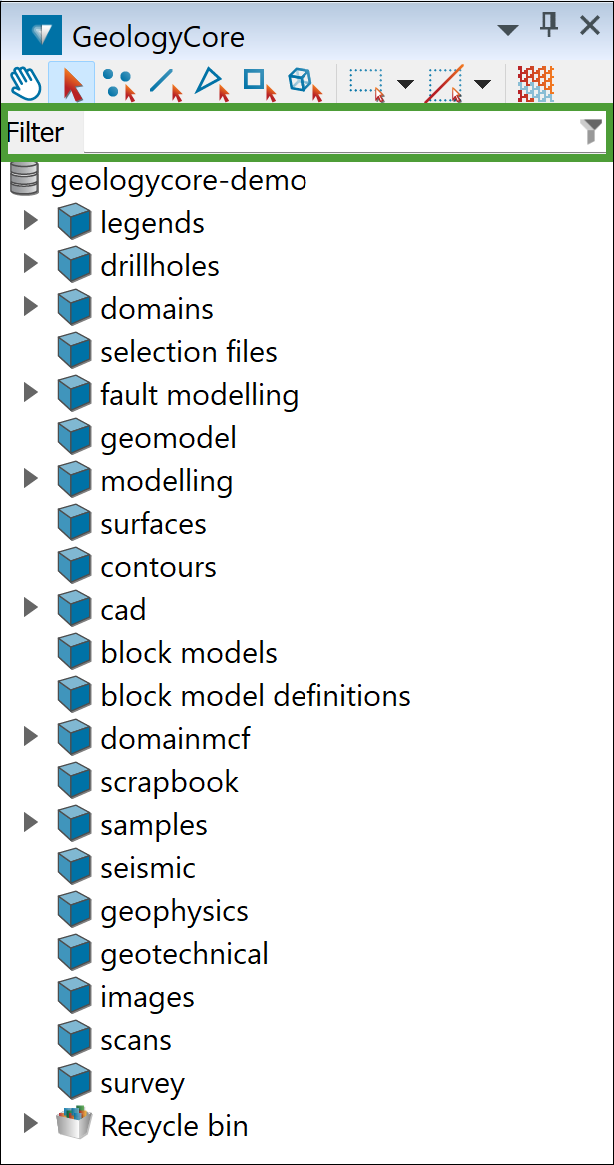
Object Filter
The project explorer includes a filter feature to enable you to find objects in the project according to criteria that you specify.
Expand each heading below for more detail.
 Searching objects via the filter panel
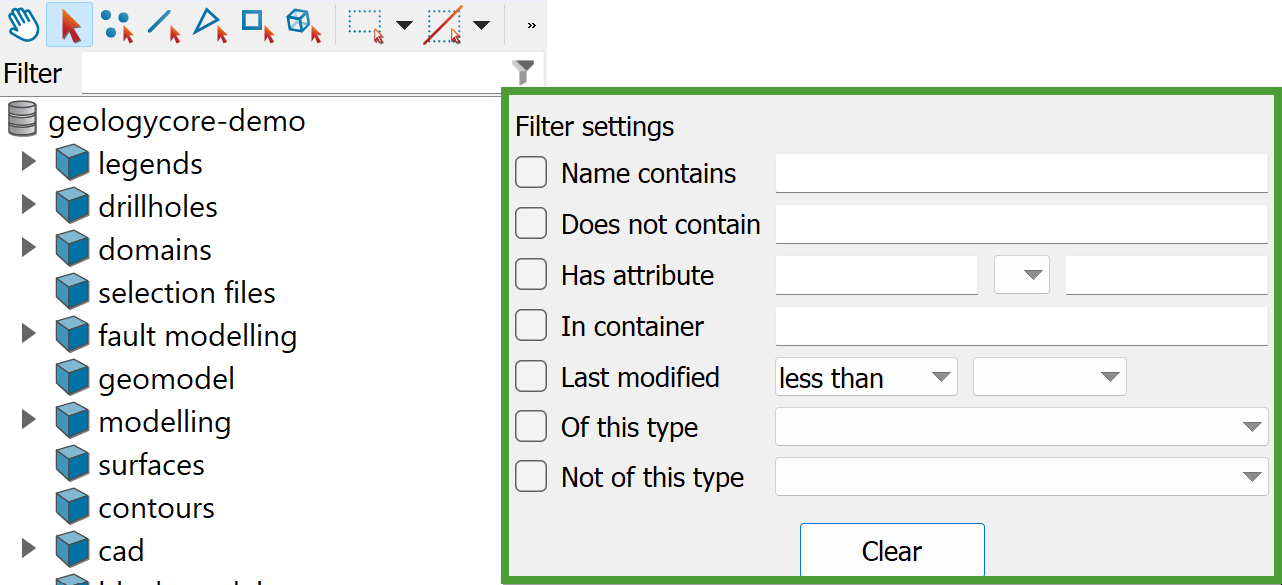
The object filter also includes an advanced search panel for building complex filters more easily.
-
To access the search panel, click the
 (Show filter options) button to the right of the Filter text box.
Note: Any criteria in the filter text box will also appear in the panel. However, if the cursor is inside a bracketed region of the filter text box when the panel is opened, only the text within brackets will be read into the panel.
In the panel, enter any relevant search criteria from the available options:
-
Name contains: Any required part of an object name. This is the same as the Filter field.
-
Does not contain: Any part of an object name to exclude.
-
Has attribute: Enter an attribute name in the left field. You may also include a search value in the right field and whether to search for objects with attribute values less than, greater than, or equal to the search value.
-
In container: A container in which to search for objects
-
Last modified: Search for objects last modified before or after a given date.
-
Of this type: Select an object type from the drop-down list.
-
Not of this type: Select an object type to exclude from the search from the drop-down list.
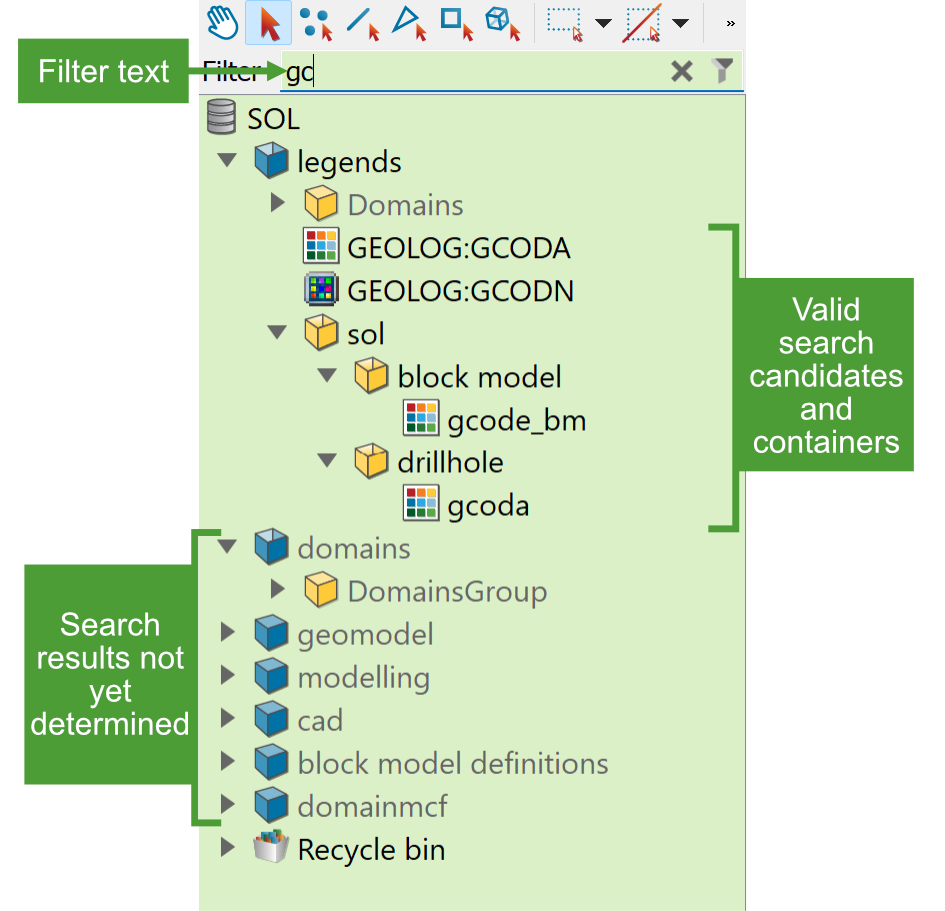
Note: As with the simple search, as soon as any criterion is provided, the project explorer’s background turns green, and valid search candidates and their containers will be darker than the rest. The filter criteria will also appear as a string in the text box.
If you need to reset the criteria, click Clear.
-
Click anywhere away from the filter panel to hide it. The filter criteria will be retained and the filter applied.
Tip-
It is not necessary to complete all fields. You can use as many or as few search criteria as you need.
-
It is not necessary to select the check boxes. These will be selected automatically when you run the search. You can re-open the filter panel and uncheck these to broaden the search without deleting the criteria.
Searching objects via the filter field
You can enter search criteria in the Filter field, ranging from part of an object name to complex expressions (see Filter expressions, below).
-
To perform a simple search by name, click in the Filter field and start typing any part of an object’s name. As soon as you start typing, the project explorer’s background will turn green to indicate that a filter is being used, and names of valid search candidates and their containers will appear darker than the rest.
 Note
Note-
While a filter is active, if you click on a container’s expand arrow
 , and that container does not contain either a sub-container or a valid search candidate, it will be hidden from view.
 -
When you clear the filter, hidden containers will be restored to view.
-
Filters are not applied to the recycle bin.
Filter expressions
You can also create a new filter by typing an expression in the filter field.
Filter expressions must follow a specific syntax, as described below.
An expression consists of tokens separated by spaces, opening brackets, and closing brackets. Each token may be a filter condition or logical operator. Expressions are then interpreted as follows:
-
(indicates the start of an expression. -
)indicates the end of an expression.Note: Brackets must exist in pairs in a filter string. Neither bracket can stand alone.
-
-inverts the operation of an expression or condition. -
ANDbetween conditions means both conditions must be met to return a match.Note: If there is no previous node, the
ANDis ignored. -
ORbetween conditions means either may be met to return a match.Note: If there is no previous node, the
ORis ignored. -
createdorchangedat the start of a condition filters by object creation date or modification date. To be a valid filter, it must be followed by either<or>and then either a date (in YYYY-MM-DD or DD-MM-YYYY format) or a duration (a number followed by s, m, h, d, w, mon or y). This filter will then find objects with:-
creation or modification dates before or after the specified date
Or
-
elapsed time since creation or modification is less or greater than the specified duration.
-
-
has:at the start of a condition (or the translation to the primary language) is an object attribute filter. The string after the colon is applied, as follows:-
If it contains
=, the object must have an attribute whose name matches the text before the=and whose value equals the text after the=. -
If it contains
!=, the object must have an attribute whose name matches the text before the=and whose value does not equal the text after the=. -
If it contains
<,<=,>or>=, the object must have an attribute whose name matches the text before the operator and whose value is less than, less than or equal to, greater than, or greater than or equal to the text after=.Note: Attribute names in these expressions are not case sensitive.
-
-
in:at the start of a condition (or the translation to the primary language) is a container filter. An object must have a parent whose name exactly matches the text after the colon. -
is:at the start of a condition (or the translation to the primary language) is a type filter. The filter searches for objects of the specified type. Valid types are:annotation
marker
string
blockmodel plane
surface
drillhole
points tangent
grid
pointset
tangentplane
line
polygon
text
lines ribbon
scan
triangulation
Example-
in:cad AND created<1wwill search for data in thecadcontainer that was created in the last week. -
is:surface AND has:filteredwill search for all surface
 objects that have an attribute called
 filtered.
Note-
Any text in a filter string that has spaces must be enclosed in quotes.
-
Tokens may be entered in either the current primary language or in English. For example, if the primary language is French, you can enter either is: or est:
-
All other tokens are considered to match part of the item's primary name (case insensitive).
-
If the filter expression is not valid, the filter field background turns red. The filter field tooltip will provide the reason that the expression is invalid.
-
-
A key area of the user interface is the 3D view window—this is where your data is visualised.
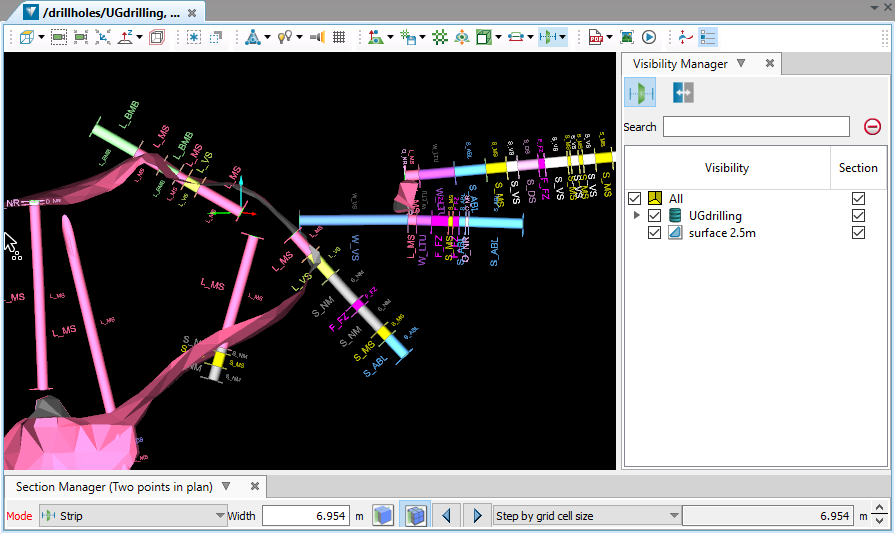
The view toolbar contains options and tools that affect how the data appears in the view. Some tools are docked within the view window when they are shown, such as the Visibility Editor (V) and the Section Manager (Shift + /).
Learn the basics of view windows in the next topic.
-
The report window displays summaries of operations that have been performed, including warnings and errors. The reports are interactive—objects referenced in the report window can be selected by clicking on them, similar to the project explorer. Files referenced can also be clicked on to show them in a Windows file explorer, or double-clicked to open them inside the application.
-
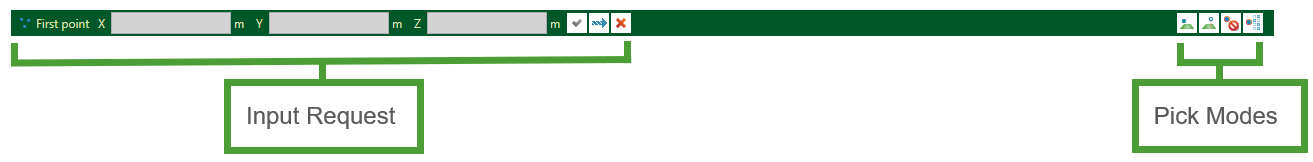
The status bar displays input requests (usually point requests) for certain operations. The pick mode tool buttons appear on the right-hand side of the status bar when point pick requests are made.