Data Extent
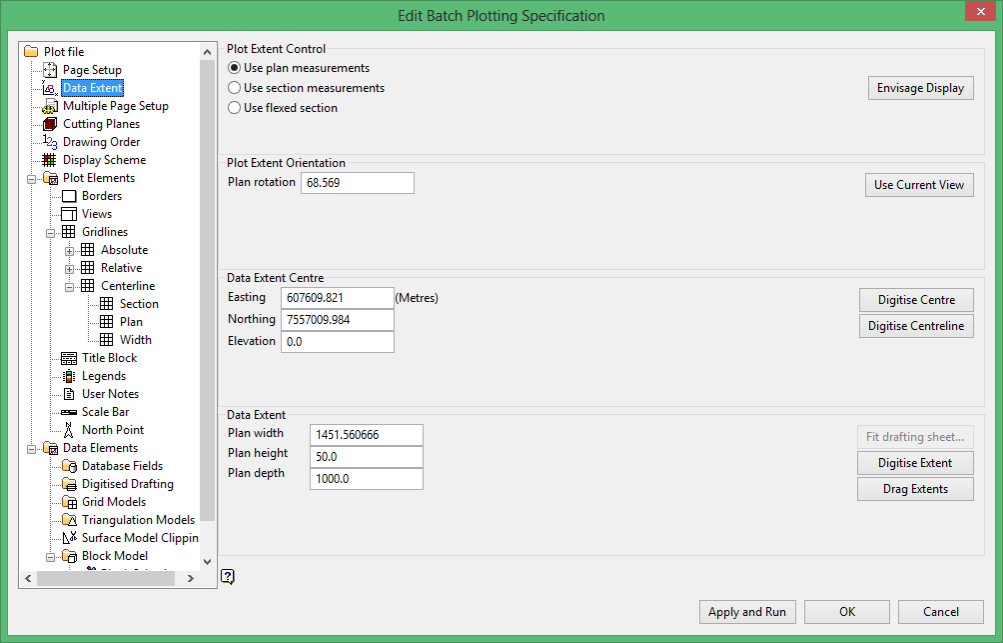
Use this section to specify the extents of the data. You can choose to use plan measurements, section measurements or to use a flexed section. You can also choose to display the extents graphically.
- Use plan measurements
Select this option to use plan measurements to specify your data extents. - Use section measurements
Select this option to use section measurements to specify your data extents. - Use flexed section
Select this option to include a flexed section in the plot. - Vulcan Display
Select this button to alter the graphical display attributes of the extents.
Use Plan/Section Measurements
Use plan measurements options
Use section measurements options
The Use plan measurements options refer to the extents in terms of plan width, height and depth. Whereas the Use section measurements options refer to the extents in terms of section length, width and height. However, the way that the extents are specified is the same for both views.

Dimensions for Plan View
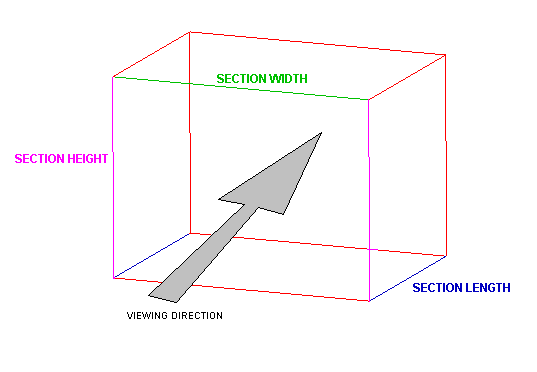
Dimensions for Section View
It is possible to specify your extents by digitising the centreline, by digitising a rectangle or by fitting to a drafting sheet (this is only available if you have specified the page size by drafting sheet - refer to Page Setup ).
It is possible to set the plot orientation by digitising the centre line or by entering angles into the Plot Extent Orientation field.
Note: When using plan measurements and a drafting sheet, BP_VIEW_1 is the plan box and BP_VIEW_2 is the section box. However, when using section measurements these rectangles are reversed, that is, BP_VIEW_1 is the section box and BP_VIEW_2 is the plan box.
Centreline
To digitise a centre line:
- Select the Digitise Centreline button.
- Digitise the first point of the centreline. If you want north to be at the top of the plot, then digitise from the left to the right.
- Digitise the second point of the centreline.
Once you have digitised the centreline, the displayed extents will be updated automatically. If the extents are not displayed, then select the Vulcan Display button and check the Display extents in underlay check box
Alter the values (found under the Data Extent section of the panel) to change the size of the data extents.
If you want to maintain the orientation of the plot, but alter the centre of the plot, then select the Digitise Centre button. You can then use one of the snap modes to place accurately the centre of the plot. You can also use the Drag Extents button to move the data extents.
Rectangle
To digitise a rectangle:
- Select the Digitise Extent button.
- Indicate the lower left hand corner of the plot.
- Indicate the upper right hand corner of the plot.
Once you have digitised the rectangle, the displayed extents will be updated automatically. If the extents are not displayed, then select the Vulcan Display button and check the Display extents in underlay check box.
Alter the values (found under the Data Extent section of the panel) to change the size of the data extents.
You can use the Drag Extent button to move the extents to another position or use the Digitise Centre button to digitise the centre of the plot and thus move the extents.
Drafting Sheet
If you chose to specify your page size by a drafting sheet, then you can specify your extents by fitting to the drafting sheet.
To fit to a drafting sheet:
- Select the Fit drafting sheet button. Once selected, the Apply Scales panel displays.
This panel informs you of the drafting sheet being used and the size of the section, plan and width boxes.
- To change the area that the extents cover, alter the Horizontal and Vertical scales. The scale can be entered with or without a ratio, that is a ratio scale of 1:1200 is equivalent to a scale of 100 (1 inch on the plot equals 100 feet on the ground) when inches are used as a plotting unit. The extents are not updated until you select the Apply Scale buttons.
You can use the Drag Extents button to change the position of the extents or use the Digitise Centre button to digitise the centre of the plot and thus move the extents.
You can set the orientation of the plot by digitising the centreline or by changing the angle in the Plot Extent Orientation field. An angle of 0° represents an unrotated plan or section view. If you have rotated the view, but are not sure of the angle of rotation, then use the Use Current view button. When using section measurements you can also specify the Section Dip, an angle of 90° represents a section perpendicular to the plan view. To plot an oblique section, enter an angle between 0° and 90°. Note the Use Current View button will set the strike and dip to the current view values.
Used Flexed Section
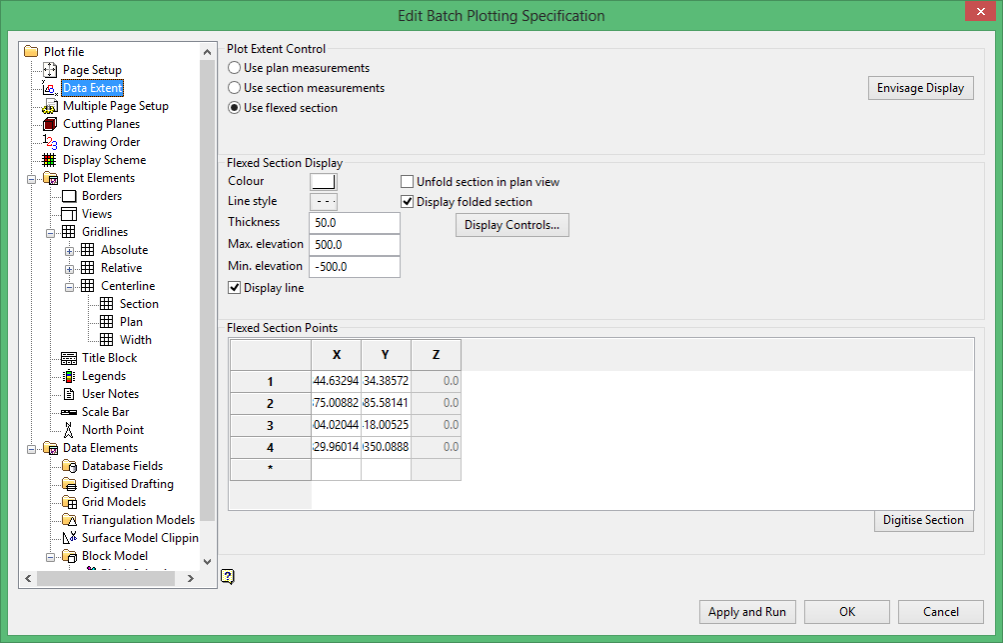
You can only use a flexed section if you have chosen to specify the page size by data extent and scale. Refer to Page Setup .
The Flexed Section panel displays when you choose to use a flexed section (a flexed section is also referred to as a long section). This section is split into two subsections, Flexed Section Display and Flexed Section Points. This section to specify the display parameters for the flexed section and the coordinates of the flexed section, that is the coordinates of the starting and end points of the section line (which is the centre line of the extents) and the coordinates of each inflection point.
Flexed Section Display
Colour
Select the colour for the section.
Line Style
Select the line style for the section
Thickness
Enter the thickness for the section. Refer to if you're unsure of the section dimensions.
Max. elevation
Enter the maximum elevation for the section.
Min. Elevation
Enter the minimum elevation for the section. The difference between the minimum and maximum elevation is the height of the section.
Display line
If this check box is selected, the fence will display in the section view plot. Clear this check box if you want to disable the fence display.
Unfold section in plan view
Tip: To observe the effect of changing the minimum and maximum elevation values, chose to display the extents.
Select this check box to have the different segments of the flexed section displayed side by side in the plan view.
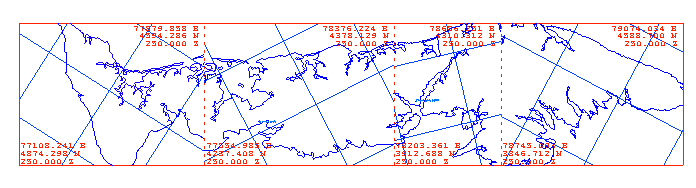
Unfolded section

Folded Section
Display folded section
Select this check box to display the section extents on the plan view.
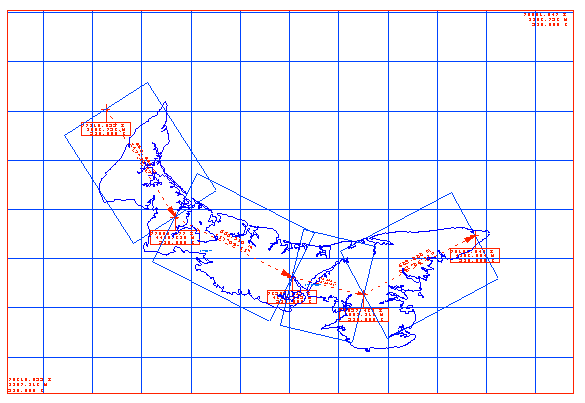
Folded Section with extents displayed
To alter the attributes of the display, select the Display Controls button. Once selected, the Flexed Section Display Control panel is displayed.
Check the items that you want to display and the graphics attributes for these items.
Flexed Section Points
You can choose to enter manually the coordinates of the inflection points of the flexed section or digitise the flexed section, in which case the fields in this part of the panel are updated dynamically.
To enter the points manually, click in the cell and enter the coordinate value.
To digitise the section, select the Digitise Section button. You can use any of the snap modes to digitise accurately the placement of the flexed section.
Vulcan Display
To alter the graphical display of the data extents, select the Vulcan Display button. Once selected, the Vulcan Underlay Display panel displays.
Choose whether or not to display the extents as an underlay.
Related topics

