User InterfaceSource file: user-interface.htm |
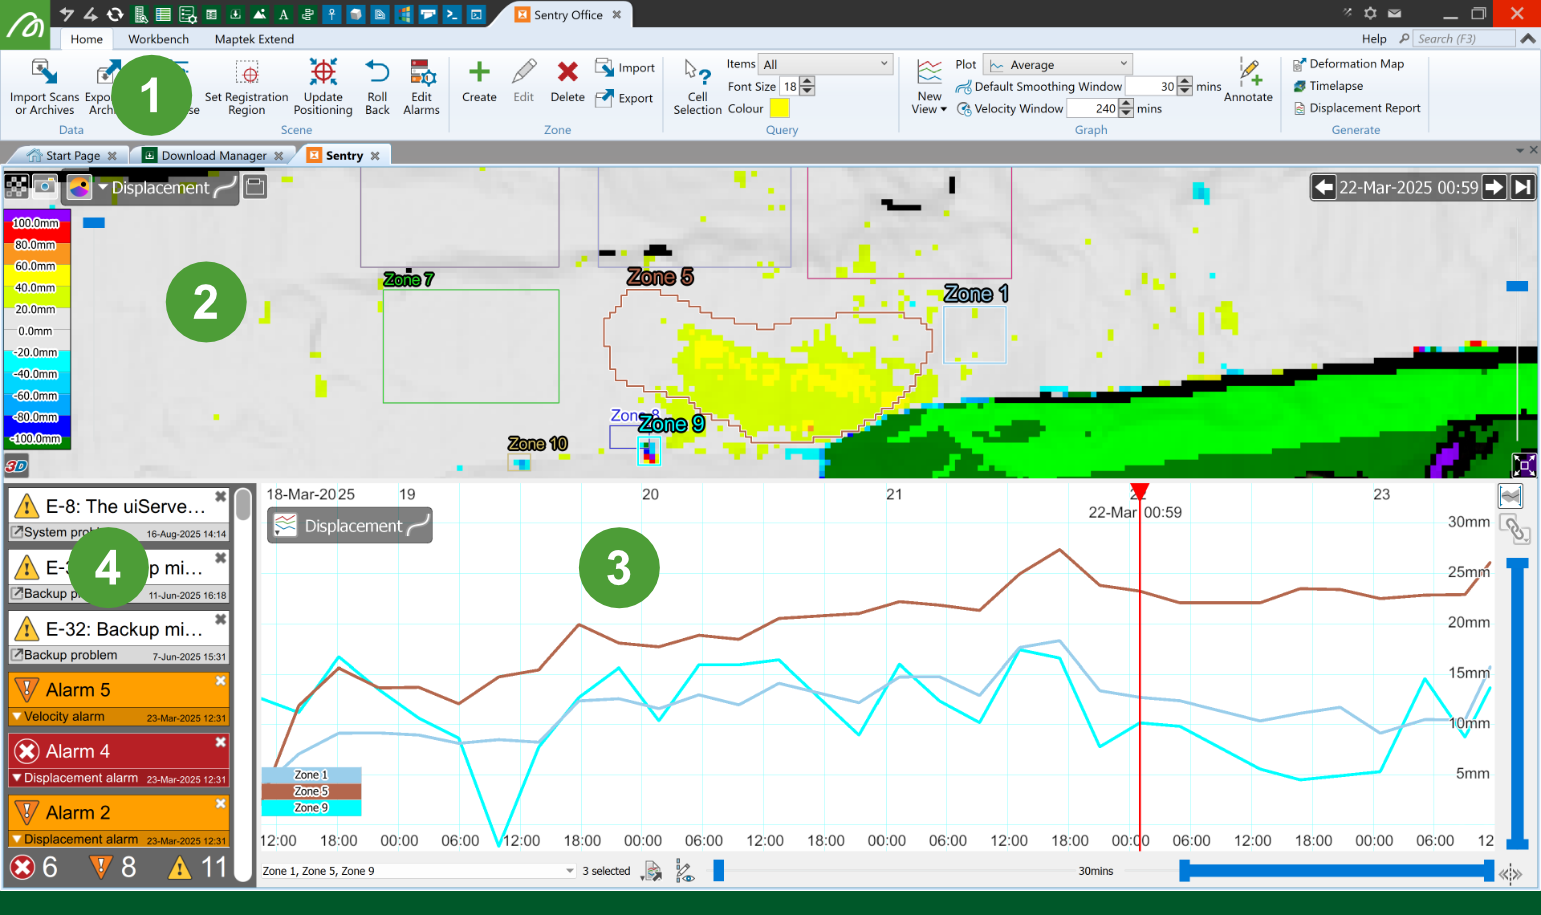
The Sentry Office user interface consists of a ribbon menu and a dashboard with three main components.
|
|
Sentry Office ribbon menu Provides quick access to Sentry tools and settings. |
|
|
Scene viewer Displays an image of the scanned area overlaid with zones of interest and heatmaps indicating movement. |
|
|
Graph view Displays various types of graphs. |
|
|
Event list Displays events and alarms as they are triggered. |


Ribbon menu

The following tools are located on the Sentry Office ribbon. Follow the
|
|
Import Scans or Archives |
|
|
Export to Archive |
|
|
Filters and Base |
|
|
Set Registration Region |
|
|
Update Positioning |
|
|
Roll Back |
|
|
Edit Alarm |
|
|
Create |
|
|
Edit |
|
|
Delete |
|
|
Import |
|
|
Export |
|
|
Cell Selection |
|
|
New View |
|
|
Plot |
|
|
Default Smoothing Window |
|
|
Velocity Window |
|
|
Annotate |
|
|
Deformation Map |
|
|
Timelapse |
|
|
Displacement Report |
Scene viewer
The scene viewer displays the scanned area, highlighting detected movement of surfaces.
|
|
|
Overview of the dashboard scene view with its controls |
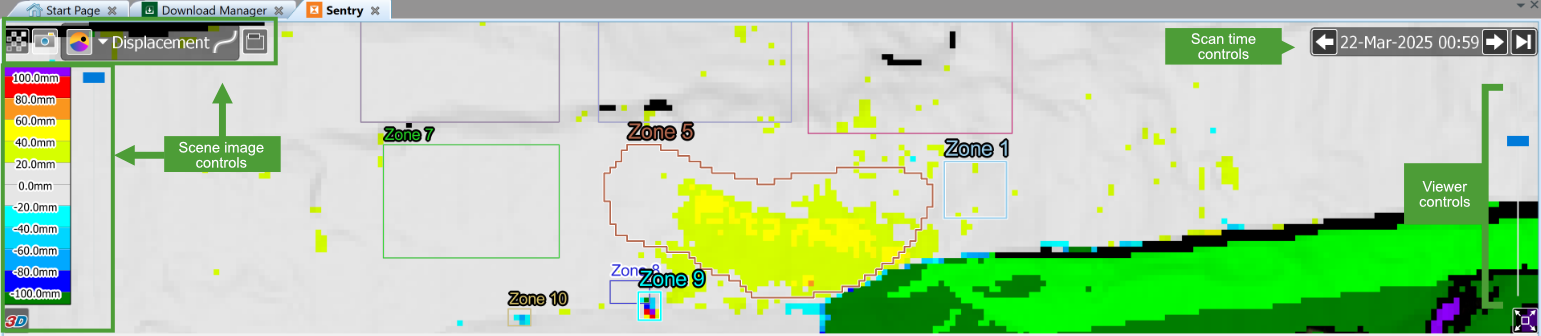
The scene viewer includes the following controls:
-
Scan time controls determine which scan is displayed.
-
Scene image controls adjust what is shown in the scene viewer.
-
Viewer controls adjust the size and zoom level of the scene viewer.
See also: Viewing > Scene viewer actions for more information.
Dashboard graph view
The dashboard graph view is the main graph view that appears below the scene viewer. Its main purpose is to display trends in a measured property over time for selected zones. The dashboard graph view also indicates zone events.
|
|
|
Overview of the dashboard graph view with its controls |
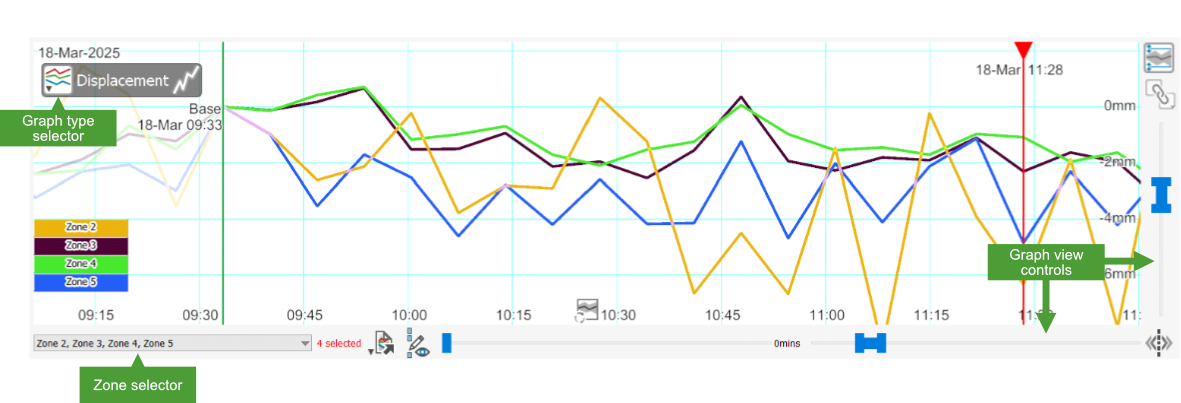
The graph view includes the following controls:
-
Graph type selector: Select the measured property displayed on the graph from the drop-down list.
-
Zone selector: Select the zones to display in zone-based graphs.
-
Graph view controls: Manipulate the graph view.
See also: Introduction to Graphs for more information about graphs.
Event list
The event list shows events generated by the Sentry system. The list is sorted in descending order of time. That is, the most recent event appears at the top of the list.
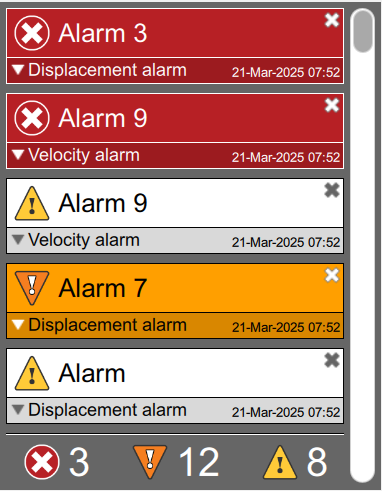
Events are categorised into three priority levels: high ![]() , medium
, medium ![]() , and low
, and low ![]() . The total number of events for each level is summarised by the event counters under the events list.
. The total number of events for each level is summarised by the event counters under the events list.
Events can be either system events or monitoring events.
See also: Alarms and Events for more a detailed explanation of events and alarms.
