Scan points, cells and zones
Source file: scan-points-cells-and-zones.htm
To appreciate what and how Sentry measures, it is helpful to have an understanding of how a laser scanner functions. The scanner uses laser pulses to measure an area and create a 3D point cloud to represent the scene.
|
|
|
Distances are measured along laser paths, according to the time taken for reflections to return to the scanner. |

Each laser pulse may include multiple returns from intermediate targets such as trees, dust, and precipitation. Depending on the scanner used, the system may be programmed to accept the first, last, or best (strongest) signal as the preferred reading. Choose last if scanning in rain or a dusty environment to exclude erroneous points. See Point return.

|
|
|
The laser beam diameter increases the further it travels from the scanner. |

Cells
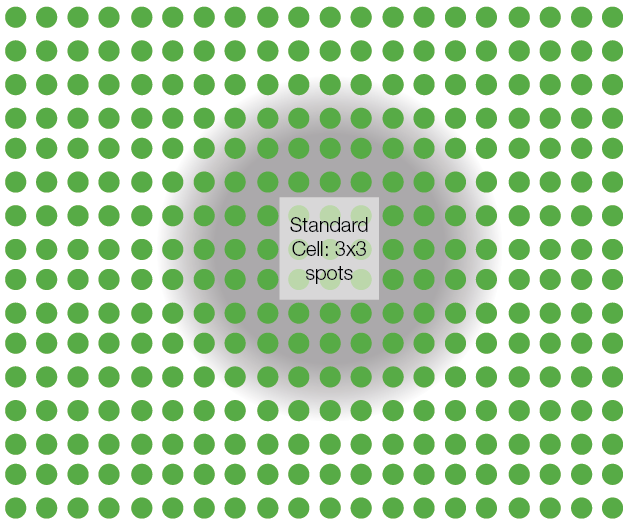
Cells are reference areas formed from either 3x3 (standard) or 2x2 (smallest) grids of points on the target surface to form a cell.
Sentry averages individual scan point ranges in and around a cell with a diminishing weighting applied to points further from the cell centre. This enables Sentry to determine the nominal distance between a cell and the scanner, and the orientation of a cell relative to the scanner. These results are used to filter out inaccurate cells.
|
|
|
A 3x3 cell and surrounding scan points used to determine distance and orientation. The weighting of scan point properties is represented by the intensity of the grey region. |
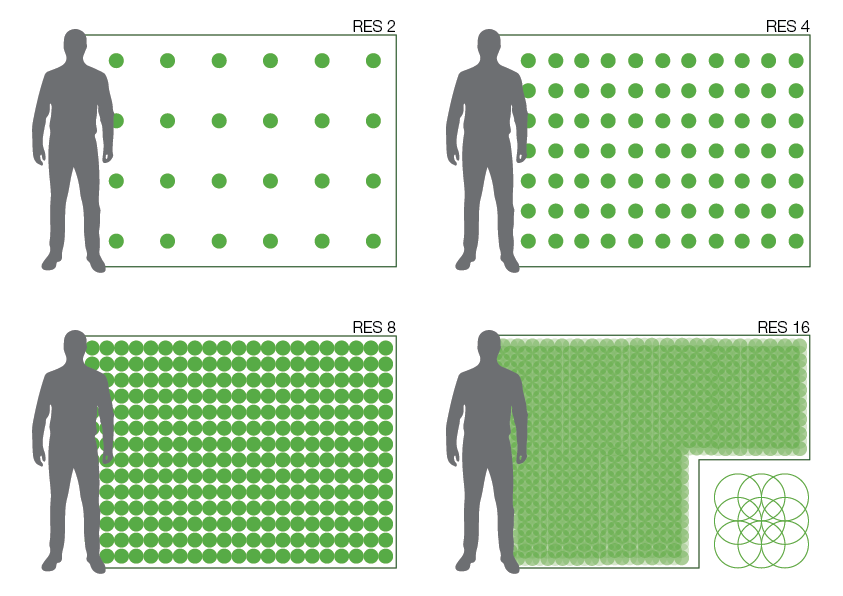
Because a laser beam diverges with distance, the physical area that a cell covers depends on the distance of the target surface from the scanner. Thus, models of more distant surfaces might not contain sufficient detail. This can be compensated for by adjusting the scanner resolution. Available resolution levels, depending on the scanner model, are 1 (minimum), 2, 4, 8, and 16 (maximum), each having four times (that is, double in each direction) the point density of the next lower level. Point densities are also affected by range: the further the target surface is from the scanner, the more sparse are the points.
|
|
|
Point densities at different resolutions at 250 m range. |
|
|
|
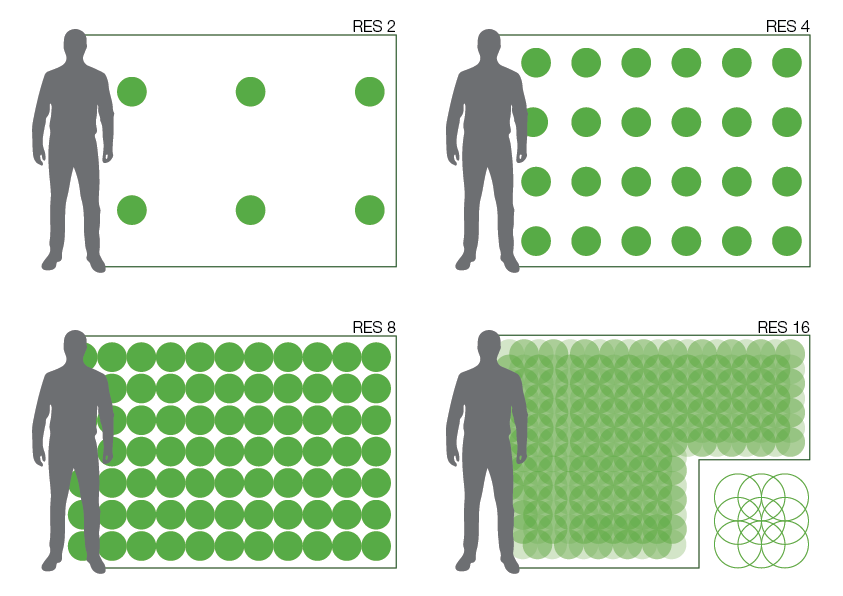
Point densities at different resolutions at 500 m range. |
The result is that cell size and shape are influenced by factors including distance, position, and angle on a rock face, and resolution setting. Therefore, careful consideration is needed in determining which cells will provide dependable and consistent data. Sentry uses various methods to filter, analyse, and compare cells. Distance from the scanner is used as a base measurement to derive other properties such as velocity and inverse velocity.
Sentry zones
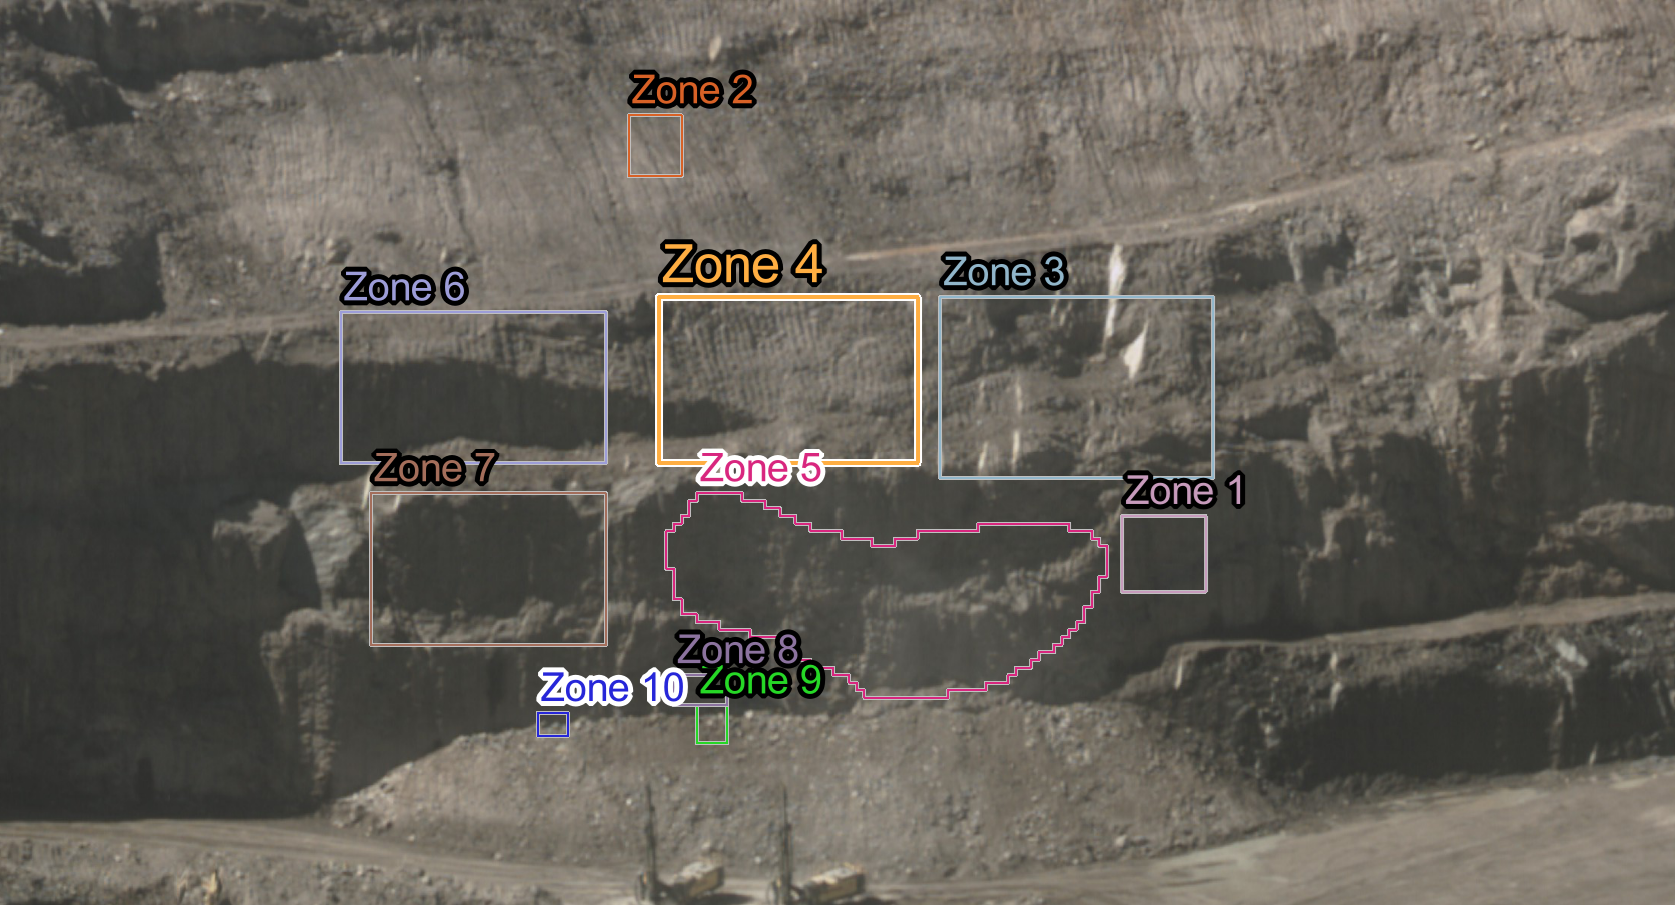
While cells form the basic unit of observation, the operator defines zones of interest (referred to in Sentry simply as zones) through the user interface. Zones help to identify critical areas for cell analysis. You can define zones to include only the relevant areas to analyse and exclude others of less importance. You can graph displacement and velocity for each zone and apply alarms to zones to identify problems.
|
|
|
View of a pit showing zones targeting critical areas for monitoring. |
|
|
|
Close up image showing typical zones and cells. |

|
|
|
Detailed close up showing the relationship between cells (in colour) and scanner beam spots (greyscale, representing intensity values). |
