Popout graph views
Source file: popout-graph-views.htm
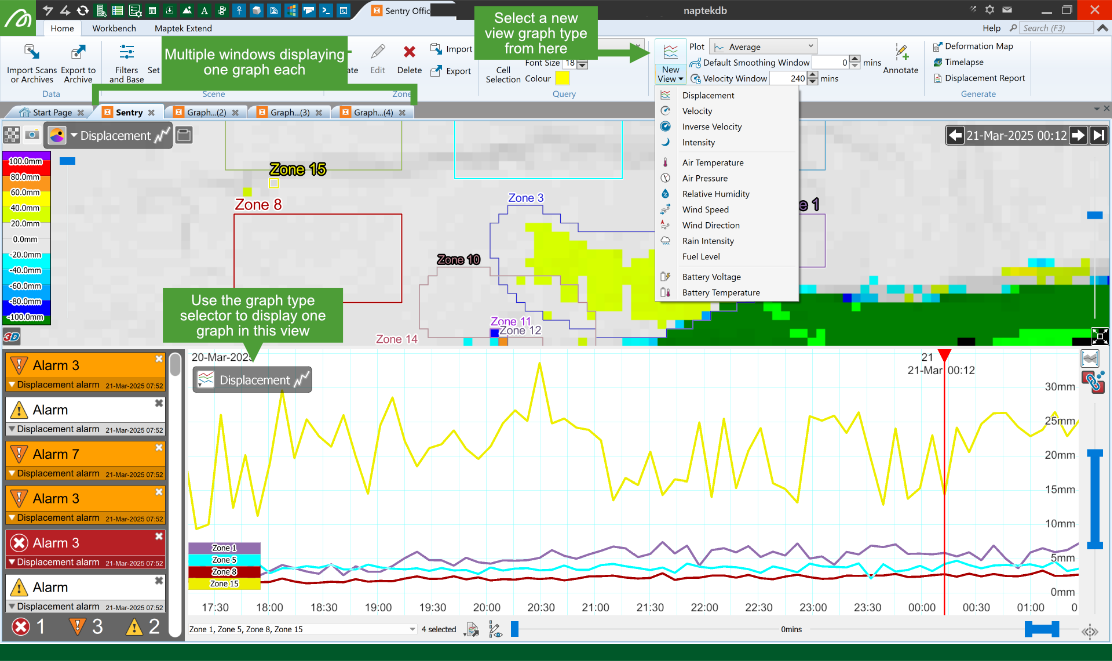
Popout graph views are additional graph views that plot data on a selection of zones independent of the zones selected in the dashboard or scene viewer. A popout graph view has similar controls to the dashboard graph view. See Interacting with graph views for more information.
Popping out graphs
-
To pop out a new graph, on the Home ribbon tab, from the Graph group, select the required graph type from the New View drop-down menu. A new graph view will open.
You can disengage a view window containing a graph and move to another screen position, or different monitor.
-
To reposition a graph view, drag the view by the window tab to the new position.
-
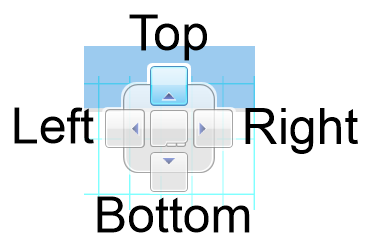
To reposition on the current screen, drag the window to put the cursor over the docking targets, which will appear while dragging is in progress. By dropping the cursor over the top, right, bottom, left, or centre square, the window will be placed in the corresponding position of the interface.
If there are more graphs created than the screen can display, on the far right, click on the down-facing arrow to reveal a list of all open windows and either select the required Graph of Scene (#), or close a graph by clicking ![]() to the right of its name.
to the right of its name.

Tying graphs together
By default, popout graphs will be tied to all other graphs. This means that when one graph is manipulated, the other graphs will be manipulated synchronously.
Tip: Press Ctrl+B to tile the graph windows for side-by-side comparison.
The tie button to the right of the graph view has different icons depending on the tie state of the graph, as follows:
|
|
The graph is tied to other graphs that are also displaying this icon. Click the button in this state to untie the graph. |
|
|
There is only one graph view open (the dashboard graph). There are no other graphs to tie to. |
|
|
The graph view is not tied to any other graph. When this graph view is manipulated, other open graphs are unaffected. Click the button in this state to tie that graph to all other graphs displaying the tied icon |
|
|
|
Example of multiple graphs displaying information about zone 1. Smoothing Window was set to 30 minutes. These graphs were tiled and tied together. |

