Interacting with graph views
Source file: interacting-with-graph-views.htm
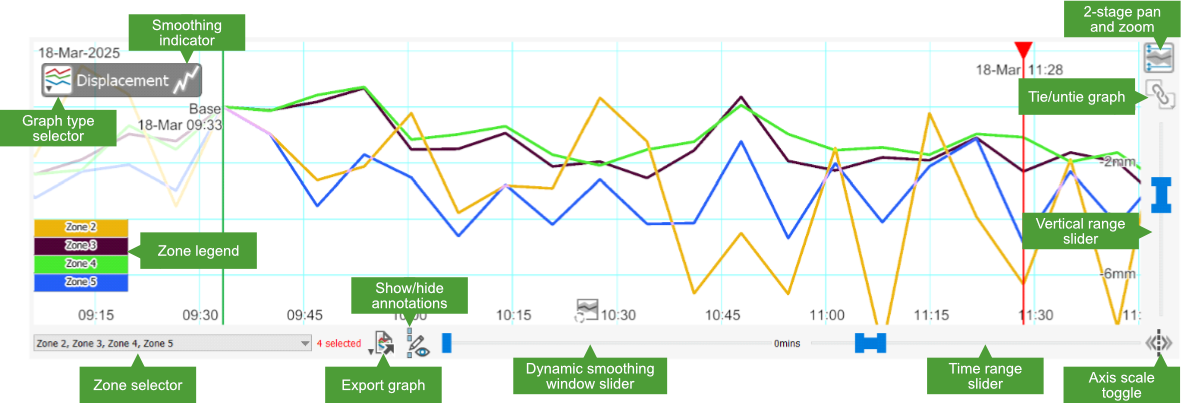
A graph view is a window onto a portion of the graph data. The amount of data shown in a graph view window can be controlled in both the horizontal (or time) and vertical axes.
|
|
|
A graph view indicating components and user controls |
Time axis
The time axis is the horizontal axis of the graph, representing the span of time between the first and the most recent scan in the scene.
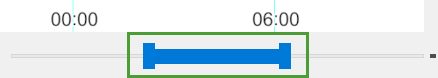
Use the horizontal range slider located below the graph to control the amount of data shown in the window along the time axis.
-
Drag the left or right slider handle to define the start time or end time of the window, respectively.
-
Drag the span between the slider handles to pan the window along the time axis.
-
Double-click the span between the slider handles to toggle between showing the total time period and the previously displayed time period.
Vertical axis
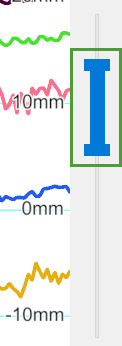
The vertical axis displays the dependent variable of the graph, per the selected graph type.
Use the vertical range slider located to the right of the graph to control the amount of data shown in the window along the vertical axis.
|
|
|
Panning
You can pan the data shown in the graph window by either of the following methods:
-
Dragging the graph area.
-
Dragging the middle of a range slider.
Axis scaling (zooming)
Zooming using mouse operations directly on the graph effectively scales the graph data along a single axis within the view. Zoom behaviour depends on the state of the scale axis toggle button (![]() or
or ![]() ), located to the bottom right of the graph view, and the location of the mouse cursor in the view.
), located to the bottom right of the graph view, and the location of the mouse cursor in the view.
To scale the graph data:
-
Make sure the scale axis toggle button is set to the desired axis:
-
 for horizontal axis scaling
 -
 for vertical axis scaling
Tip: Hold down Alt to swap the axis being scaled temporarily.
-
-
Position the mouse in the graph.
-
Right-click and drag to smoothly scale the data. Alternatively, use the scroll wheel to scale the data in discrete amounts.
Scaling will occur around the location of the mouse cursor. This location is indicated by a temporary dashed line across the graph view when the right mouse button is clicked or the mouse wheel is scrolled.
Tip: You can also zoom on an axis by dragging that axis. Hover over the axis so that the cursor changes to ![]() , then drag in the required direction.
, then drag in the required direction.
|
|
|
Vertical dashed line appears while scrolling a single graph horizontally |
|
|
|
Horizontal dashed line appears while scrolling a single graph vertically |
Automatic panning and scaling
After panning and zooming the data, it is often convenient to return the graph view window to the location of the time slider, or rescale the data to fit the window.
Click the automatic pan and scale button (![]() or
or ![]() ), located to the right of graph view, to automatically pan or scale the graph view. This one button has the following two functions:
), located to the right of graph view, to automatically pan or scale the graph view. This one button has the following two functions:
-
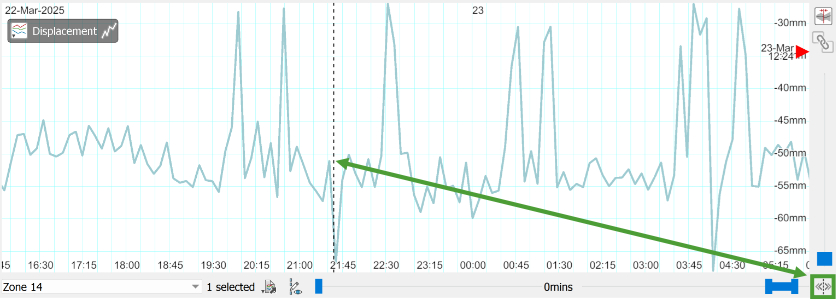
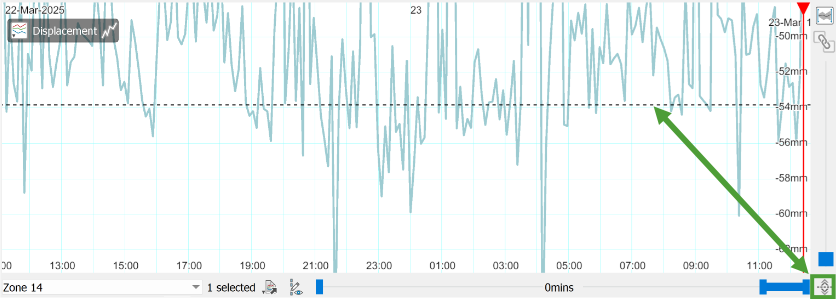
If the time slider is out of view, click the
 button to pan the graph, bringing the time slider just back into view, and centre the data vertically within the view. If the time slider is out of view, a red triangle on one side of the graph view indicates where the time slider is located.
 -
If the time slider is in view, click the
 button to scale the vertical axis such that all graph data within the current view will be visible.
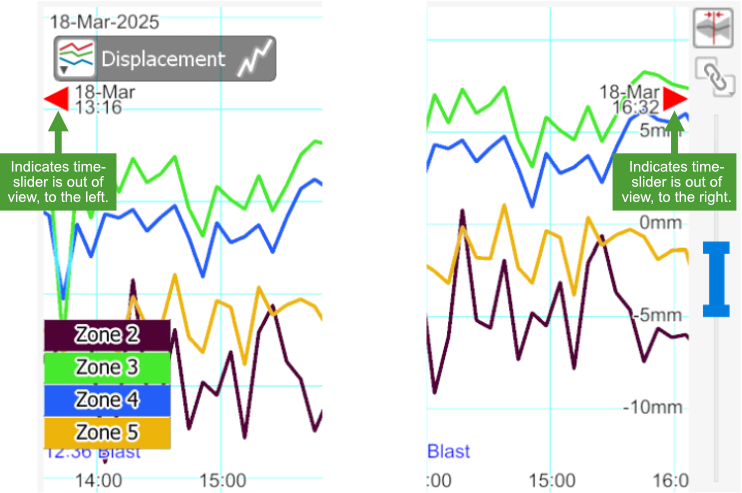
|
|
|
Graphs indicating time slider out of view |
Annotating graphs
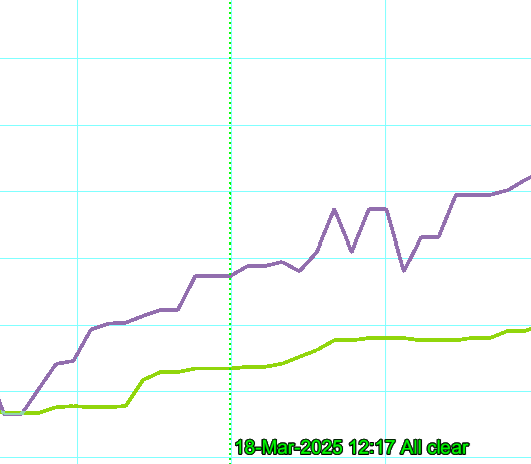
Use annotations to add remarks at a specific time within a graph. Annotations appear in the graph as dotted vertical lines with labels.
Creating annotations
To add an annotation:
-
Shift the red time slider to the position where the annotation is to be displayed.
-
 Annotate.
The Add Annotation dialog appears:
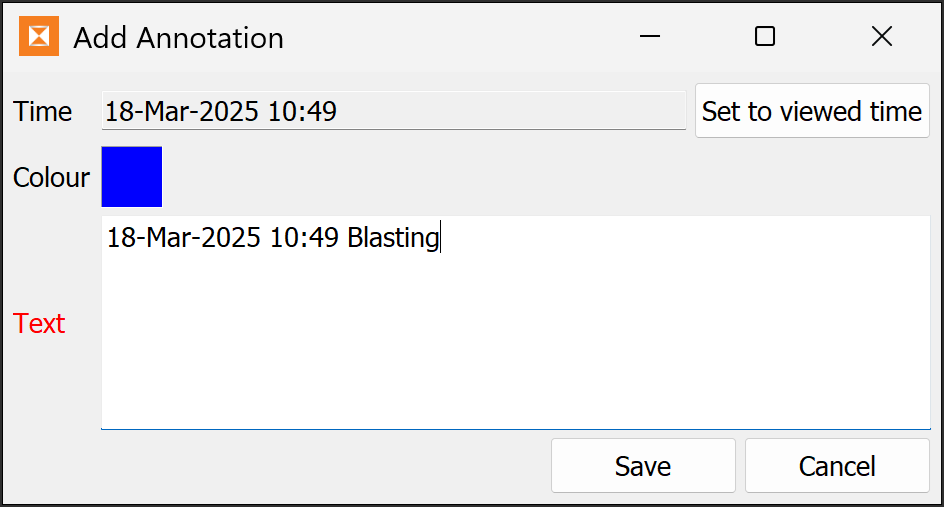
The Time field is automatically populated with the position of the time slider.
-
If you moved the time slider after opening the Add Annotation tool, click Set to viewed time to set the time for the annotation to the current position of the time slider.
-
Change the colour and text for the annotation as required.
-
Click Save.
Tip: To hide all annotations, click the ![]() button at the bottom of the graph viewer. To show them again, click the
button at the bottom of the graph viewer. To show them again, click the ![]() button.
button.
Editing or deleting annotations
To edit or delete an annotation:
-
Ensure the time slider is not at the same position as the annotation.
-
Move the cursor over the annotation’s dotted line until it widens:
-
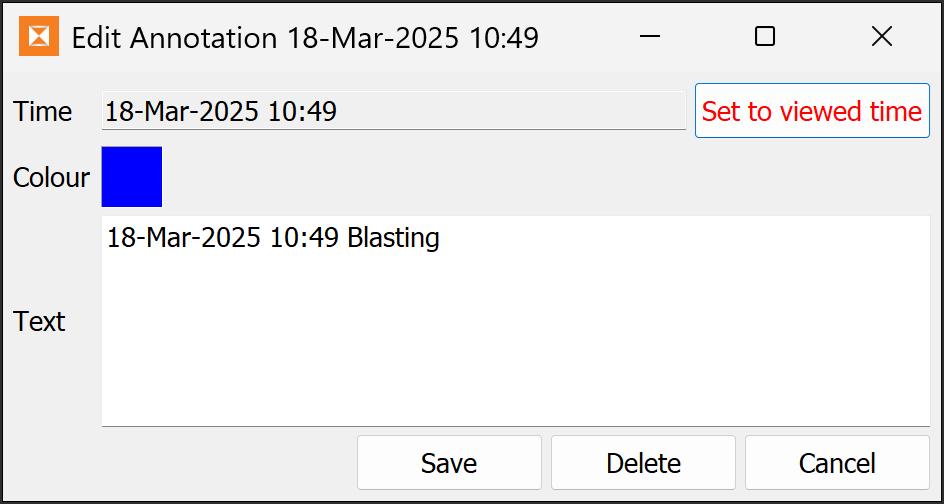
Double-click the line to open the Edit Annotation panel:
-
To change the time the annotation appears at, move the time slider in the graph to a new position, and click Set to viewed time.
-
Edit the colour or text if desired.
-
-
Click Save to save your changes, Delete to delete the annotation, or Cancel to exit without making any changes.
Zone cycling
Zone cycling displays the selected graph for all zones in the scene in sequence. The graph view will cycle through zones in order of creation. Turn zone cycling on or off in Preferences.
To turn on zone cycling:
-
 (Preferences) > Sentry Office Preferences.
 -
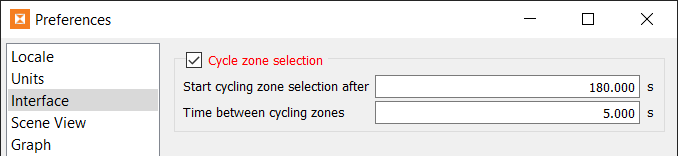
In the Interface tab, select the Cycle zone selection checkbox.
-
Configure the cycling settings:
-
Start cycling zone selection after: The wait time after a user interaction until the zone cycling begins.
-
Time between cycling zones: The time a zone is viewed in the graph before cycling to the next zone while cycling is active.
-
-
Click OK or Apply to save your settings.
An icon will appear to the left of the zone selector below the graph view indicating the cycling status:
|
|
Timer Waiting for the time out before cycling starts. |
|
|
Play Currently cycling zones. |
As soon as there is an interaction on the screen, keyboard button press or mouse click, cycling will pause and wait until Start cycling zone selection after time passes, and then continue. The icon will revert to ![]() while paused.
while paused.
