Viewing
Source file: viewing.htm
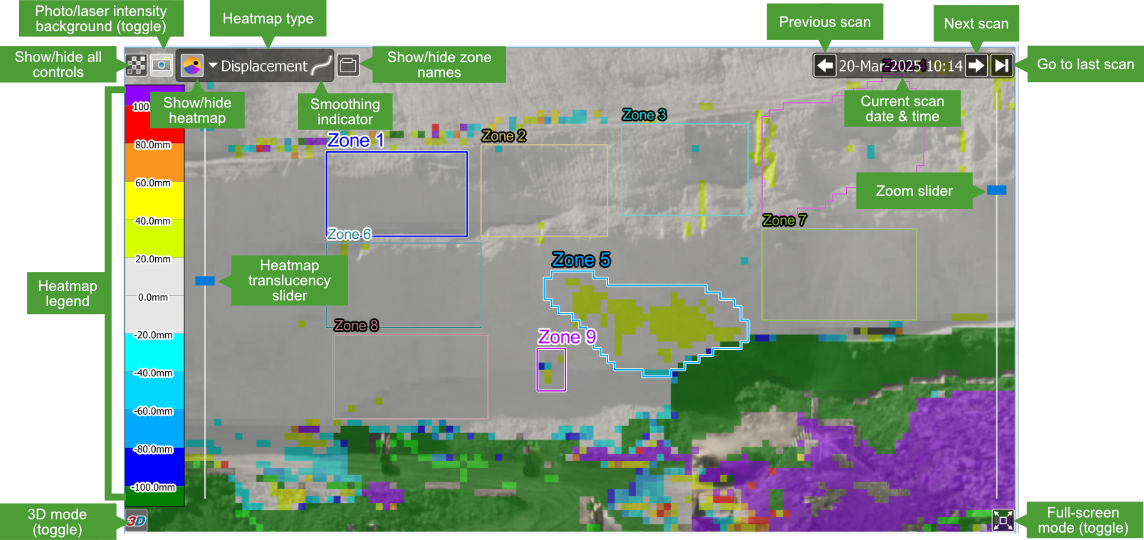
The scene viewer displays the scanned area overlaid with zones of interest and heatmaps indicating movement. The scene viewer can also display the photographic image captured by the scanner (provided the monitoring scanner was fitted with a camera).
The overlaid heatmap translucency is adjustable with the left vertical slider. With decreasing translucency, more of the underlying point cloud or image becomes visible.
|
|
|
Individual scene view controls |
Follow the instructions in this section for managing scene views.
Scene image
The scene image is a composite 2D image of the scan data at a given time. The scene image consists of the following main elements:
Background image
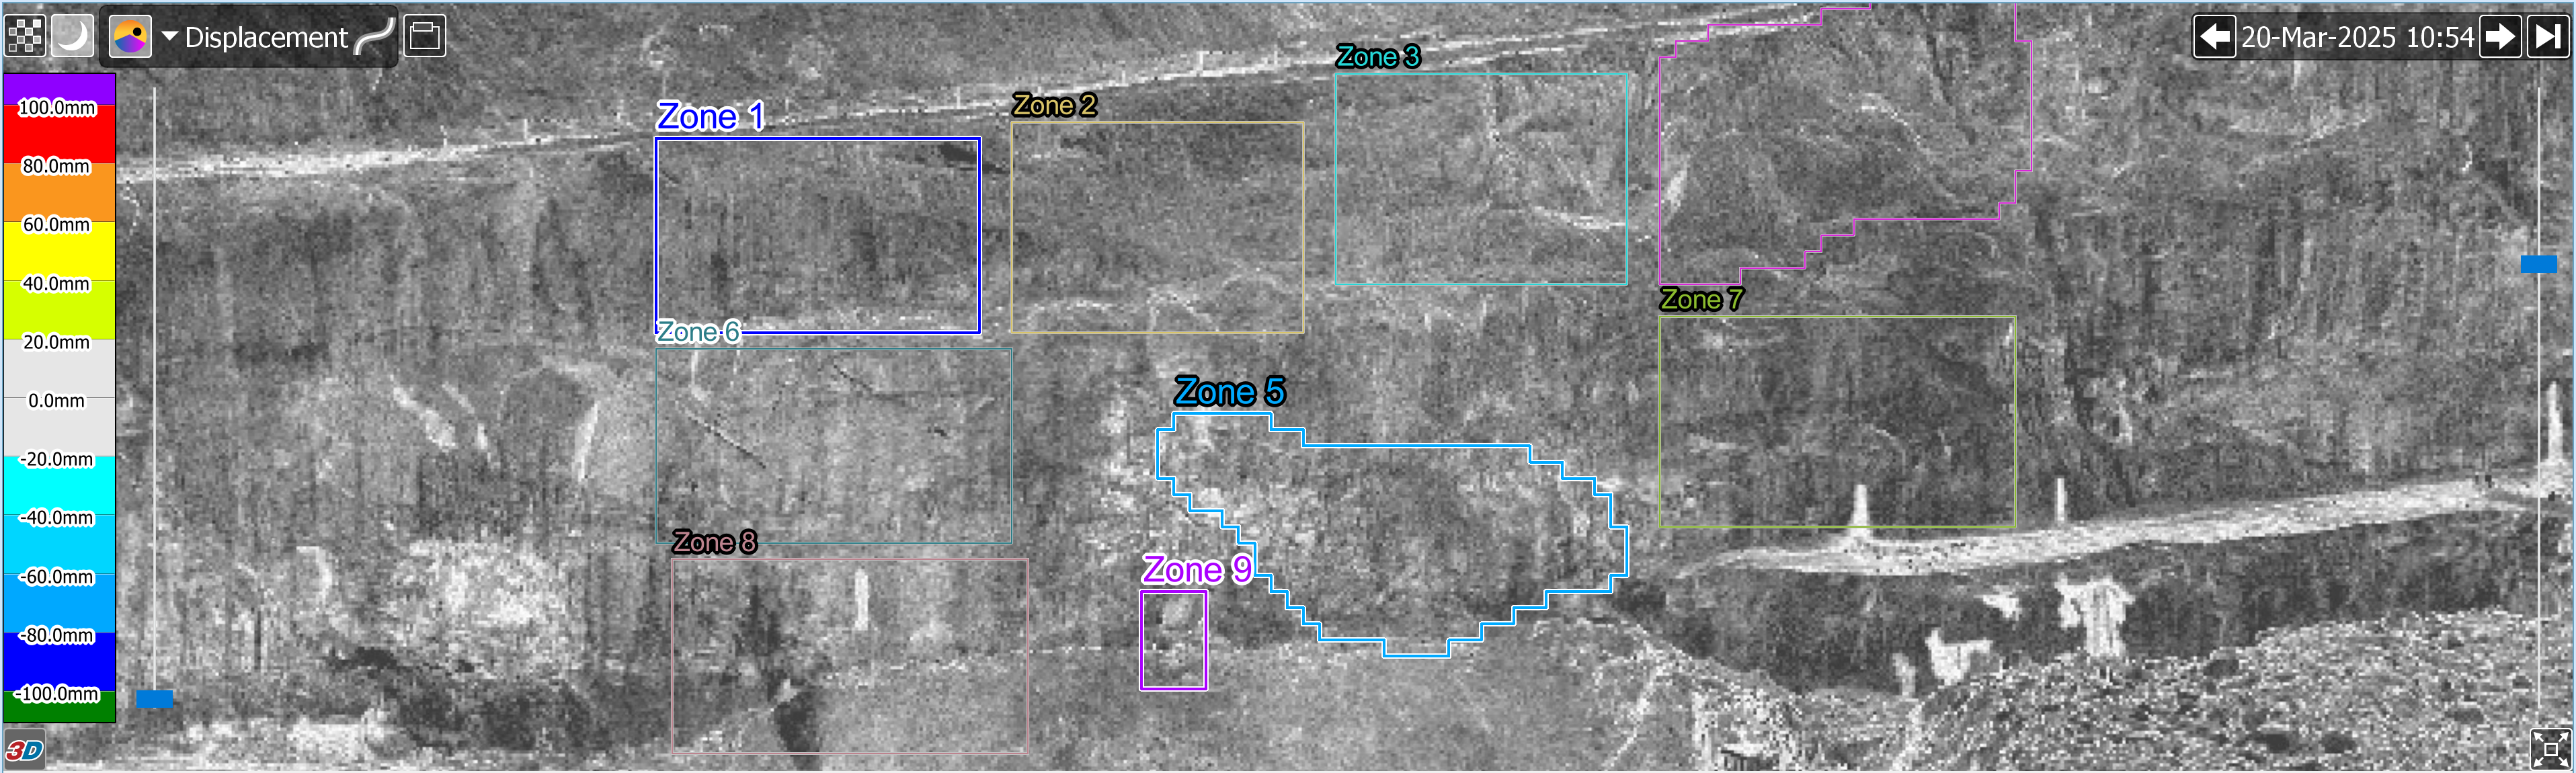
You can set the background image to show either photographic or laser intensity data from the scanner. The resolution of the background image is based on the scan resolution.
-
To change the background image type, click the photo/laser intensity toggle button (
 or
or  ), located in the top-left corner of the scene viewer. The button icon indicates the current background image type, either for photographic, or for laser intensity.
|
|
|
Photographic image |
|
|
|
Laser intensity image |
Heatmap
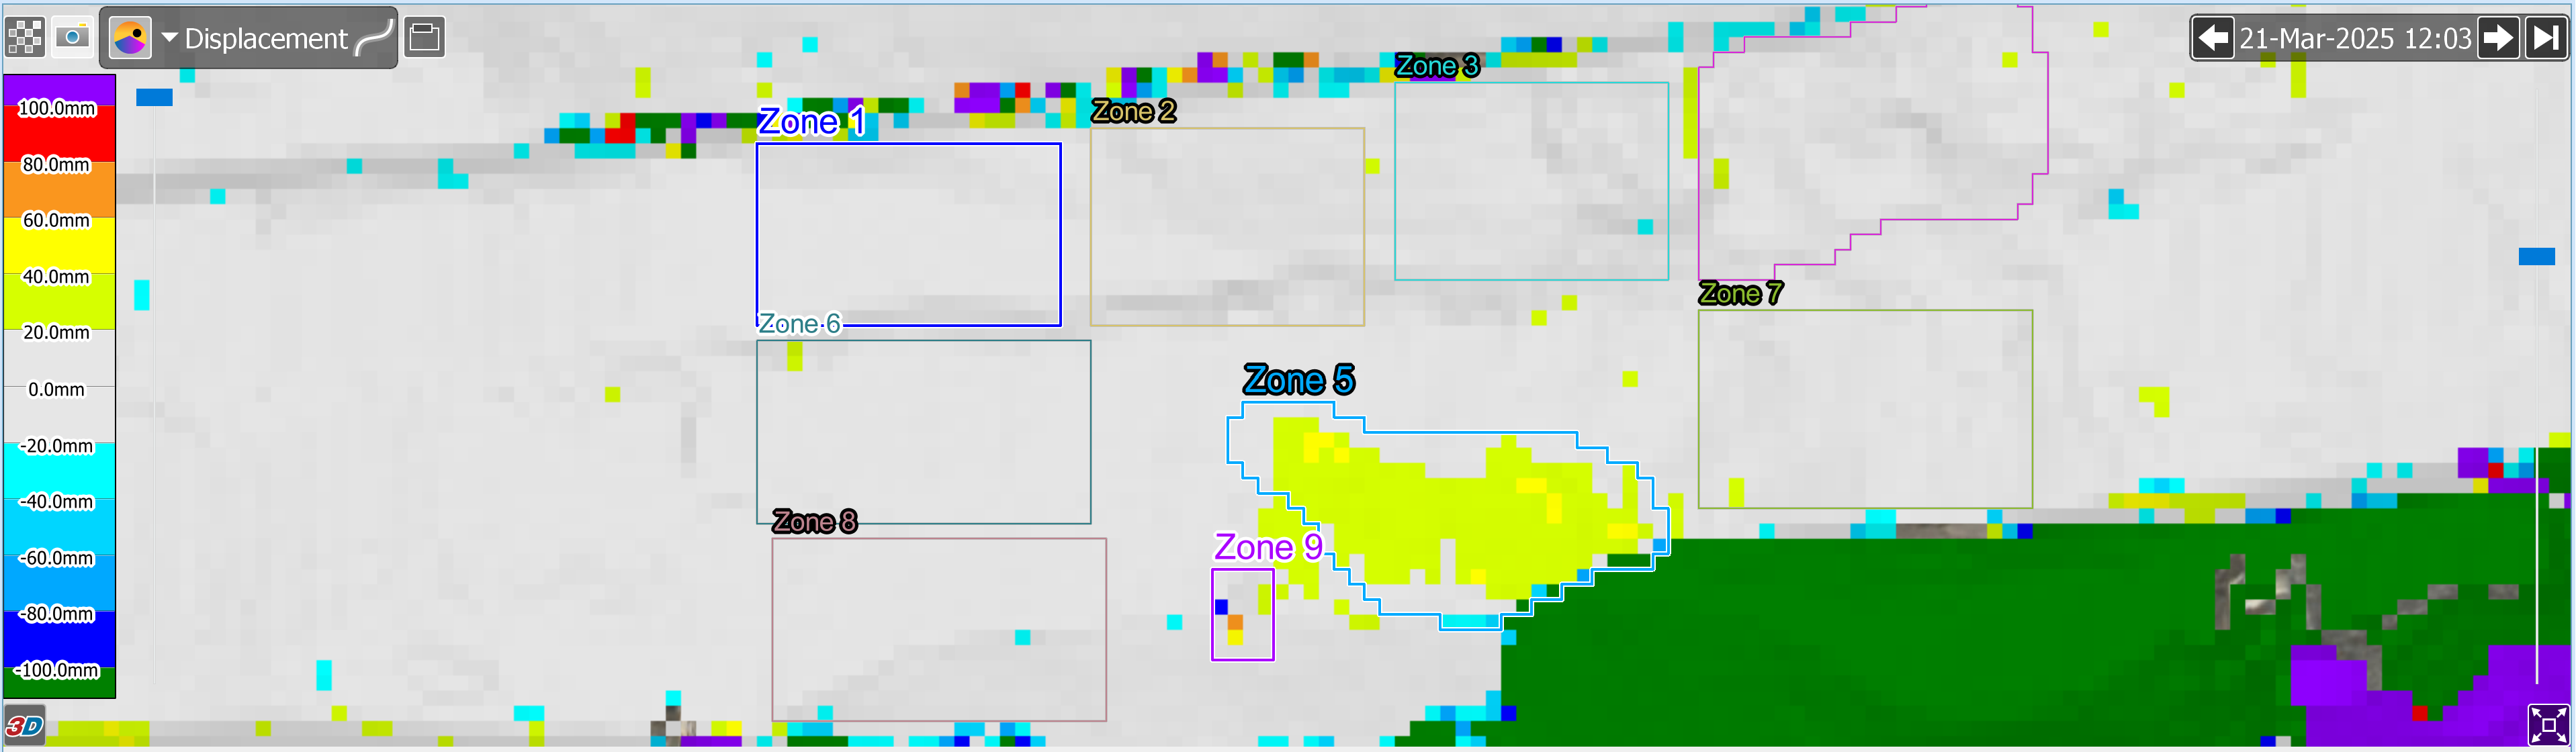
The heatmap shows the magnitude of displacement or velocity for each cell within the current scan relative to the measurement base.
|
|
|
A heatmap applied to a scene. The heatmap legend (on the left) shows the colour scheme. |
|
|
|
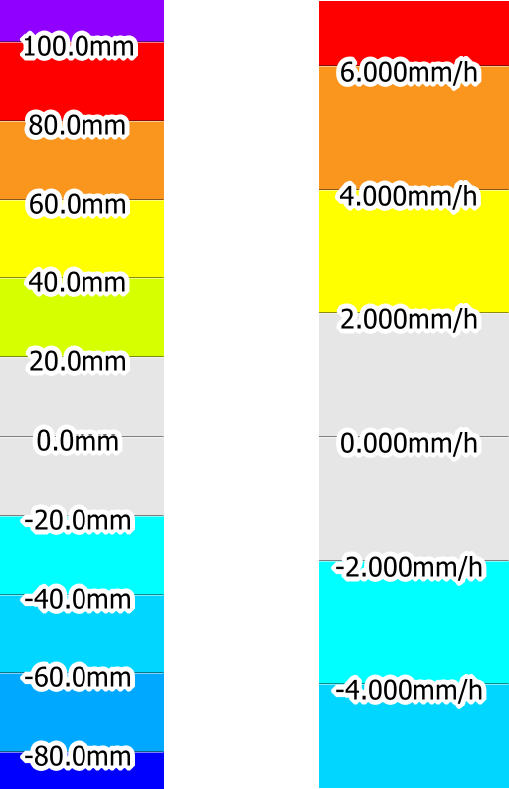
Heatmap legends for displacement (left) and velocity (right) |
You can control heatmap visualisation in the following ways:
-
Click the
 (Hide or show heatmap) button to show or hide the heatmap.
 -
Click the heatmap type selector drop-down
 button, located next to the button, to set the heatmap type.
 -
Use the heatmap translucency slider, located next to the heatmap legend, to make the heatmap more or less translucent.
See Preferences > Views for instructions on configuring the heatmap colour scheme.
Zones
Zones are indicated by frames drawn on the scene and either descriptive or numbered labels. See Configuring > Configuring zones for instructions on defining zones.
Scene viewer actions
Follow the instructions below to manipulate the scene view.
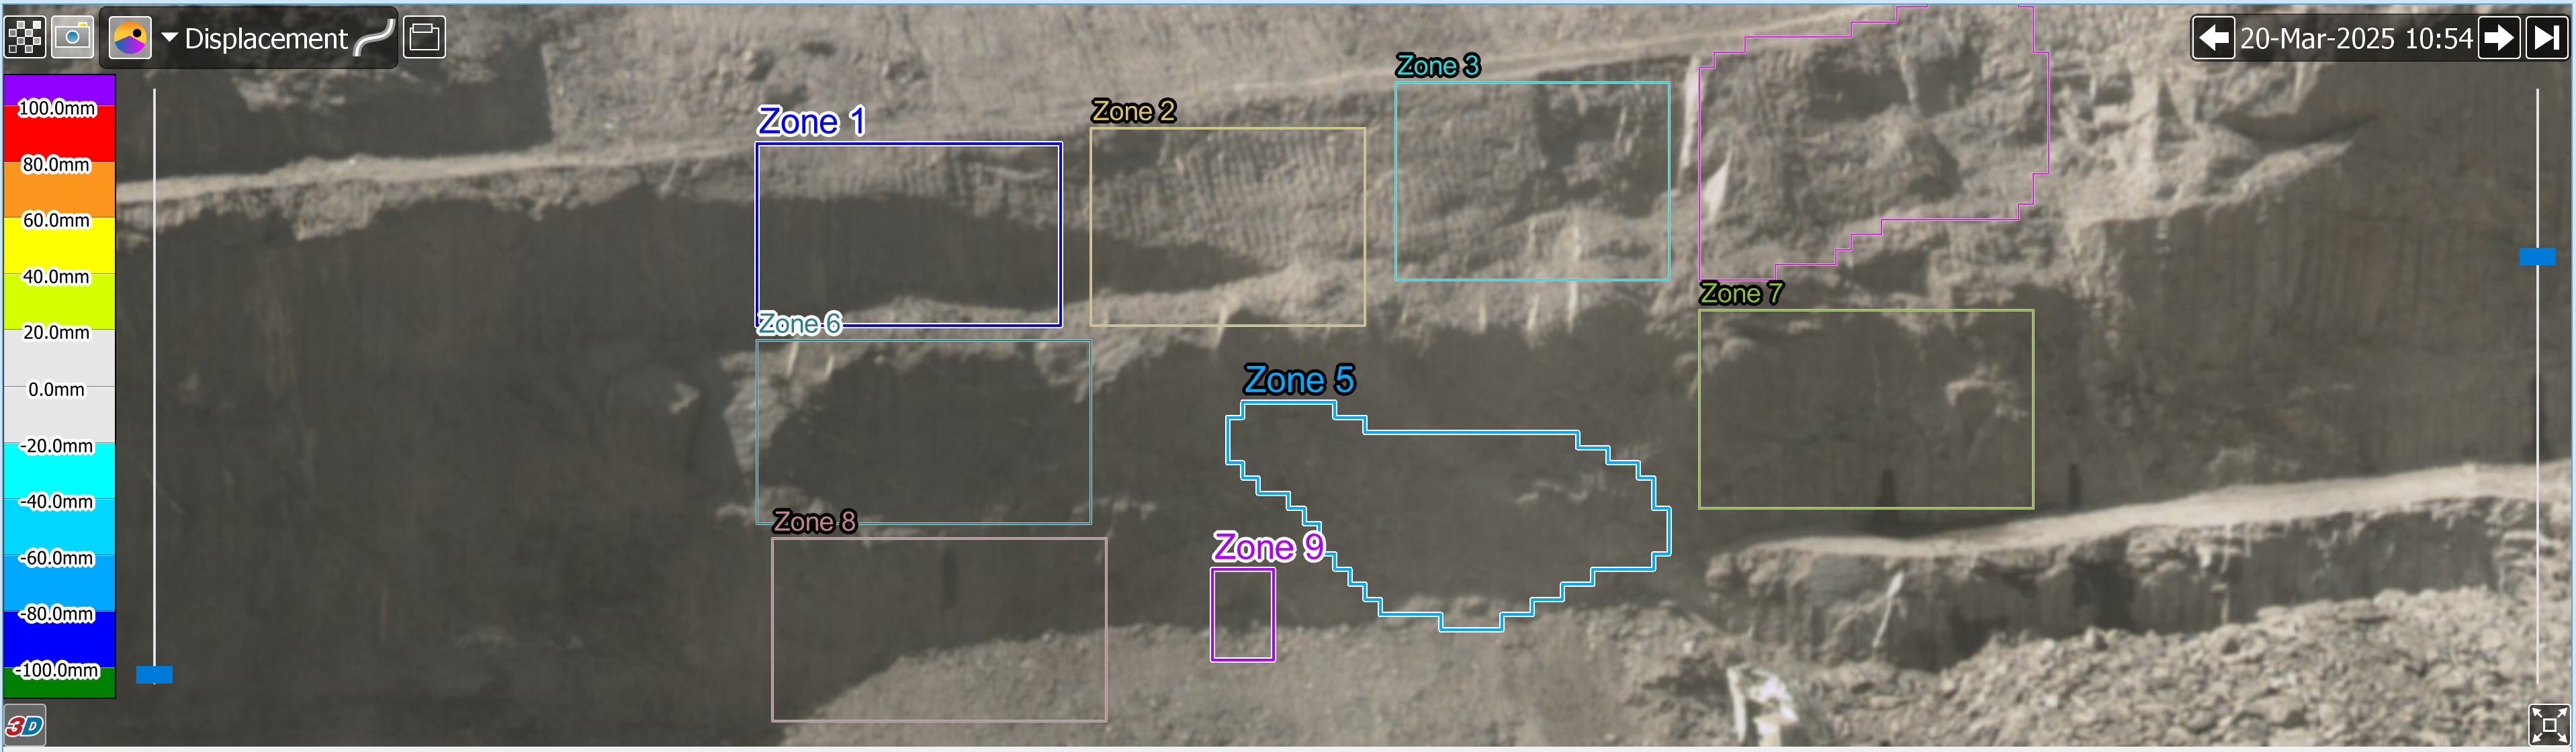
Scene viewer—2D mode
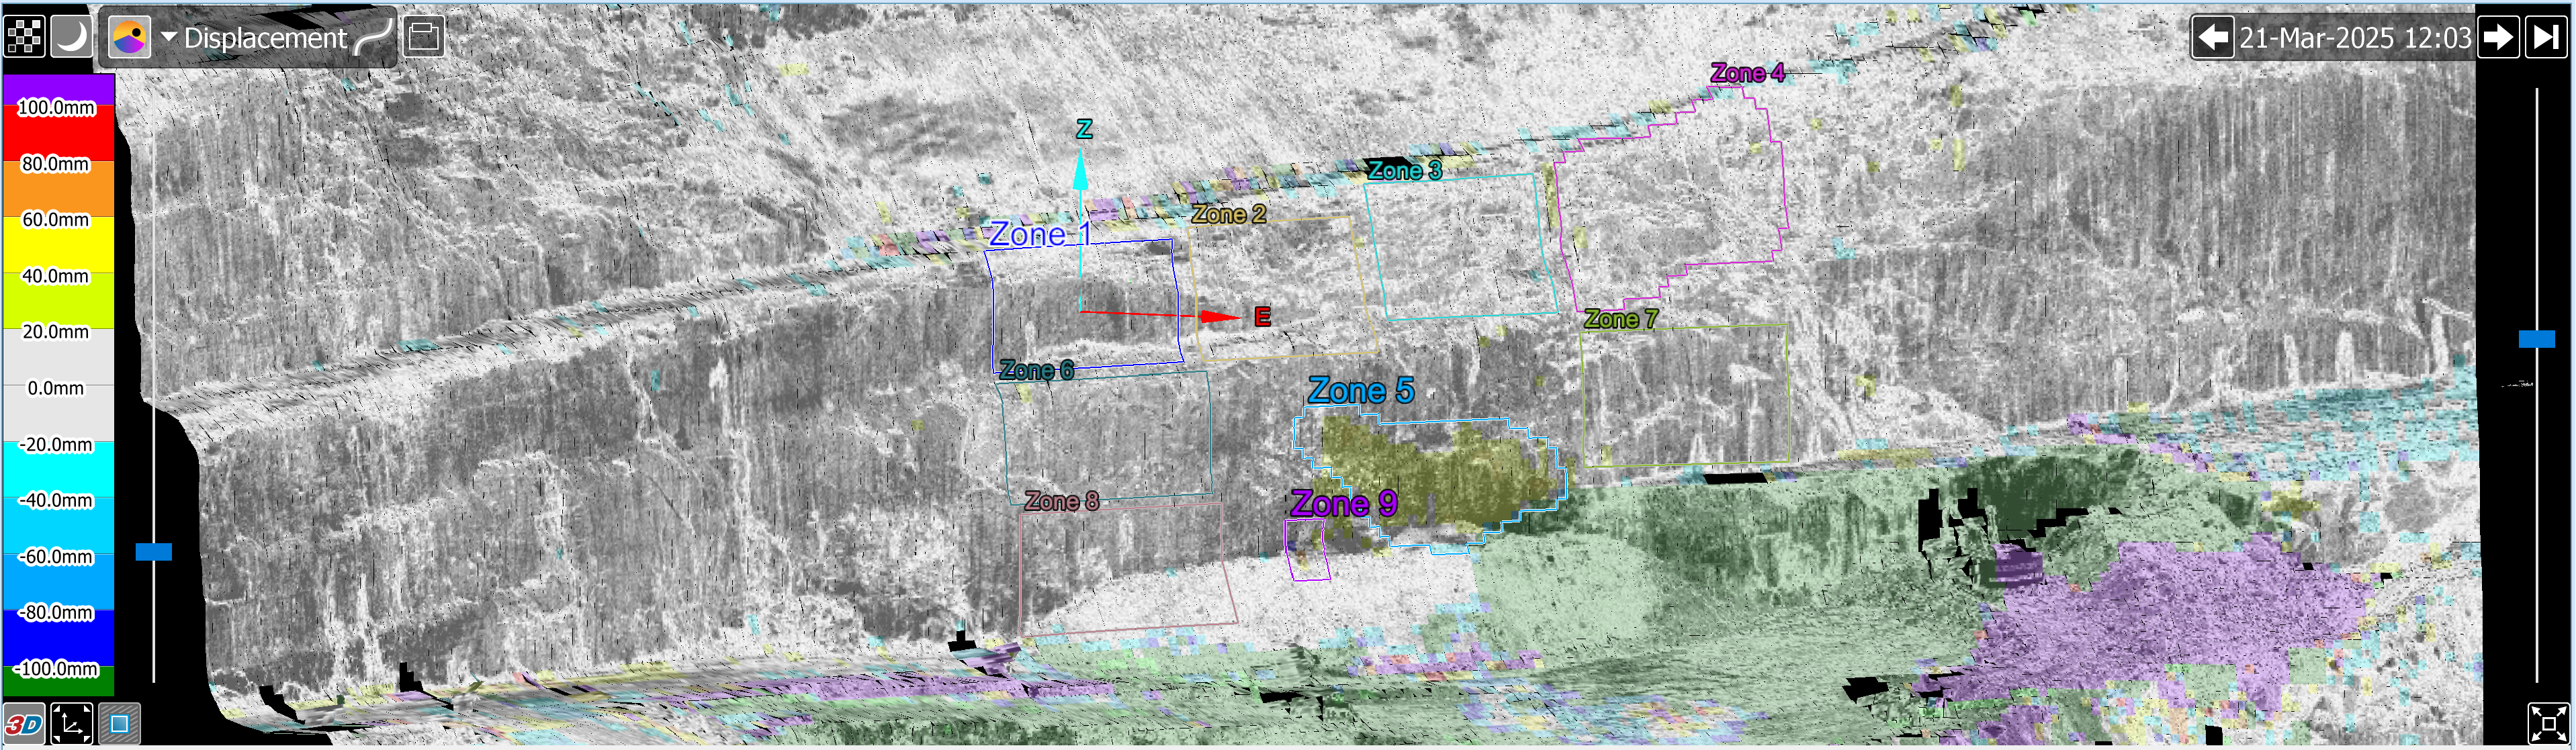
The image below shows a snapshot of a scene made up of a laser intensity scan created on 21-Mar-2025 at
|
|
|
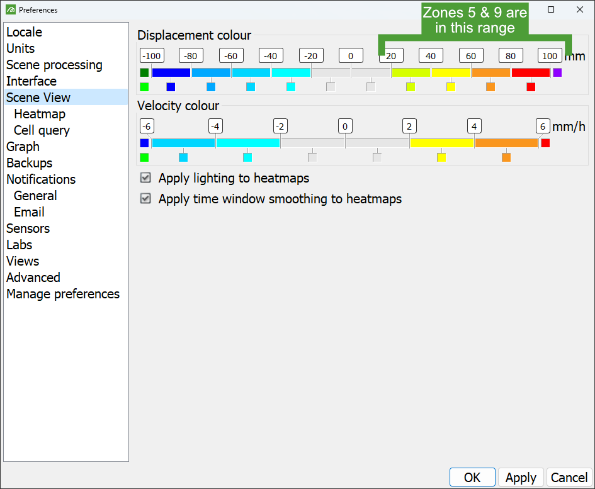
The heatmap can be customised in the Scene View preferences . |
|
|
|
Scene View heatmap preferences. |
Note: Positive values represent movement towards the scanner and negative values represent movement away from the scanner.
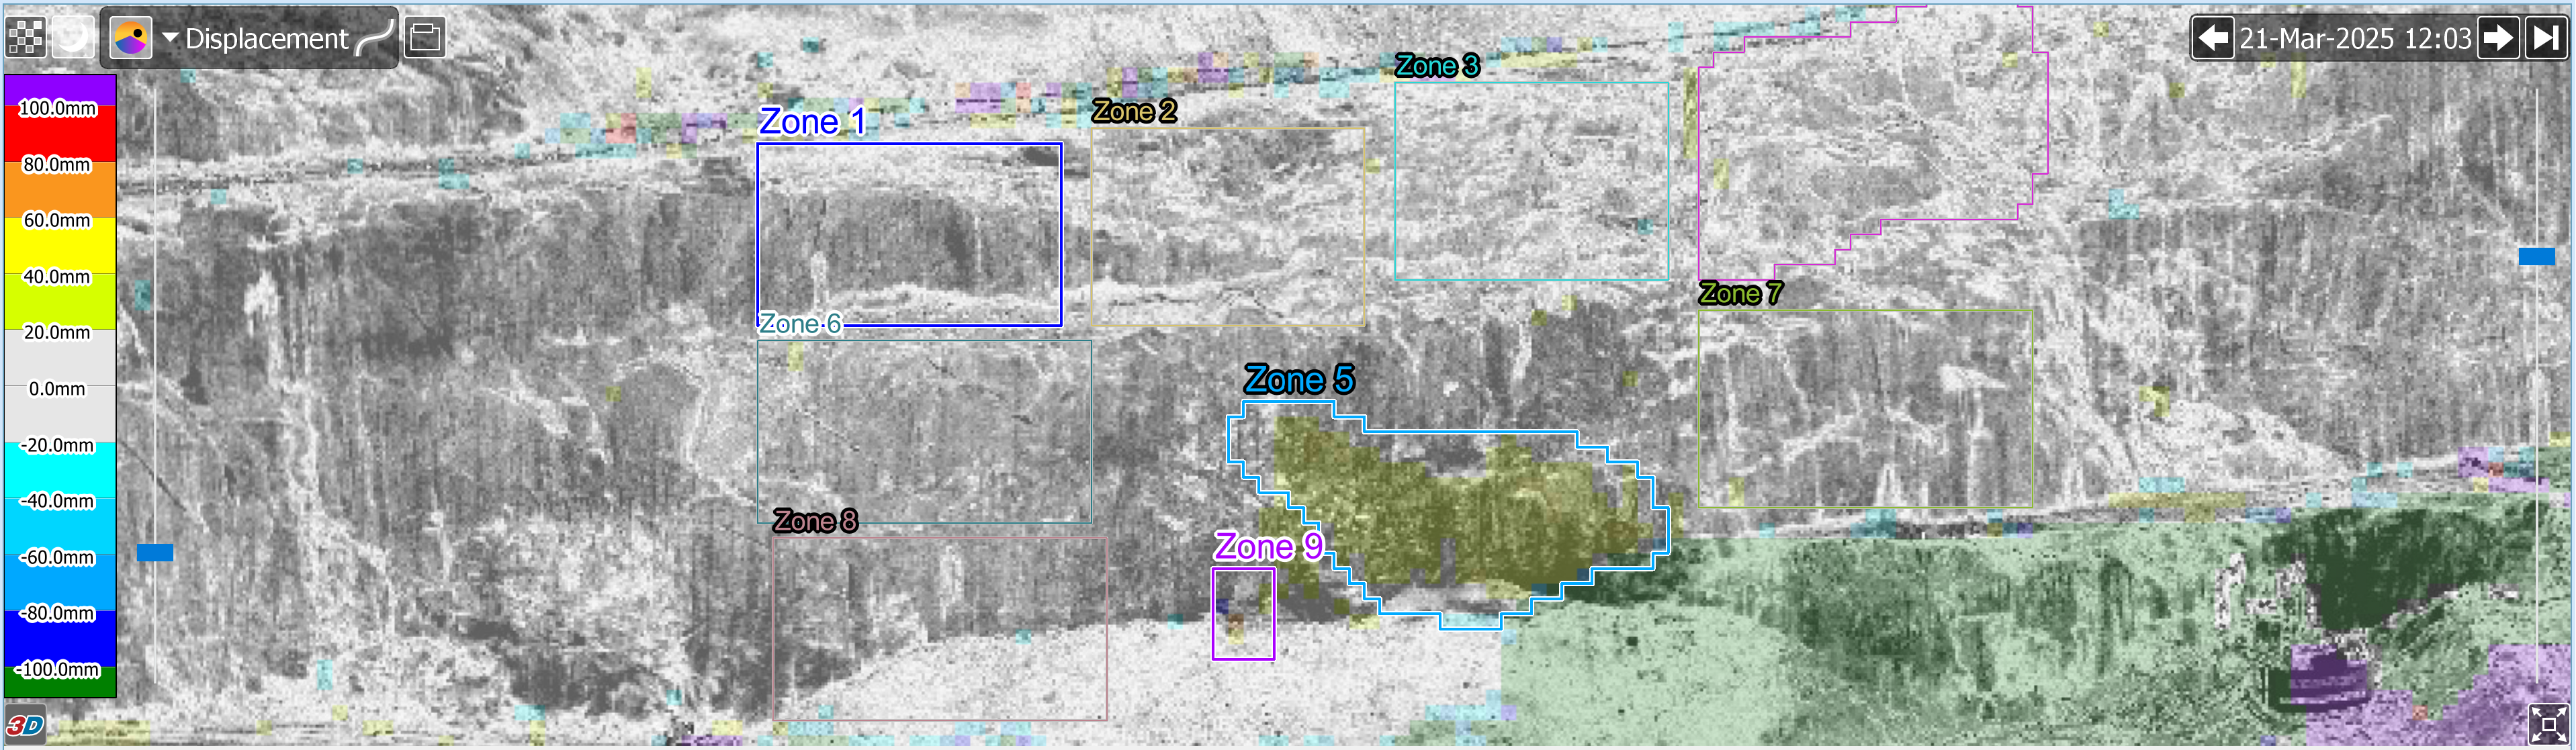
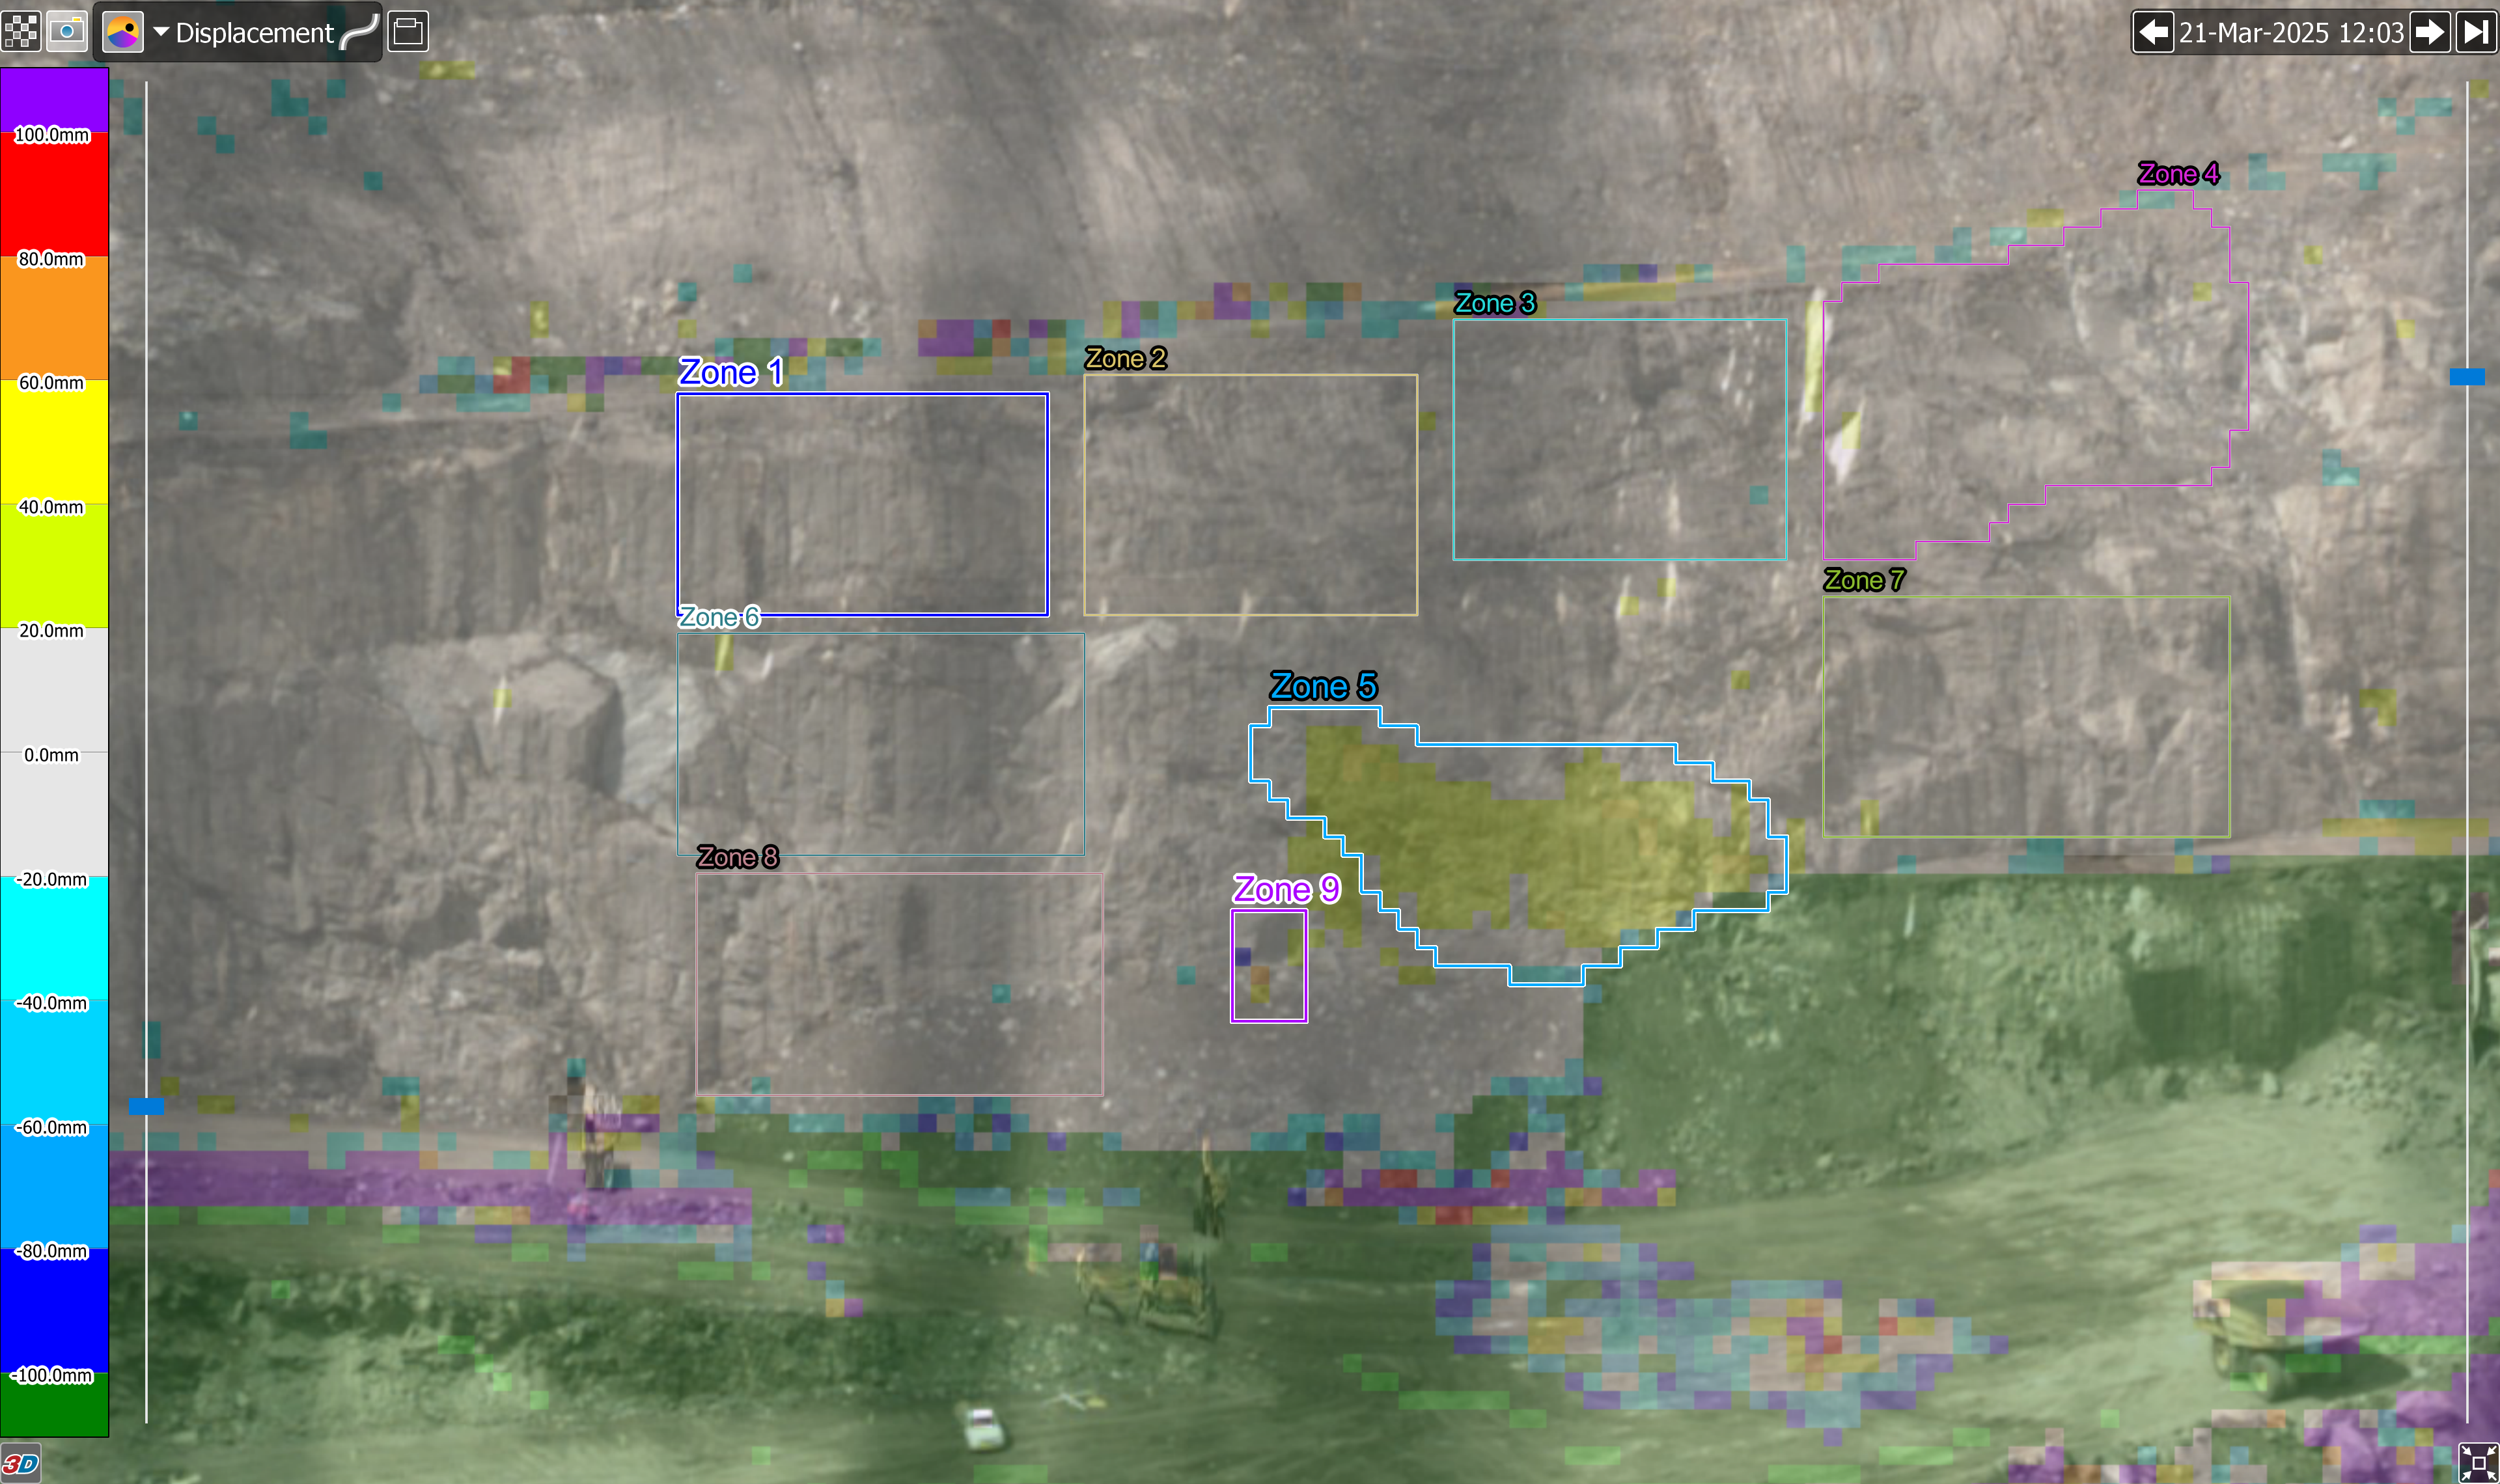
Following is a snapshot of the same scene with the heatmap image made slightly more translucent to expose more of the scan data. In this view the surface details of the scene are more visible and may make zone creation easier.
|
|
|
Scene with heatmap translucency applied |
Manipulate the 2D view as follows:
-
To pan, drag with either the left or middle mouse button.
-
To zoom on the cursor location, rotate the scroll wheel.
-
To zoom on the view centre, drag vertically with the right mouse button. Alternatively, drag the zoom slider located at the right side of the scene viewer.
-
Click on a zone to select that zone.
Scene viewer—3D mode
You can view scenes in 3D mode to get a better impression of perspective and depth.
-
Click the
 (Switch between 2D and 3D view) button in the bottom-left corner of the scene viewer to toggle the view into 3D mode. Click the button again to revert to 2D mode.
The image below shows the same snapshot of the scene in 3D view made up of cells derived from a scan, overlaid with a heatmap that indicates displacement.
|
|
|
Scene in 3D representation |
Manipulate the 3D view as with the 2D view except:
-
Press and hold the left mouse button while moving the mouse to rotate around the centre of rotation.
-
Click anywhere on the surface to change the centre of rotation.
The following buttons only appear in 3D view:
|
|
Click to reorient the view, putting the axes in the centre of the view. |
|
|
Click to hide areas of a scene outside selected zones (only available when at least one zone is selected). Click again to reveal hidden areas. |
|
|
|
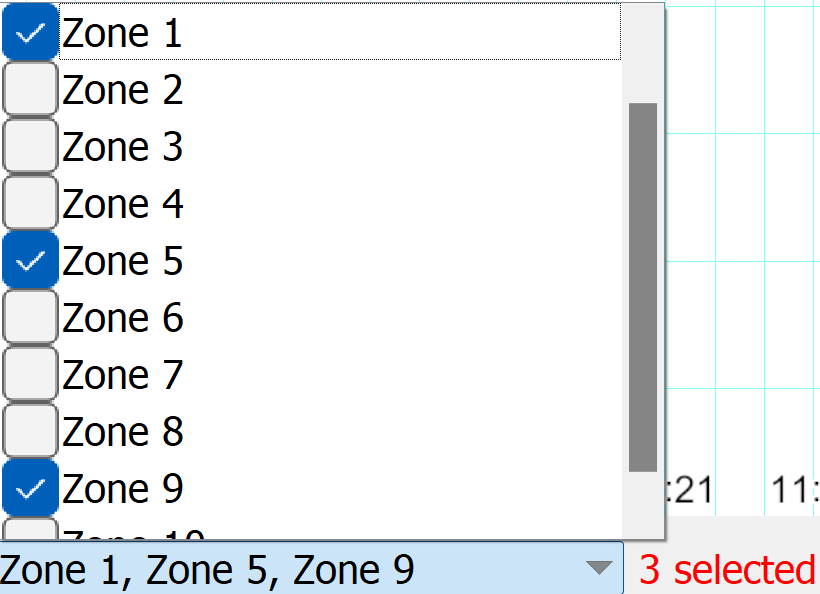
Zone 1, Zone 5 and Zone 9 selected for viewing |
|
|
|
Selected zones displayed, unselected zones hidden for ease of analysis |
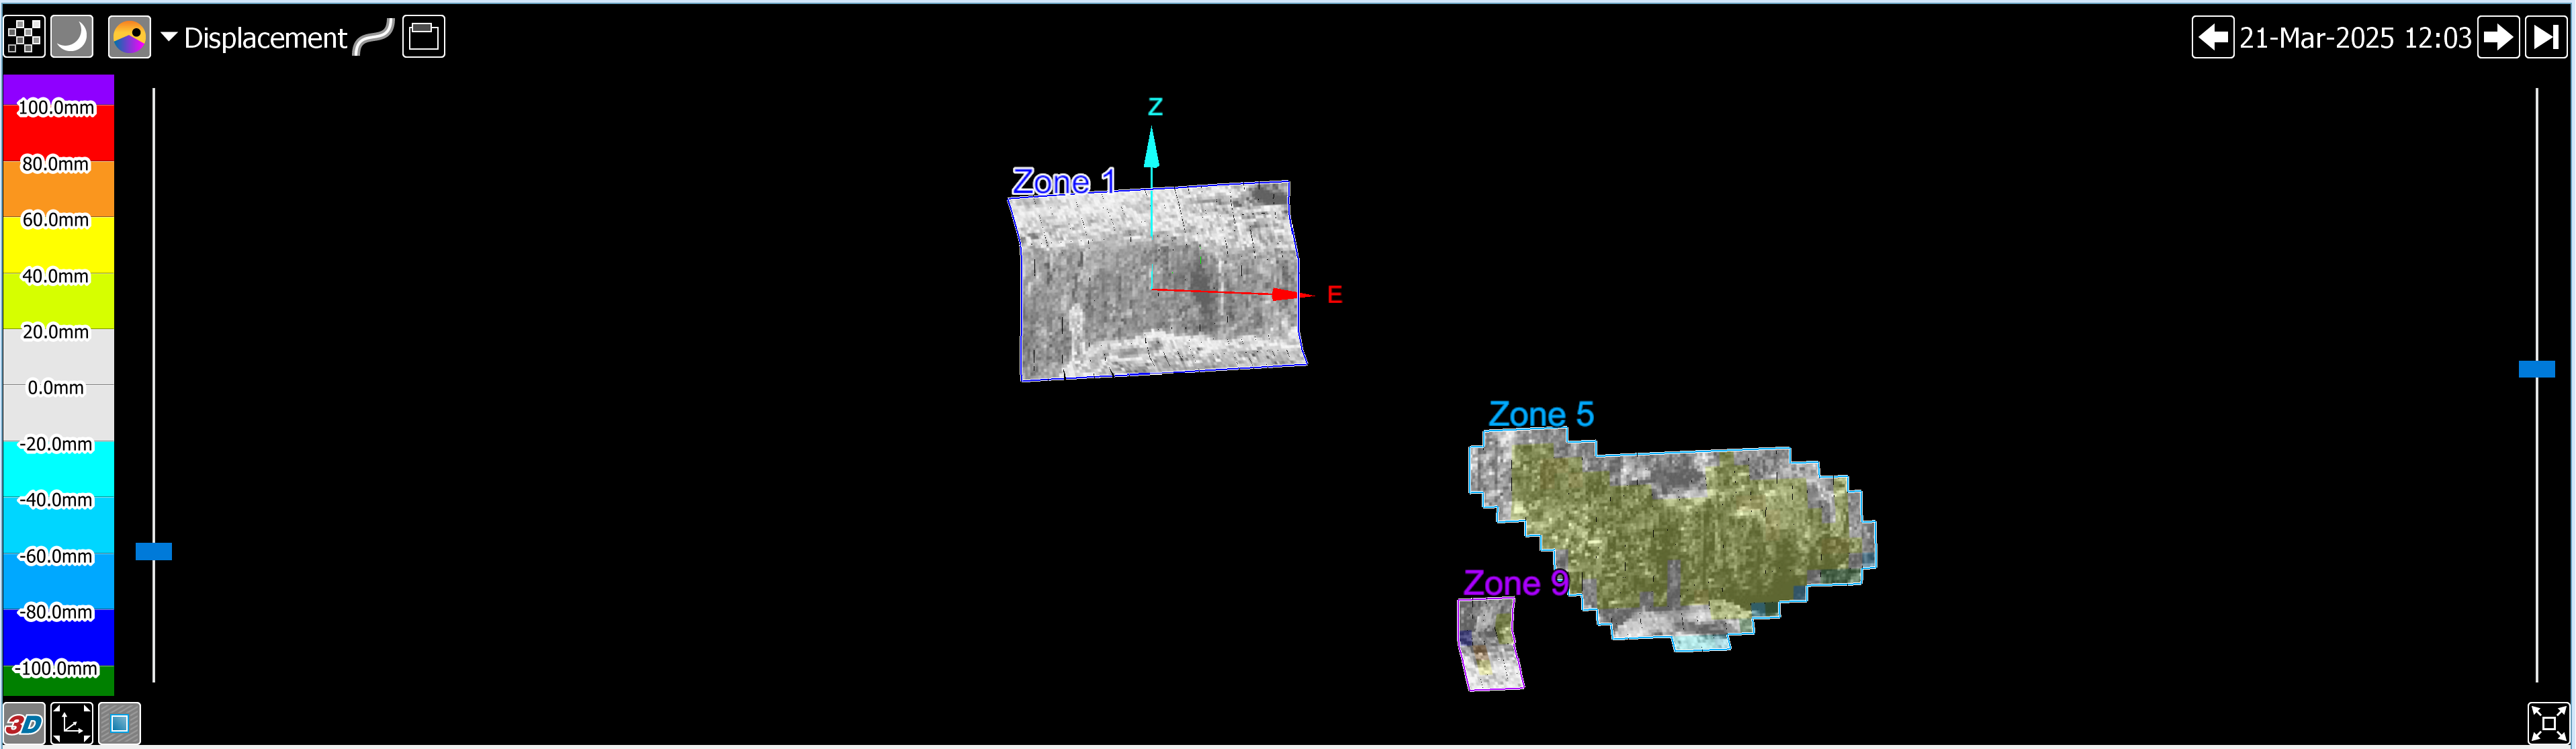
All the other areas and zones were hidden from view.
Scene viewer—full screen mode
You can enlarge the view to occupy the full screen. Click the ![]() (Full screen (F11)) button in the bottom right-hand corner of the view to toggle full screen mode.
(Full screen (F11)) button in the bottom right-hand corner of the view to toggle full screen mode.
|
|
|
A scene view in full screen. |
Tip: You can also toggle full screen mode by pressing the function key F11.
Stepping through the scene in time
The scan time of the scene image currently being viewed is displayed in the top-right corner of the scene viewer.

-
Click the
 (View previous scan) button (or press the left arrow key) to step the scan time back to the previous scan in the series.
 -
Click the
 (View next scan) button (or press the right arrow key) to step the scan time forwards to the next scan in the series.
 -
Click the
 (View latest scan) button to set the scan time to the most recent scan.
The scan time can also be set by dragging the time slider in the dashboard graph view.
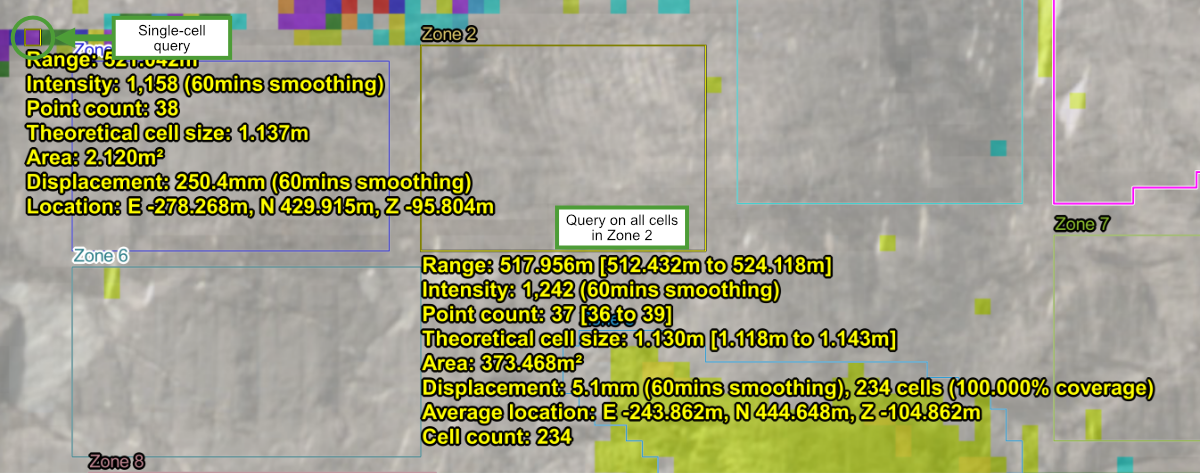
Cell queries
You can obtain information about a cell, a region of cells, or a zone using cell queries.
-
To toggle cell query mode on and off,
 Cell Selection
While in cell query mode, you can do any of the following:
-
Click on a single cell in the scene viewer to retrieve information about it.
-
Drag-select a region to display information averaged over all the cells in that region.
-
Hold down Shift and click inside a zone to display information averaged over all the cells in that zone.
-
Hold down Ctrl and click inside a query selection to remove that query.
-
Click
Cell Selection again to clear all queries and toggle cell query mode off.
|
|
|
Example of a query of the average of Zone 2 and of an individual cell |
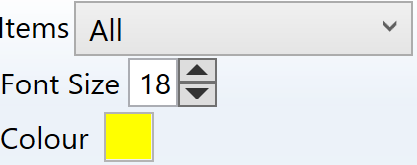
With the remaining controls in the Query group, you can customise the information and appearance of a cell query with the following options:
-
Items: Deselect any details in the drop-down list that are not required.
-
Font Size: Adjust the height of the query text.
-
Colour: Select a different text colour from the palette.