Risk
Instructions
On the Underground menu, point to Analyse, click Stope Optimiser, and then select Risk from the tree menu on the left.

Risk
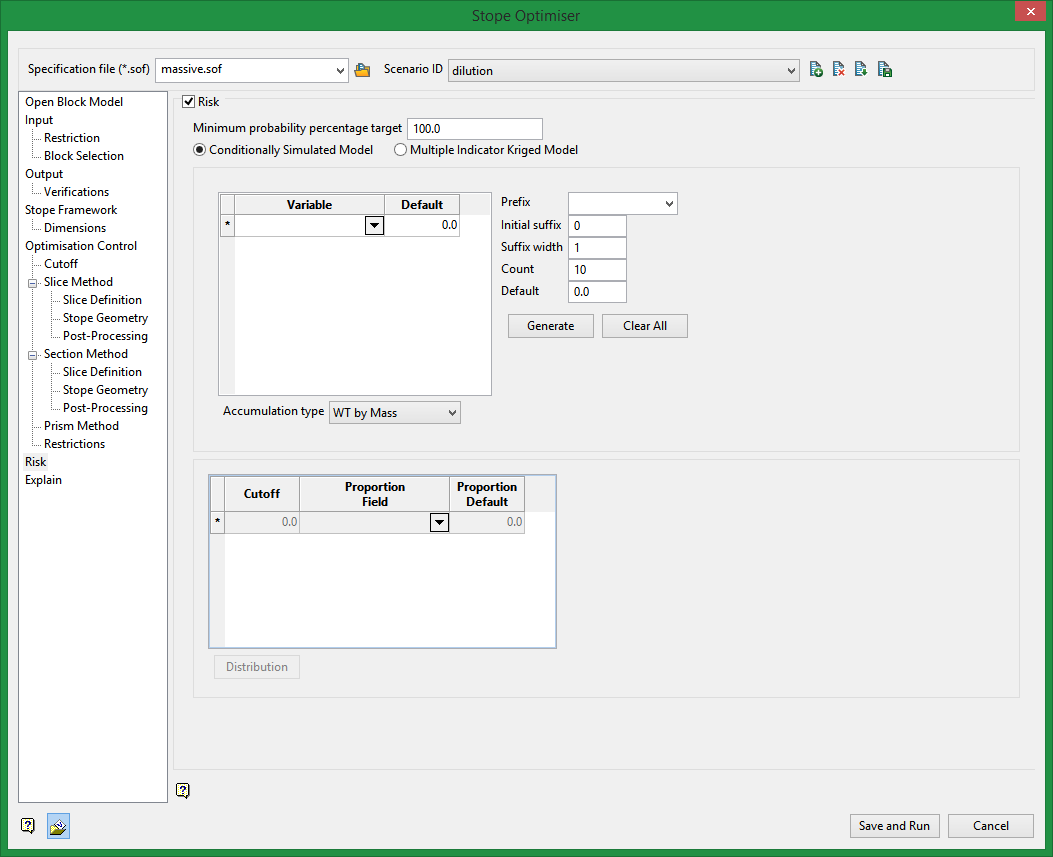
The most common method of defining geological risk is to simulate the uncertainty associated with estimation of grade into a model cell. There are two geostatistical methods currently handled by the SSO. They are Conditional Simulation or Multiple Indicator Kriging. The SSO geological risk techniques enable either stope-shapes to be designed to a geological confidence level (i.e. maximising optimisation field value while meeting confidence criteria) or evaluated to ascertain their geological confidence level (maximising optimisation field value and reporting the confidence level).
Minimum probability percentage target
The single set of stope-shapes that return maximum value is reported at the requested level of confidence, rather than reporting a stope optimisation on each and every realisation. At 100% confidence the stope-shape will satisfy the cut-off value for every realisation. At 80% confidence the stope-shape will satisfy the cut-off in 80% of the realisations. The trade-off between risk and return is found by graphing the stope tonnage and value against confidence, and is a way to generate a "nested" set of stopes.
Conditionally Simulated Model
The Conditional Simulation method typically provides 20-50 equi-probable realisations of the cell grades within the block model. The maximum number of realisations is currently 50.
If making comparisons regarding the appropriate number of realisations, it should be noted that if alternate models are used, they must have the same starting seed position. It is therefore preferable when making such comparisons that the model with largest number of realisations is used and other sub-sets extracted in lowest sequential order to make correct comparisons.
Multiple Indicator Kriged Model
The Multiple Indicator Kriged (MIK) method provides the frequency distribution of the grades in a block (expressed as the percentage of material above cut-off and the head-grade of this material for typically 10-20 cut-off values), but is not able to identify the location of the grades. The SSO internally manipulates the MIK model to produce “conditional simulation like” outputs using a technique called Pfield Simulation, which is documented in the Stanford University GSLIB package ( http://www.gslib.com ).
Variable
Select the optimisation field that the primary grade field is reported from.
Default
Enter a default value for a single run.
For multiple iterations:
Prefix
Select a prefix.
Initial suffix
Enter the initial digit that the following suffixes will start from.
Suffix width
Enter the number of numeric place holders that the suffix will use.
Count
Enter the total number of iterations.
Default
Enter a default value.
Generate
Click to generate the list.
Clear All
Clears all entries in the table.
Accumulation type
Select between weight by mass, weight by volume, and sum.
Cutoff
Select a cutoff grade. MIK will provide a distribution of grades in a block above this value.
Proportion Field
Select the block model field that holds the grade.
Proportion Default
Enter a default value.
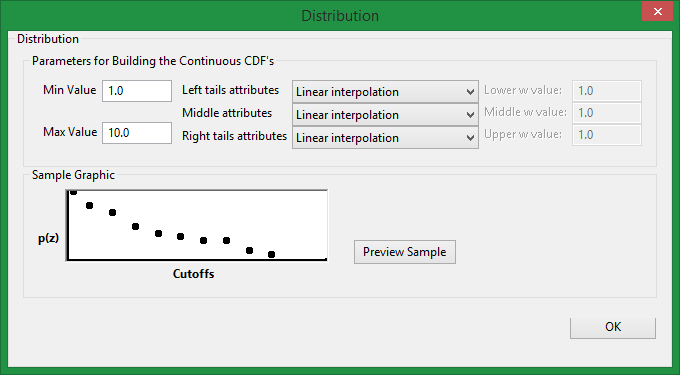
Distribution
Click this button to display the Distribution panel.

Min Value
Minimum data value allowed.
Max Value
Maximum data value allowed
Left tail, Middle, and Right tail attributes
Select the power model interpolation.
Lower, Middle, and Upper w value
These are values which control the interpolation / extrapolation between the distribution points. The distribution which you provide to the program is discrete (some finite number of bins). The program has to change that into a continuous distribution so it has to interpolate / extrapolate somehow. It uses a power function to do that, and w is the power. If w is 1.0, it is linear.
Related Topics
Section Method Slice Definition
Section Method Post Processing

