Fly Rock Modelling
Source file: modelling-fly-rock-modelling.htm
The Fly Rock Modelling tool provides a method to predict a maximum horizontal distance of fly rock based on model inputs. The resulting boundary may be used to assist with understanding the potential extent of fly rock displacement and determining blast exclusion zones.
Methods
BlastLogic uses kinematic equations from two different methods to calculate fly rock displacement:
-
McKenzie, C.K. (2009). Fly rock range and fragment size prediction. International Society of Explosive Engineers, 35th Annual Conference, Denver, USA.
-
Richards and Moore. (2006). Sourced from the Terrock Supplementary Modelling Report for Kalgoorlie Consolidated Mine.
When using the McKenzie method, the assumed particle shape factor is 1.2. This value is the average value for particle shape distribution and BlastLogic uses it to determine the effects of air resistance.
Any air decks or gas bags that are adjacent to bulk or packaged explosives are treated as the same explosive column. The explosive density is assumed to be the total mass of explosive divided by the total volume of the entire explosive column (air and explosive volume).
Types of fly rock modelling
There are two types of modelling: 3D and 2D models. Both modelling types use a projectile velocity. The velocity is determined from either the McKenzie or Richards and Moore kinematic methods.
In 3D modelling, the velocity is used to calculate the intercept between the trajectory of the rock and the topographic surface provided. This is repeated for a number of vertical angles until the furthest horizontal distance is found for a given orientation. This is then repeated at various orientations in order to form a boundary around each selected hole. After boundaries around individual holes are created, an overall boundary is generated.
In 2D modelling, it is assumed that the topographic surface is flat and therefore that the maximum trajectory angle is 45 degrees. The velocity is used to determine the intercept with this theoretical surface.
The fly rock components analysed by BlastLogic are as follows:
-
Cratering refers to fly rock from the collar of the hole and directly depends on the amount of stemming in the hole. The more stemming, the lower the amount of cratering. Only the top-most explosive deck is considered when the cratering is modelled. The lengths of any inert decks (including air), which are placed above the first explosive deck, are considered to be contributing to the stemming length.
-
Face burst refers to fly rock from a free face (generally a highwall) that is provided by the user as a triangulation. The greater the distance between an explosive deck and the triangulation surface, the lower the amount of face burst.
BlastLogic determines a vector of the closest distance between explosive decks and the free face, and then models this face burst potential in an arc of 180 degrees along the line that is perpendicular to the vector between the deck and the face. Therefore, if a single hole has two different points that are close to the face, only the closest one will be assessed.
Note: Rifling is not currently considered in any model.
Configuring fly rock modelling
To open the Fly Rock Modelling panel, go to the Analysis tab > Modelling group > ![]() Fly Rock Modelling.
Fly Rock Modelling.
The Fly Rock Modelling panel will appear.
To calculate fly rock properties for a given blast, set the following:
-
Choose the model to be used in the calculation by selecting either 2D or 3D radio button.
-
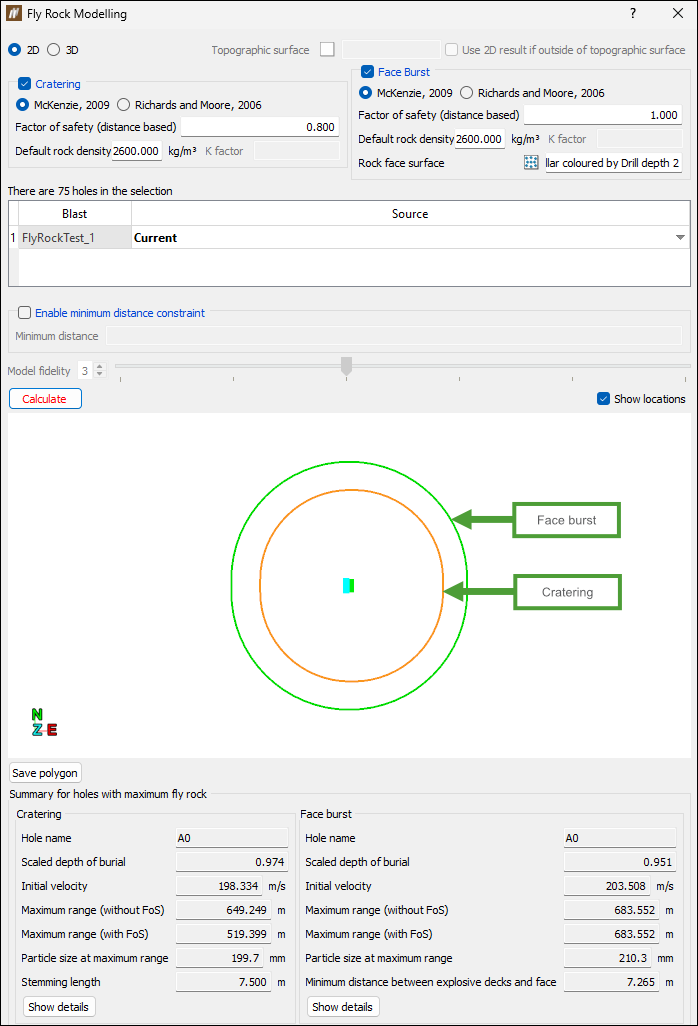
For the 2D model, BlastLogic creates fly rock boundaries separately for both cratering and rock burst, assuming that the worst case fly rock for each hole extends in a circle (not considering topography or fly rock flight direction).
-
For the 3D model, BlastLogic creates a combined fly rock boundary for cratering and rock burst, which simulates the flight path of fly rock at each hole and returns the maximum range where the flight path intersects the topography around the blast.
For the 3D model, you can additionally specify the topographic surface that is used to determine the intercepts for both cratering and face burst modelling. To do so, middle-mouse click the required surface in the

cadcontainer and drag it into the Topographic surface field. Select the adjacent checkbox for BlastLogic to use 2D result if the 3D calculations fall outside the topographic surface.
Note: The topographic surface should cover the entire extent of both the blast itself and the potential fly rock zone.
-
-
Choose the fly rock component to calculate. You can select Cratering, Face Burst, or both.
-
Set the following properties for each fly rock component to be calculated:
-
Method. Choose the method to be used in calculation by selecting either McKenzie, 2009 or Richards and Moore, 2006. See Methods for more information.
-
Factor of safety. Enter the value for safety factor.
Both models use a factor of safety when calculating fly rock. However, when it comes to this factor's application, there are some differences between the two models, as follows:
-
When calculating the 2D model, the factor of safety is a multiplier applied to the model-calculated fly rock horizontal distance. Therefore, the factor of safety for 2D models is distance-based.
-
When calculating the 3D model, the factor of safety is a multiplier applied to the initial velocity of the dominant type of fly rock (cratering or face burst). Therefore, the factor of safety for 3D models is based on launch velocity.
-
-
Default rock density. The McKenzie method uses density to calculate fly rock. This value will be used if there is not a specific rock density assigned to the hole. If you do not provide the default (average) density in the panel, BlastLogic will require the density assigned to each individual hole to calculate fly rock.
-
K factor. If you have selected the Richards and Moore method, you must additionally specify the K factor value.
Note: The K factor is a site-specific input value that must be derived for the specific blast scenario by experimentation on site.
-
Rock face surface (Face Burst only). Middle-mouse click the required surface in the
cadcontainer and drag it into the Rock face surface field to calculate the distance between the closest explosive deck and the rock face surface.
-
-
Specify the blast you wish to model by selecting it in the project explorer or in your workspace.
The selection table in the panel will display the selected blast and set the source data to Current in the Source column.
Optionally, change the data source by selecting one of the following sources from the drop-down:
-
Plan
Select the Plan option to generate a model using only charge plan data. In this case, no loaded or reconciled data is included in the model.
Note: This option is in bold to signify that it is a special data type that you can only access in the tie-up editor and fly rock modelling tool.
-
Current
Select the Current option to generate a model using reconciled data. If there is no reconciled data, BlastLogic will load the plan data instead (but not any loaded data).
Note: This option is in bold to signify that it is a special data type and not a snapshot.
-
Reference design snapshot
The name of the reference design snapshot will appear as an option in the drop-down. For example, the snapshot HP, is in bold to represent that it is the reference design snapshot. Select this option to generate a model using the reference design snapshot data.
-
Other snapshots
Any other snapshots related to the blast will also appear in the drop-down. Select the name of the desired snapshot to generate a model using that snapshot’s data. These snapshots will not be in bold.
-
-
Optionally, select the Enable minimum distance constraint checkbox to ensure that the fly rock boundary in any direction will be at least this specified distance.

-
If you have selected 3D model to be used in the calculation, you can also set Model fidelity. Use this setting to modify the number of sampling points used to generate a result. For example, increasing the fidelity will increase the number of orientations and vertical angles considered by the model.
Note: The higher the fidelity, the longer the algorithm will take.

-
After applying the required settings, click Calculate.
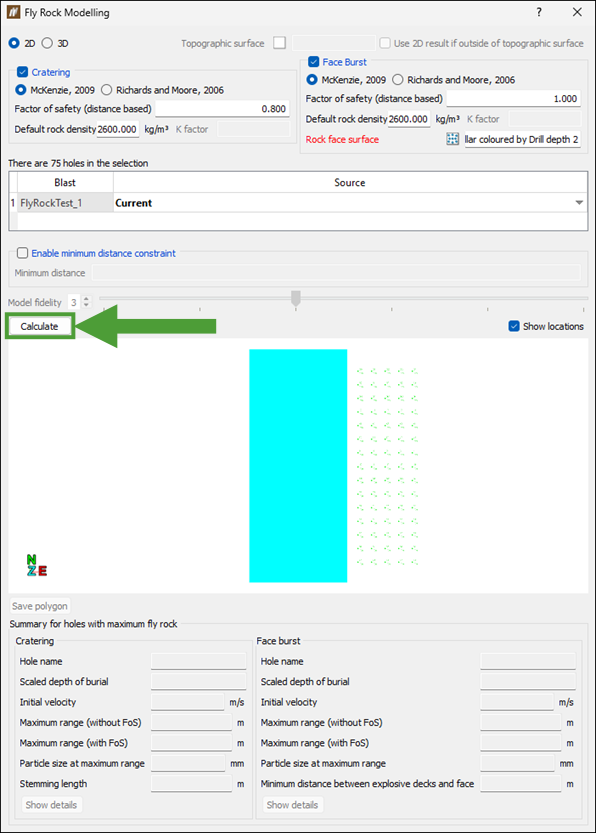
BlastLogic will create an overall flyrock boundary using the maximum horizontal distance from each selected hole and display the flyrock modelling results in the panel, marking the cratering boundary in orange and the face burst in green.
Click the Save polygon button for BlastLogic to save the polygons of the visualised fly rock components in the
cadcontainer.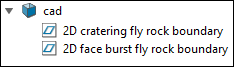
The summary fields below the view window display the holes that have recorded the highest fly rock values.
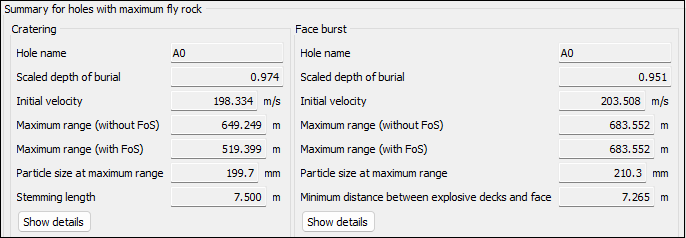
Note: The image above shows the results for both fly rock components (cratering and face burst). If you selected only one component while configuring the fly rock modelling, the fields corresponding to the component you did not select will be empty.
To view details for all holes included in the fly rock modelling, click the Show details button corresponding to the required component. will open a new panel displaying the overall information.
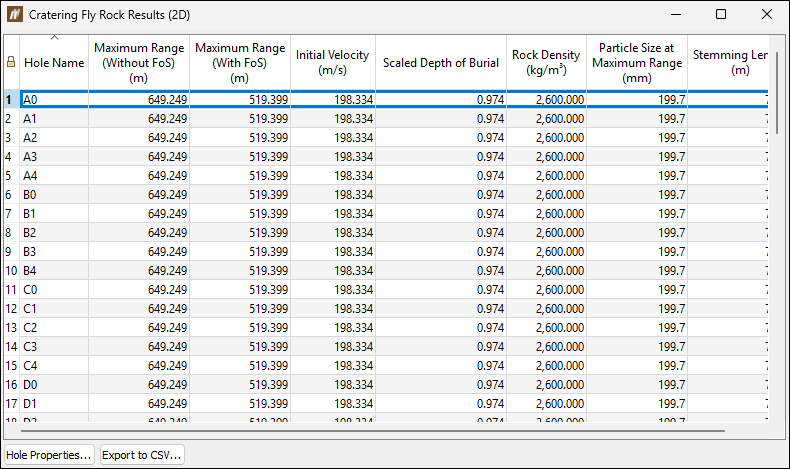
-
Click Export to CSV... to save your data in a comma-separated values (
.csv) file. Navigate to the required location on your machine, enter the name for your file, and click Save. -
Select the hole in the table and click Hole Properties... to open the Hole Properties panel where view and edit the properties for that hole. See Hole Properties for more information.
-
