

Pivot Reporting
Use pivot reports to analyse your generated schedules, as well as solid and block models.
Note: This functionality is not available for dynamic solids pits.
Creating a pivot report
Note: The pivot generation steps outlined in this topic apply to models and schedules generated in the Strategy, Origin Blocks, and Origin Solids modules. To generate and analyse pivot reports in the Epoch module, use the Live Dashboard panel (see Live Dashboard for more information). However, as the Pivot Reporting topic contains general information on pivots in Evolution, we recommend that you familiarise yourself with this content before proceeding with pivot reports in Epoch.
Follow these steps to create a pivot report:
-
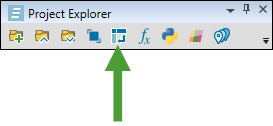
Click
 (Add Pivot Report) in the project explorer.
Tip: You can also add a pivot to a specific folder. To do so, right-click on the folder and select
Add Pivot from the context menu.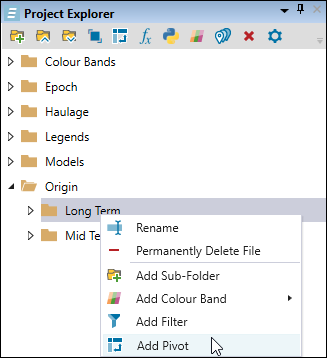
Evolution will place your newly created pivot report in the project explorer and will automatically open it in your workspace.
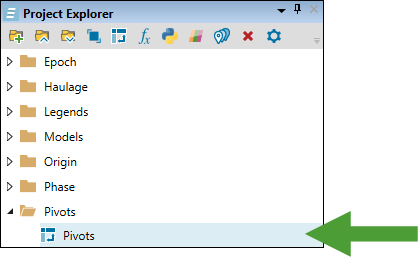
Tip: To rename a pivot file, right-click the file in the project explorer and select
 Rename… from the context menu (alternatively, press F2). Enter the new name, then either single-click or press Enter to confirm.
-
Drag and drop the required schedule or model into the workspace.
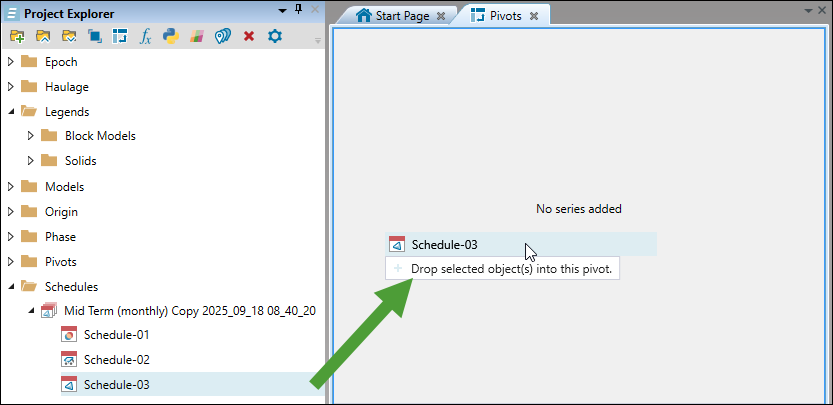
Tip: To add multiple schedules or models to your pivot, select them in your project explorer while pressing Ctrl and then drag them into the workspace.
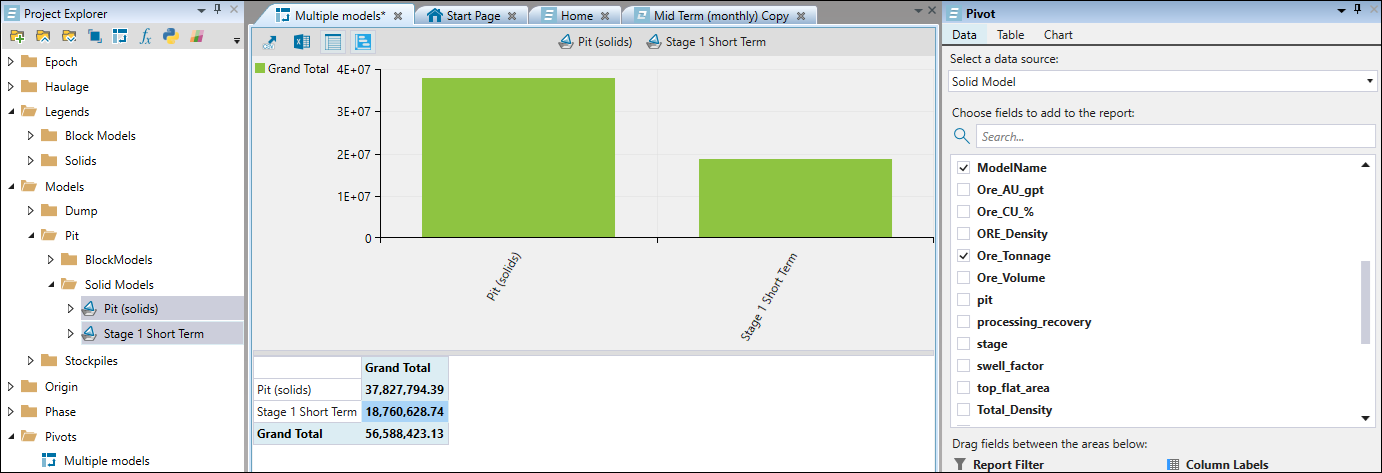
-
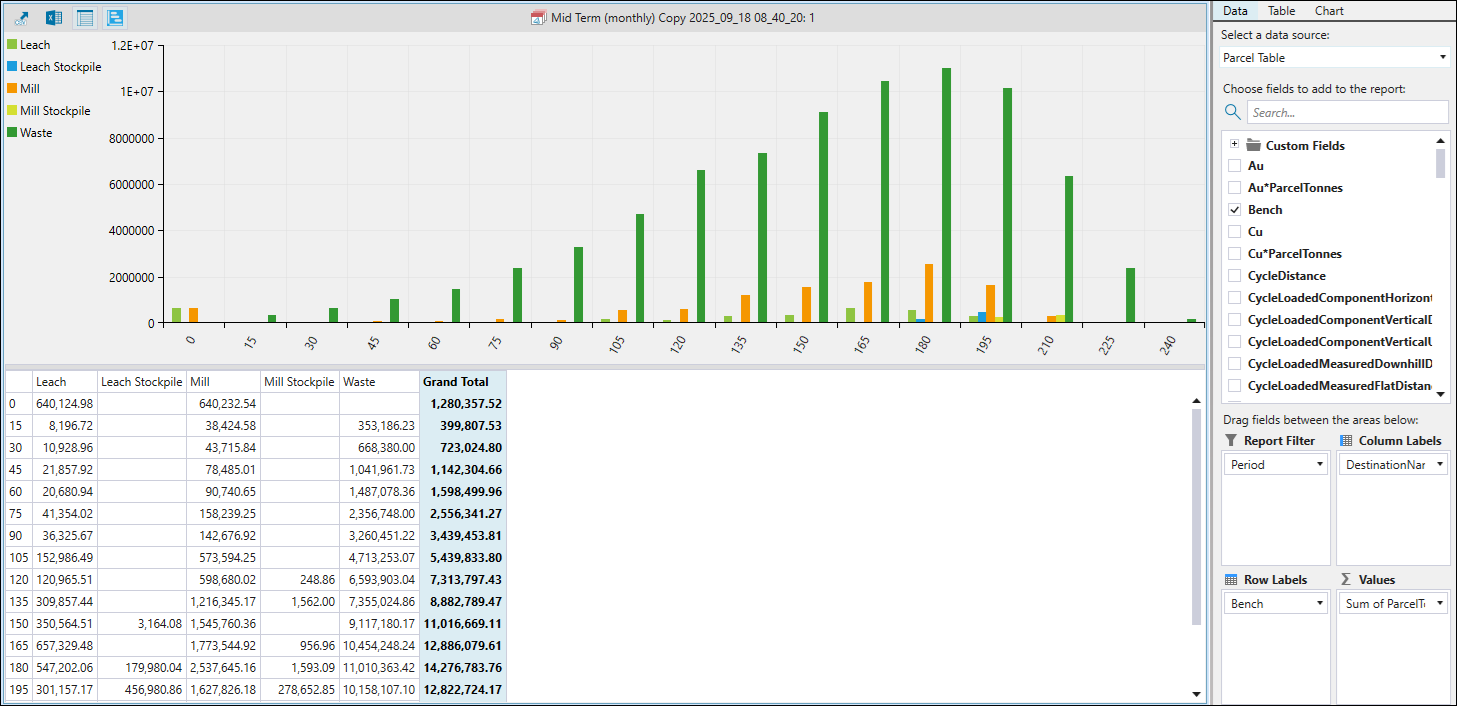
Open the Data tab in the Pivot pane and set the following fields:
-
Select a data source from the drop-down.
Note: The data source types listed in the drop-down will vary depending on the module in which you have configured your setup.
-
Specify the fields to include in your pivot report by selecting the corresponding checkboxes in the list.
See also: Fields in pivot reports
-
Drag and drop the selected fields between the following areas:
-
Report Filter: Use if only a subsection of results is relevant. For example, if you only want to identify the amount of tonnes sent to the waste dump, you can filter your data by destination.
-
Column Labels: Headings for the columns in the pivot report.
-
Row Labels: Headings for the rows in the pivot report.
-
Values: Specify the data you want aggregated in each cell. By default, the aggregation type is set to sum.
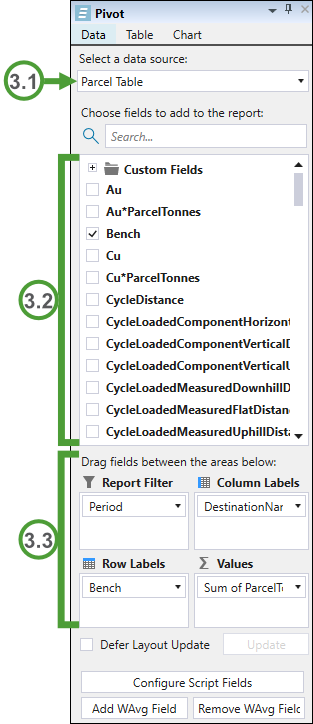
Example: In the example below, we display the per-period number of parcel tonnes sent to each setup destination from each bench.
-
-
-
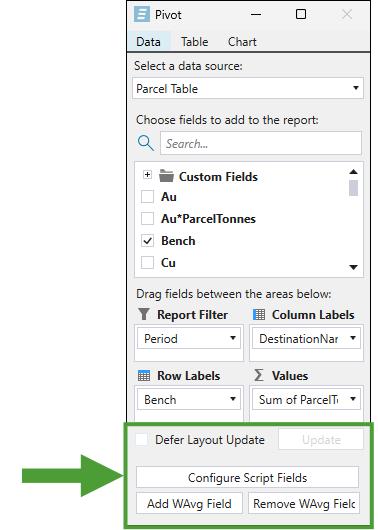
Optionally, set the following fields in the Pivot pane:
-
Defer Layout Update. Select the checkbox to make multiple changes to the pivot report without triggering updates after each change.
Note: When you select the checkbox, the Update button will be enabled. Click the button to reflect the changes that you made in the pivot.
-
Configure Script Fields. Click the button to define new script fields using maths scripts. The scripts that you enter will evaluate to numbers.
 Expand for more information on configuring script fields
Follow these steps to configure custom script fields for your pivots:
-
Click the Configure Script Fields button at the bottom of the Pivot pane.
-
Click the
 Add (1) row button to add a single row to the table in the panel that appears.
Tip: To add multiple rows at once, enter the required number and click the
button. -
Enter the name for the custom field.
Note: You must assign a unique name, as the field names cannot be duplicated.
-
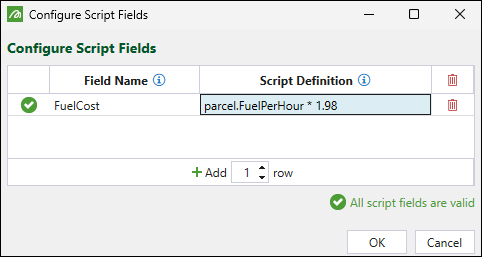
Enter the script definition.
Note
The following scripting prefixes can be used to access the values of existing fields:solid.
block.
parcel.
Example:
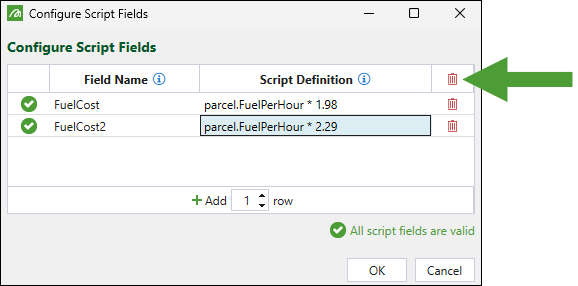
Note: To remove a single script field, click the
 button corresponding to the field that you want to delete. To remove all script fields, click the (Remove all) button in the table header.
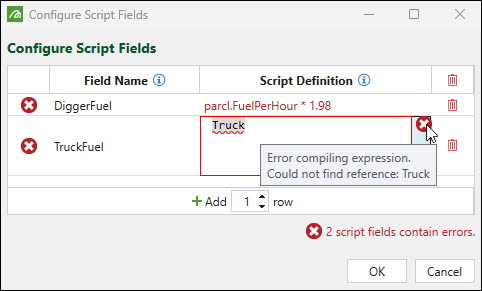
Note: If your script contains any errors, Evolution will display the
 icon on the left-hand side of the table. Additionally, the same icon will appear in the script field if there are any script definition errors. Hover over each icon to see the error details.
-
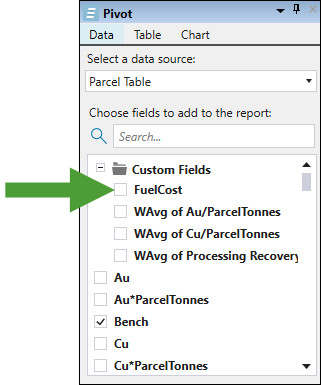
Click OK. The field that you created will be added to the Custom Fields folder in the Pivot pane and will be available only for this pivot.
Note: Script fields can also be referenced by weighted average fields (see Add WAvg Field below for details).
See also: Maths Scripts for Block Models, Maths Scripts for Solid Models
-
-
Add WAvg Field. Create fields to compute values such as average grade, cost, or recovery by factoring in a weight.
Expand for more information on configuring weighted average fields
Follow these steps to configure weighted average fields for your pivots:
-
Click the Add WAvg Field button at the bottom of the Pivot pane.
-
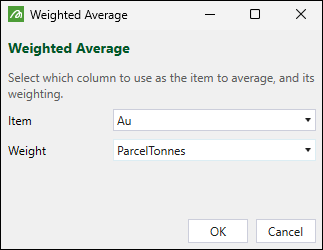
Using the drop-downs, define the field by selecting the required item and weight by which you want the item to be averaged.
-
Click OK.
The field that you created will be added to the Custom Fields folder in the Pivot pane and will be available only for this pivot.
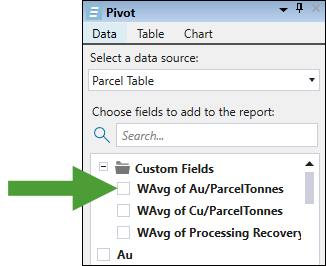
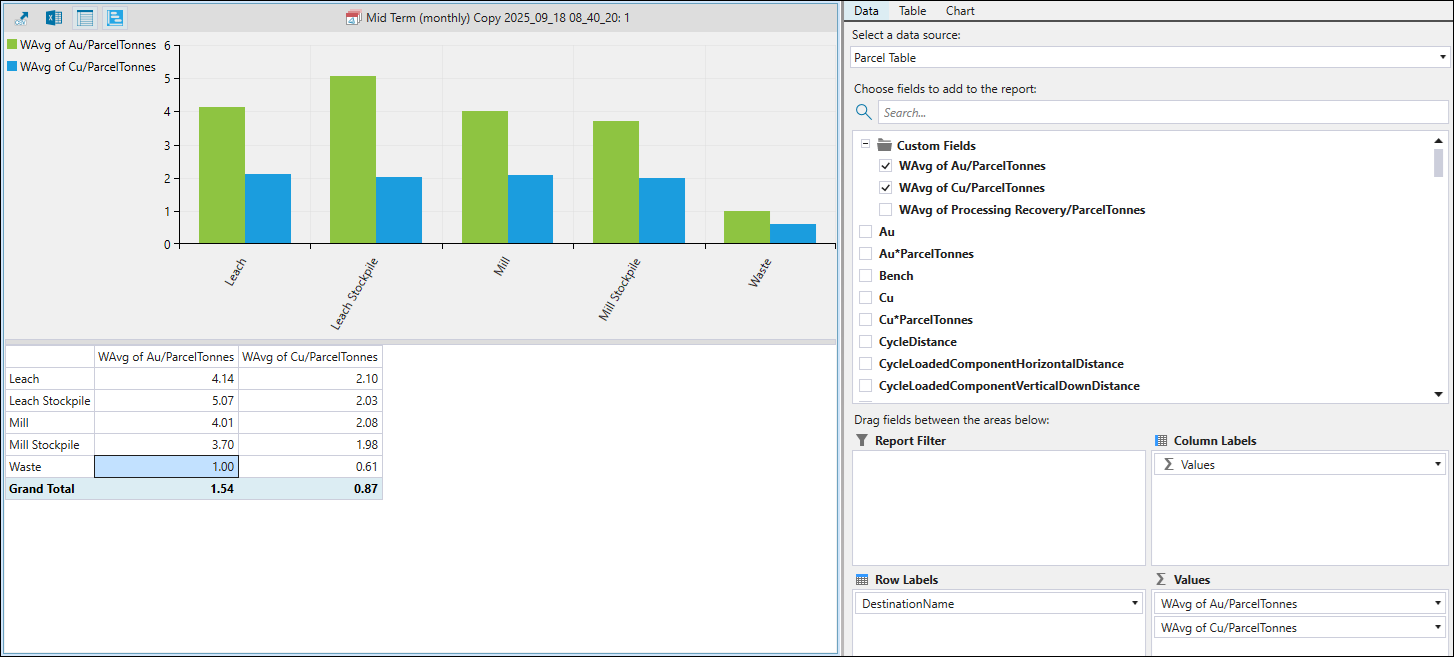
Example: In the example below, we use weighted average fields named WAvg of Au/ParcelTonnes and WAvg of Cu/ParcelTonnes to calculate the grade of gold and copper going to each process node.
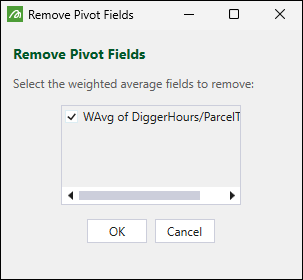
Note: To remove a weighted average field that you created, click the Remove WAvg Field button. Next, in the Remove Pivot Fields panel, select the field you no longer need and click OK.
-
-
Fields in pivot reports
Pivot fields are the building blocks that let you customise how your schedule or model data is analysed. Once you have added a pivot report and dragged a data source (such as a schedule or model) into the workspace, choose from a list of available fields and place them into specific areas (Report Filter, Column Labels, Row Labels, or Values) to define the layout and structure of your report.
See also: Creating a pivot report
Note: This topic lists the standard pivot fields used in Evolution Strategy, Origin Blocks, and Origin Solids. For pivot report fields used in Epoch, see Material Table and Activity Table in Epoch pivot reports.
Mine Sequence fields in Strategy
Mine Sequence contains processing records of material mined and processed across scheduled periods, as well as material reclaimed from stockpiles. Each record represents material moved from a source (pit or stockpile) to a processing destination or waste dump during a specific period, including tonnage, cost, grade, and financial data. The table merges data from both direct mining operations (ProcessData) and stockpile reclaim operations (StpReclaimData).
This data source includes the following reporting attributes:
| Reporting attribute | Description | Example value |
|---|---|---|
| {AcumulationName}_Accumulation | The value for the named constraint. | 159,326.67 |
| Bench |
The bench elevation of the source material, stated in the units specified for your project. Note: The value is determined by the block centroid elevation, not the toe. |
220.0 |
| BenchIndex | The numerical index identifying the bench level. | 5 |
| BreakdownField |
An additional user-defined breakdown attribute configured in the setup (for example, geotechnical domain or ore type). Note: If the attribute is not configured, the field is empty. |
Oxide |
| EndDateFull | The end date of the period, formatted as YYYY-MM-DD. | 2025-12-31 |
| EndDateMonth | The month of the period end date, stated in the range 1–12. | 12 |
| EndDateYear | The year of the period end date, formatted as YYYY. | 2025 |
| {element}_Grade | The in-situ grade for a setup-defined element. This attribute allows Evolution to extract each element’s grade as a numeric value. One column appears per element configured in the cost model, with the element name as a prefix (for example, evo_au_Grade, evo_cu_Grade). | 1.85 |
| {element}_Metal | The recovered metal quantity for a setup-defined element. One column appears per element configured in the cost model, with the element name as a prefix (for example, evo_au_Metal, evo_cu_Metal). | 450.0 |
| Grade |
The in-situ grade of the material, returned as a list of values, which the pivot displays as string (text) entries. Note: When multiple elements are configured, one column appears per element. |
2.4 |
| Hours | The operating hours required for the mining or processing activity. | 8.5 |
| IncOreCost | The incremental ore cost attributed to the material. | 1250.0 |
| Lithology | The lithology (rock type) of the source material. | Granite |
| Mcost | The mining cost attributed to the material. | 3500.0 |
| ModelName |
The name of the source block model. Note: This field is only present for direct mining operations, not for stockpile reclaim records. |
Strategic_Model |
| Pcost | The processing cost attributed to the material. | 12500.0 |
| Period | The reporting period that the record was generated within. The value shown in the pivot uses 1‑based numbering, meaning the first period is shown as 1 rather than 0. | 3 |
| PeriodName | The name of the period, derived from the setup calendar. | Year 3 |
| Process | The name of the processing destination or waste destination. For stockpile reclaim records, this shows the process being reclaimed to. | Leach |
| Profit | The net profit for the material, calculated as revenue minus all costs. | 45000.0 |
| RecoveredMetal |
The quantity of metal recovered after processing, returned as a list of string (text) values, with one entry per element. Note: When multiple elements are configured, one column appears per element. Values that could not be recovered are reported as 0. |
320.0 |
| Rehandle | The rehandling cost attributed to the material, applicable when material is moved more than once (for example, reclaimed from a stockpile). | 500.0 |
| Revenue |
The revenue generated from the material, returned as a list of string (text) values, with one entry for each element’s revenue contribution. Note: When multiple elements are configured, one column appears per element. |
65000.0 |
| Schedule |
The name of the Strategy schedule. Note: This field is added by the pivot when multiple schedules are present. |
Schedule_1 |
| SellingCost |
The selling cost attributed to the material. Note: When multiple elements are configured, one column appears per element. |
2000.0 |
| Stage | The stage value of the source material, as defined on the block model. | South_A |
| StartDateFull | The start date of the period, formatted as YYYY-MM-DD. | 2025-01-01 |
| StartDateMonth | The month of the period start date, stated in the range 1–12. | 1 |
| StartDateYear | The year of the period start date, formatted as YYYY. | 2025 |
| Stockpile |
The name of the stockpile being reclaimed. Note: This field is only present for stockpile reclaim records. |
Low_Grade_SP |
| Tonnes | The mass of the material, stated in tonnes. | 14000.0 |
Note: The pivot might also include dynamically defined accumulation items (for example, cumulative mining or processing totals) that appear as additional numeric columns based on the cost model configuration.
Tip: To use the numerical values for attributes such as RecoveredMetal and Revenue, use the Financials Table data source that extracts per-element values.
See also: Data Sources in Strategy schedules
Parcel Table fields in Origin Blocks
The Parcel Table data source in Origin Blocks pivot reporting contains detailed records of material movement from source blocks to destinations across scheduled periods. Each record represents a parcel of material moved during a specific period, including source and destination information, material quantities, and optionally equipment haulage and financial data. You can configure additional dynamic reporting items in your setup.
The universal reporting attributes for this data source are as follows:
| Reporting attribute | Description | Example value |
|---|---|---|
| BlockId | The unique identifier for the source block in the model. | 4523 |
| BlockName | The name of the source block. | Pit_A_220 |
| Destination | The name of the destination that the material was sent to. | Mill_01 |
| DestinationBlockIndex | The block index at the destination. | 1287 |
| DestinationBlockX | The X coordinate of the destination block. | 5432.5 |
| DestinationBlockY | The Y coordinate of the destination block. | 3210.8 |
| DestinationBlockZ | The Z coordinate of the destination block. | 180.0 |
| DestinationSolid |
The name of the destination block. Note: This field is only set when the DestinationType is a stockpile or waste. |
South_A_220 |
| DestinationType | The type of the destination for the material. Available destination types include Mill, Stockpile, OverflowStockpile, and Waste. | Mill |
| DiggerHours | The number of digger hours attributed to moving this parcel. | 1.5 |
| Lithology | The lithology (rock type) of the source material. | Granite |
| MiningCost |
The mining cost attributed to the parcel. Note: The attribute is only present when NPV data is configured. |
3500.0 |
| ModelName | The name of the source block model. | Strategic_Model |
| OriginalBlockIndex | The block index in the original model before any transformations. | 4523 |
| OriginalDestination | The name of the destination before any redirect was applied. If the parcel was not redirected, this matches the Destination. | Mill_01 |
| OriginalDestinationType | The destination type before any redirect was applied. If the parcel was not redirected, this matches the DestinationType. | Mill |
| Parcel | The name of the parcel. | ORE |
| ParcelSwelledVolume | The volume of the parcel after applying the swell factor. | 2600.0 |
| ParcelTonnes | The mass of the parcel, stated in tonnes. | 5200.0 |
| ParcelVolume | The in-situ (pre-swell) volume of the parcel. | 2000.0 |
| Period | The reporting period that the record was generated within. The value shown in the pivot uses 1‑based numbering, meaning the first period is shown as 1 rather than 0. | 3 |
| ProcessingCost |
The processing cost attributed to the parcel. Note: The attribute is only present when NPV data is configured. |
12500.0 |
| Profit |
The profit value for the parcel, calculated as revenue minus all costs. Note: The attribute is only present when NPV data is configured. |
45000.0 |
| Proportion | The proportion of the solid that was completed. This attribute can give numbers higher than 1 in scenarios with multiple parcels. Further breakdown reports by parcel to see the value. | 0.65 |
| Rank | The sequence rank indicating the order in which the material was scheduled. | 12 |
| ReclaimCost |
The reclaim cost attributed to the parcel. Note: The attribute is only present when NPV data is configured. |
1200.0 |
| Redirected | Indicates whether the parcel was redirected from its original destination. | false |
| RedirectType | The reason or type of redirect that was applied. Empty if the parcel was not redirected. | Capacity |
| RehabilitationCost |
The rehabilitation cost attributed to the parcel. Note: The attribute is only present when NPV data is configured. |
800.0 |
| RehandleCost |
The rehandle cost attributed to the parcel, applicable when material is moved more than once. Note: The attribute is only present when NPV data is configured. |
500.0 |
| Schedule |
The name of the source schedule. Note: This field is added by the pivot when multiple schedules are present. |
Schedule_1 |
| Source | The name of the source of the material (either the name of a pit or stockpile). | South_Pit |
| Stage |
The stage value of the source of the material, either defined on the model or with the Stage Override option. See also: Stage Override in Origin Blocks setup configuration |
South_A |
| TotalElementPrice |
The total element price (revenue) for the parcel based on commodity grades and prices. Note: The attribute is only present when NPV data is configured. |
65000.0 |
| TotalMass |
The total mass of the source block, stated in tonnes. Note: This is the full block mass, not just the parcel portion. |
14000.0 |
| UsedDiggerName | The name of the digger used to extract the material. | Shovel_01 |
| X | The X coordinate of the source block centroid. | 2345.5 |
| Y | The Y coordinate of the source block centroid. | 3456.7 |
| Z | The Z coordinate of the source block centroid. | 220.0 |
The reporting attributes applicable only to Equipment setups are as follows:
| Reporting attribute | Description | Example value |
|---|---|---|
| CycleDistance |
The total cycle distance (loaded and unloaded legs combined). |
12400.0 |
| CycleLoaded ComponentHorizontalDistance |
The horizontal component of the total loaded leg distance. |
5200.0 |
| CycleLoaded ComponentVerticalDownDistance |
The vertical-down component of the total loaded leg distance. |
120.0 |
| CycleLoaded ComponentVerticalUpDistance |
The vertical-up component of the total loaded leg distance. |
40.0 |
| CycleLoaded MeasuredDownhillDistance |
The downhill distance of the total loaded leg, measured along the path. |
1800.0 |
| CycleLoaded MeasuredFlatDistance |
The flat distance of the total loaded leg, measured along the path. |
3200.0 |
| CycleLoaded MeasuredUphillDistance |
The uphill distance of the total loaded leg, measured along the path. |
1200.0 |
| CycleTimeInMinutes |
The average time (in minutes) for a truck to complete a full cycle from source to destination and back, calculated as follows:
|
22.4 |
| DestinationArea |
The area label of the destination. |
ProcessPlant |
| DestinationBench |
The bench or elevation at the destination. |
180.0 |
| DestinationRouteName |
The name of the haulage route at the destination end. |
Mill_Route |
| ExPitCycleDistance |
The ex-pit (between pit exit and dump area) cycle distance. |
6200.0 |
| ExPitCycleLoaded ComponentHorizontalDistance |
The horizontal component of the ex-pit loaded leg distance. |
2800.0 |
| ExPitCycleLoaded ComponentVerticalDownDistance |
The vertical-down component of the ex-pit loaded leg distance. |
50.0 |
| ExPitCycleLoaded ComponentVerticalUpDistance |
The vertical-up component of the ex-pit loaded leg distance. |
20.0 |
| ExPitCycleLoaded MeasuredDownhillDistance |
The downhill distance of the ex-pit loaded leg, measured along the path. |
800.0 |
| ExPitCycleLoaded MeasuredDownhillTime |
The time spent on downhill segments during the ex-pit loaded leg. |
0.08 |
| ExPitCycleLoaded MeasuredFlatDistance |
The flat distance of the ex-pit loaded leg, measured along the path. |
1800.0 |
| ExPitCycleLoaded MeasuredFlatTime |
The time spent on flat segments during the ex-pit loaded leg. |
0.12 |
| ExPitCycleLoaded MeasuredUphillDistance |
The uphill distance of the ex-pit loaded leg, measured along the path. |
500.0 |
| ExPitCycleLoaded MeasuredUphillTime |
The time spent on uphill segments during the ex-pit loaded leg. |
0.15 |
| ExPitCycleUnloaded ComponentHorizontalTime |
The horizontal component time of the ex-pit unloaded (return) leg. |
0.10 |
| ExPitCycleUnloaded ComponentVerticalDownTime |
The vertical-down component time of the ex-pit unloaded (return) leg. |
0.02 |
| ExPitCycleUnloaded ComponentVerticalUpTime |
The vertical-up component time of the ex-pit unloaded (return) leg. |
0.04 |
| FuelPerCycle |
The fuel consumed per haulage cycle, calculated as follows:
|
45.2 |
| FuelPerHour |
The average rate of truck fuel consumption over the travelled path, given in the units specified for your project per hour. |
120.5 |
| Hours |
The total number of hours that a truck spent hauling the parcel (driving and loading time, not including spot or dump times). |
11.2 |
| InPitCycleDistance |
The in-pit cycle distance. |
4000.0 |
| InPitCycleLoaded ComponentHorizontalDistance |
The horizontal component of the in-pit loaded leg distance. |
1600.0 |
| InPitCycleLoaded ComponentVerticalDownDistance |
The vertical-down component of the in-pit loaded leg distance. |
60.0 |
| InPitCycleLoaded ComponentVerticalUpDistance |
The vertical-up component of the in-pit loaded leg distance. |
10.0 |
| InPitCycleLoaded MeasuredDownhillDistance |
The downhill distance of the in-pit loaded leg, measured along the path. |
600.0 |
| InPitCycleLoaded MeasuredDownhillTime |
The time spent on downhill segments during the in-pit loaded leg. |
0.05 |
| InPitCycleLoaded MeasuredFlatDistance |
The flat distance of the in-pit loaded leg, measured along the path. |
1000.0 |
| InPitCycleLoaded MeasuredFlatTime |
The time spent on flat segments during the in-pit loaded leg. |
0.07 |
| InPitCycleLoaded MeasuredUphillDistance |
The uphill distance of the in-pit loaded leg, measured along the path. |
400.0 |
| InPitCycleLoaded MeasuredUphillTime |
The time spent on uphill segments during the in-pit loaded leg. |
0.10 |
| InPitCycleUnloaded ComponentHorizontalTime |
The horizontal component time of the in-pit unloaded (return) leg. |
0.06 |
| InPitCycleUnloaded ComponentVerticalDownTime |
The vertical-down component time of the in-pit unloaded (return) leg. |
0.01 |
| InPitCycleUnloaded ComponentVerticalUpTime |
The vertical-up component time of the in-pit unloaded (return) leg. |
0.03 |
| NumberOfCycles |
The number of truck cycles required to move the parcel. Partial cycles indicate that the remaining proportion of the cycle would be used for the next parcel. |
30.0 |
| OnDumpCycleDistance |
The on-dump (within the dump area) cycle distance. |
2200.0 |
| OnDumpCycleLoaded ComponentHorizontalDistance |
The horizontal component of the on-dump loaded leg distance. |
800.0 |
| OnDumpCycleLoaded ComponentVerticalDownDistance |
The vertical-down component of the on-dump loaded leg distance. |
10.0 |
| OnDumpCycleLoaded ComponentVerticalUpDistance |
The vertical-up component of the on-dump loaded leg distance. |
10.0 |
| OnDumpCycleLoaded MeasuredDownhillDistance |
The downhill distance of the on-dump loaded leg, measured along the path. |
400.0 |
| OnDumpCycleLoaded MeasuredDownhillTime |
The time spent on downhill segments during the on-dump loaded leg. |
0.03 |
| OnDumpCycleLoaded MeasuredFlatDistance |
The flat distance of the on-dump loaded leg, measured along the path. |
400.0 |
| OnDumpCycleLoaded MeasuredFlatTime |
The time spent on flat segments during the on-dump loaded leg. |
0.04 |
| OnDumpCycleLoaded MeasuredUphillDistance |
The uphill distance of the on-dump loaded leg, measured along the path. |
300.0 |
| OnDumpCycleLoaded MeasuredUphillTime |
The time spent on uphill segments during the on-dump loaded leg. |
0.05 |
| OnDumpCycleUnloaded ComponentHorizontalTime |
The horizontal component time of the on-dump unloaded (return) leg. |
0.03 |
| OnDumpCycleUnloaded ComponentVerticalDownTime |
The vertical-down component time of the on-dump unloaded (return) leg. |
0.01 |
| OnDumpCycleUnloaded ComponentVerticalUpTime |
The vertical-up component time of the on-dump unloaded (return) leg. |
0.01 |
| ParcelTotalFuel |
The total fuel consumed to move the parcel, calculated as follows:
|
1349.6 |
| PathInterpolation |
The path interpolation classification used for the haulage calculation. |
NoInterpolation |
| SourceRouteName |
The name of the haulage route at the source end. |
South_Pit_Route |
| SourceSolid |
The name of the source block. |
South_A_220 |
| TimeOnTrolley |
The time spent on trolley assist, stated in hours. |
0.25 |
| TrolleyDistance |
The distance covered using trolley assist, stated in the units specified for your project. |
500.0 |
| WAvgLoadedGradient |
The weighted average gradient of the loaded leg across the full cycle, stated as a percentage. |
8.5 |
| WAvgLoadedMeasured DownhillGradient |
The weighted average gradient of the downhill segments of the loaded leg, stated as a percentage. |
-6.2 |
| WAvgLoadedMeasured FlatGradient |
The weighted average gradient of the flat segments of the loaded leg, stated as a percentage. |
0.5 |
| WAvgLoadedMeasured UphillGradient |
The weighted average gradient of the uphill segments of the loaded leg, stated as a percentage. |
10.3 |



Note: The pivot might also include dynamically defined parcel reporting items (such as grade fields) that appear as additional numeric columns, and an optional Description field when provided via model or aggregate enrichment.
Parcel Table fields in Origin Solids
The Parcel Table data source in Origin Solids pivot reporting contains detailed records of material movement from source solids to destinations across scheduled periods. Each record represents a parcel of material moved during a specific period, including source and destination information, material quantities, and optionally equipment haulage data. You can configure additional dynamic reporting items in your setup.
The universal reporting attributes for this data source are as follows:
| Reporting attribute | Description | Example value |
|---|---|---|
| Bench | The bench elevation of the source solid, stated in the units specified for your project. | 220.0 |
| DestinationName | The name of the destination that the material was sent to. | Mill_01 |
| DestinationSolidName |
The name of the destination solid. Note: This field is only set when the DestinationType is a stockpile or waste dump. |
South_A_220 |
| DestinationType | The type of the destination for the material. Available destination types include Mill, Stockpile, OverflowStockpile, and Waste. | Mill |
| DiggerHours | The number of digger hours attributed to moving this parcel. | 1.5 |
| EndDateFull | The end date of the period, formatted as YYYY-MM-DD. | 2025-12-31 |
| EndDateMonth | The month of the period end date, stated in the range 1–12. | 12 |
| EndDateYear | The year of the period end date, formatted as YYYY. | 2025 |
| ModelName | The name of the source solid model. | Strategic_Model |
| OriginalDestination | The name of the destination before any redirect was applied. If the parcel was not redirected, this matches the DestinationName. | Mill_01 |
| OriginalDestinationType | The destination type before any redirect was applied. If the parcel was not redirected, this matches the DestinationType. | Mill |
| ParcelName | The name of the parcel. | ORE |
| ParcelSwelledVolume | The volume of the parcel after applying the swell factor. | 2600.0 |
| ParcelTonnes | The mass of the parcel, stated in tonnes. | 5200.0 |
| ParcelVolume | The in-situ (pre-swell) volume of the parcel. | 2000.0 |
| Period | The reporting period that the record was generated within. The value shown in the pivot uses 1‑based numbering, meaning the first period is shown as 1 rather than 0. | 3 |
| PeriodName | The name of the period, derived from the setup calendar. | Year 3 |
| Proportion | The proportion of the solid that was completed. This attribute can give numbers higher than 1 in scenarios with multiple parcels. Further breakdown reports by parcel to see the value. | 0.65 |
| Rank | The sequence rank indicating the order in which the material was scheduled. | 12 |
| Redirected | Whether the parcel was redirected from its original destination. | false |
| RedirectType | The reason or type of redirect that was applied. Empty if the parcel was not redirected. | Capacity |
| Schedule |
The name of the source schedule. Note: This field is added by the pivot when multiple schedules are present. |
Schedule_1 |
| SourceName | The name of the source of the material (either the name of a pit or stockpile). | South_Pit |
| SourceSolid | The name of the source solid. | South_A_220 |
| Stage |
The stage value of the source of the material, either defined on the model or with the Stage Override option. See also: Stage Override in Origin Solids setup configuration |
South_A |
| StartDateFull | The start date of the period, formatted as YYYY-MM-DD. | 2025-01-01 |
| StartDateMonth | The month of the period start date, stated in the range 1–12. | 1 |
| StartDateYear | The year of the period start date, formatted as YYYY. | 2025 |
| UsedDigger | The index of the digger used to extract the material. | 1 |
| UsedDiggerName | The name of the digger used to extract the material. | Shovel_01 |
The reporting attributes applicable only to Equipment setups are as follows:
| Reporting attribute | Description | Example value |
|---|---|---|
| CycleDistance |
The total cycle distance (loaded and unloaded legs combined). |
12400.0 |
| CycleLoadedComponent HorizontalDistance |
The horizontal component of the total loaded leg distance. |
5200.0 |
| CycleLoadedComponent VerticalDownDistance |
The vertical-down component of the total loaded leg distance. |
120.0 |
| CycleLoadedComponent VerticalUpDistance |
The vertical-up component of the total loaded leg distance. |
40.0 |
| CycleLoadedMeasured DownhillDistance |
The downhill distance of the total loaded leg, measured along the path. |
1800.0 |
| CycleLoadedMeasured FlatDistance |
The flat distance of the total loaded leg, measured along the path. |
3200.0 |
| CycleLoadedMeasured UphillDistance |
The uphill distance of the total loaded leg, measured along the path. |
1200.0 |
| CycleTimeInMinutes |
The average time, in minutes, for a truck to complete a full cycle from source to destination and back, calculated as follows:
|
22.4 |
| DestinationArea |
The area label of the destination. |
ProcessPlant |
| DestinationBench |
The bench or elevation at the destination. |
180.0 |
| DestinationRouteName |
The name of the haulage route at the destination end. |
Mill_Route |
| ExPitCycleDistance |
The ex-pit (between pit exit and dump area) cycle distance. |
6200.0 |
| ExPitCycleLoaded ComponentHorizontalDistance |
The horizontal component of the ex-pit loaded leg distance. |
2800.0 |
| ExPitCycleLoaded ComponentVerticalDownDistance |
The vertical-down component of the ex-pit loaded leg distance. |
50.0 |
| ExPitCycleLoaded ComponentVerticalUpDistance |
The vertical-up component of the ex-pit loaded leg distance. |
20.0 |
| ExPitCycleLoaded MeasuredDownhillDistance |
The downhill distance of the ex-pit loaded leg, measured along the path. |
800.0 |
| ExPitCycleLoaded MeasuredDownhillTime |
The time spent on downhill segments during the ex-pit loaded leg. |
0.08 |
| ExPitCycleLoaded MeasuredFlatDistance |
The flat distance of the ex-pit loaded leg, measured along the path. |
1800.0 |
| ExPitCycleLoaded MeasuredFlatTime |
The time spent on flat segments during the ex-pit loaded leg. |
0.12 |
| ExPitCycleLoaded MeasuredUphillDistance |
The uphill distance of the ex-pit loaded leg, measured along the path. |
500.0 |
| ExPitCycleLoaded MeasuredUphillTime |
The time spent on uphill segments during the ex-pit loaded leg. |
0.15 |
| ExPitCycleUnloaded ComponentHorizontalTime |
The horizontal component time of the ex-pit unloaded (return) leg. |
0.10 |
| ExPitCycleUnloaded ComponentVerticalDownTime |
The vertical-down component time of the ex-pit unloaded (return) leg. |
0.02 |
| ExPitCycleUnloaded ComponentVerticalUpTime |
The vertical-up component time of the ex-pit unloaded (return) leg. |
0.04 |
| FuelPerCycle |
The fuel consumed per haulage cycle, calculated as follows:
|
45.2 |
| FuelPerHour |
The average rate of truck fuel consumption over the travelled path, given in the units specified for your project per hour. |
120.5 |
| Hours |
The total number of hours that a truck spent hauling the parcel (driving and loading time, not including spot or dump times). |
11.2 |
| InPitCycleDistance |
The in-pit cycle distance. |
4000.0 |
| InPitCycleLoaded ComponentHorizontalDistance |
The horizontal component of the in-pit loaded leg distance. |
1600.0 |
| InPitCycleLoaded ComponentVerticalDownDistance |
The vertical-down component of the in-pit loaded leg distance. |
60.0 |
| InPitCycleLoaded ComponentVerticalUpDistance |
The vertical-up component of the in-pit loaded leg distance. |
10.0 |
| InPitCycleLoaded MeasuredDownhillDistance |
The downhill distance of the in-pit loaded leg, measured along the path. |
600.0 |
| InPitCycleLoaded MeasuredDownhillTime |
The time spent on downhill segments during the in-pit loaded leg. |
0.05 |
| InPitCycleLoaded MeasuredFlatDistance |
The flat distance of the in-pit loaded leg, measured along the path. |
1000.0 |
| InPitCycleLoaded MeasuredFlatTime |
The time spent on flat segments during the in-pit loaded leg. |
0.07 |
| InPitCycleLoaded MeasuredUphillDistance |
The uphill distance of the in-pit loaded leg, measured along the path. |
400.0 |
| InPitCycleLoaded MeasuredUphillTime |
The time spent on uphill segments during the in-pit loaded leg. |
0.10 |
| InPitCycleUnloaded ComponentHorizontalTime |
The horizontal component time of the in-pit unloaded (return) leg. |
0.06 |
| InPitCycleUnloaded ComponentVerticalDownTime |
The vertical-down component time of the in-pit unloaded (return) leg. |
0.01 |
| InPitCycleUnloaded ComponentVerticalUpTime |
The vertical-up component time of the in-pit unloaded (return) leg. |
0.03 |
| NumberOfCycles |
The number of truck cycles required to move the parcel. Partial cycles indicate that the remaining proportion of the cycle would be used for the next parcel. |
30.0 |
| OnDumpCycleDistance |
The on-dump (within the dump area) cycle distance. |
2200.0 |
| OnDumpCycleLoaded ComponentHorizontalDistance |
The horizontal component of the on-dump loaded leg distance. |
800.0 |
| OnDumpCycleLoaded ComponentVerticalDownDistance |
The vertical-down component of the on-dump loaded leg distance. |
10.0 |
| OnDumpCycleLoaded ComponentVerticalUpDistance |
The vertical-up component of the on-dump loaded leg distance. |
10.0 |
| OnDumpCycleLoaded MeasuredDownhillDistance |
The downhill distance of the on-dump loaded leg, measured along the path. |
400.0 |
| OnDumpCycleLoaded MeasuredDownhillTime |
The time spent on downhill segments during the on-dump loaded leg. |
0.03 |
| OnDumpCycleLoaded MeasuredFlatDistance |
The flat distance of the on-dump loaded leg, measured along the path. |
400.0 |
| OnDumpCycleLoaded MeasuredFlatTime |
The time spent on flat segments during the on-dump loaded leg. |
0.04 |
| OnDumpCycleLoaded MeasuredUphillDistance |
The uphill distance of the on-dump loaded leg, measured along the path. |
300.0 |
| OnDumpCycleLoaded MeasuredUphillTime |
The time spent on uphill segments during the on-dump loaded leg. |
0.05 |
| OnDumpCycleUnloaded ComponentHorizontalTime |
The horizontal component time of the on-dump unloaded (return) leg. |
0.03 |
| OnDumpCycleUnloaded ComponentVerticalDownTime |
The vertical-down component time of the on-dump unloaded (return) leg. |
0.01 |
| OnDumpCycleUnloaded ComponentVerticalUpTime |
The vertical-up component time of the on-dump unloaded (return) leg. |
0.01 |
| ParcelTotalFuel |
The total fuel consumed to move the parcel, calculated as follows:
|
1349.6 |
| PathInterpolation |
The path interpolation classification used for the haulage calculation. |
NoInterpolation |
| SourceRouteName |
The name of the haulage route at the source end. |
South_Pit_Route |
| UsedTruck |
The index of the truck used to haul the material. |
2 |
| UsedTruckName |
The name of the truck used to haul the material. |
CAT_789D |
| WAvgLoadedGradient |
The weighted average gradient of the loaded leg across the full cycle, stated as a percentage. |
8.5 |
| WAvgLoadedMeasured DownhillGradient |
The weighted average gradient of the downhill segments of the loaded leg, stated as a percentage. |
-6.2 |
| WAvgLoadedMeasured FlatGradient |
The weighted average gradient of the flat segments of the loaded leg, stated as a percentage. |
0.5 |
| WAvgLoadedMeasured UphillGradient |
The weighted average gradient of the uphill segments of the loaded leg, stated as a percentage. |
10.3 |



Note: The pivot might also include dynamically defined parcel reporting items (such as grade fields) that appear as additional numeric columns, and an optional Description field when provided via model or aggregate enrichment.
Pivot exports and visibility
Use the following buttons to perform operations on the pivots displayed in your workspace:
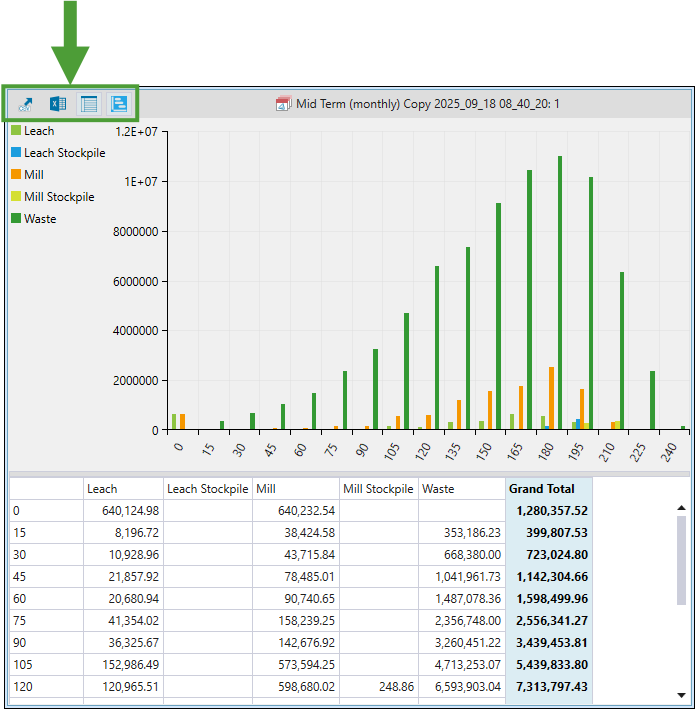

|
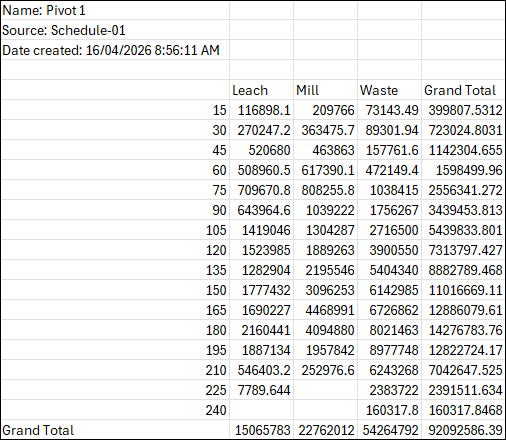
Export the current pivot report to clipboard. This copies the pivot table, including all available decimal places. Example
|

|
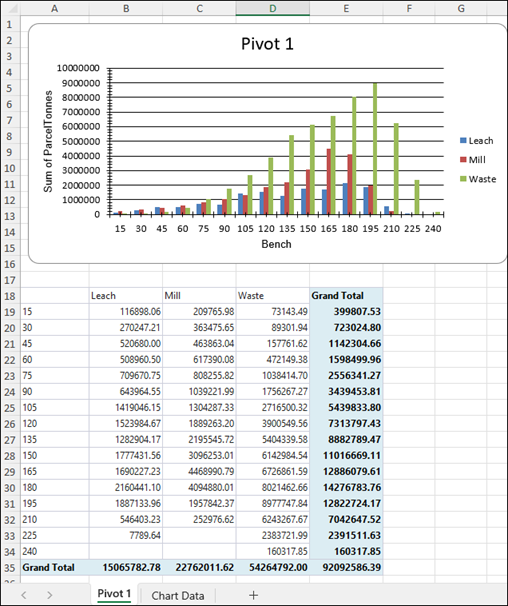
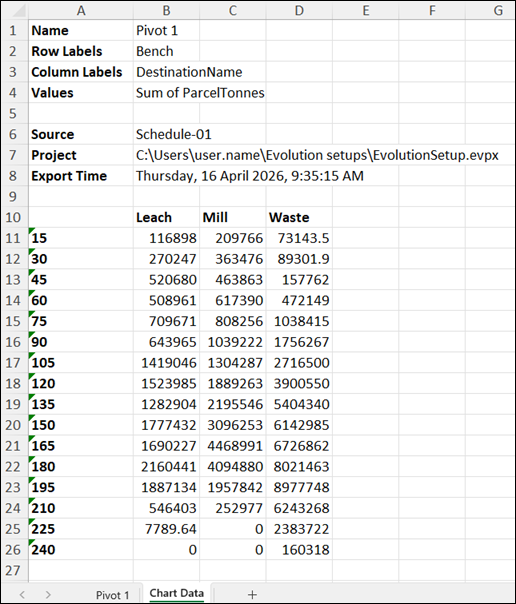
Export your report to an Excel file. After clicking this button, name the file and specify the location under which it should be saved, then click Save to confirm. The pivot is exported as an Excel workbook with two sheets. The first sheet contains the chart and the formatted pivot table with full decimal precision. The second sheet contains the unformatted backing data for the chart. Example
Exported pivot report (sheet 1)
Exported pivot report (sheet 2)
|

|
Toggle the pivot table visibility. |

|
Toggle the pivot chart visibility. |
Customising pivot reports
You can customise the way your pivot reports are displayed by using the controls provided in the Chart tab of the Pivot pane.
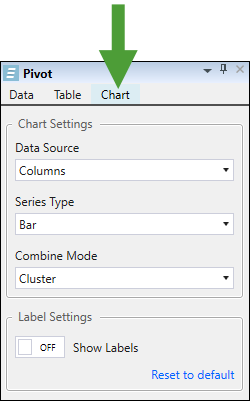
Use the following drop-downs to apply the required chart settings:
-
Data Source: Set the pivot table axis used as the data source of the chart series by selecting Columns or Rows.
Columns 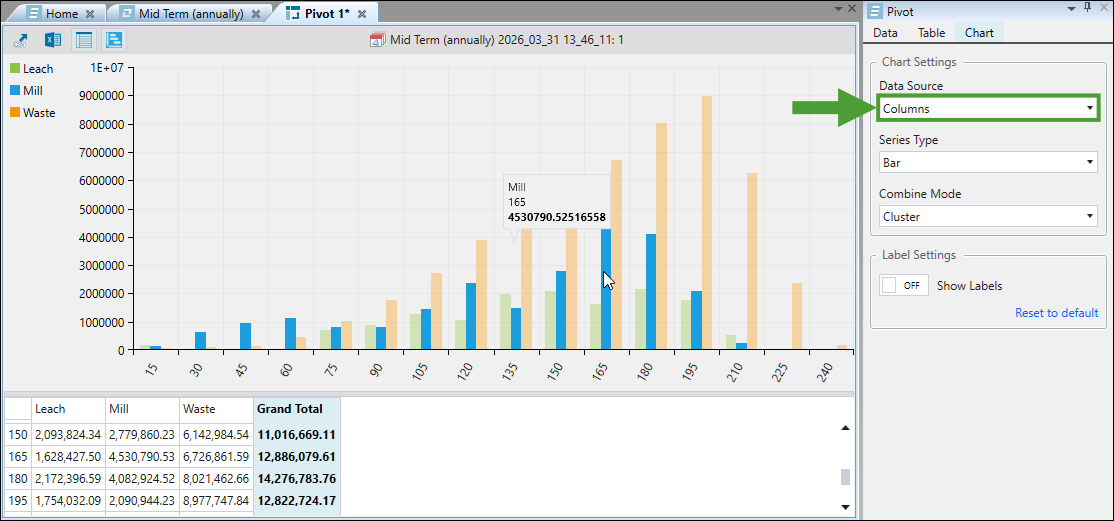
Rows 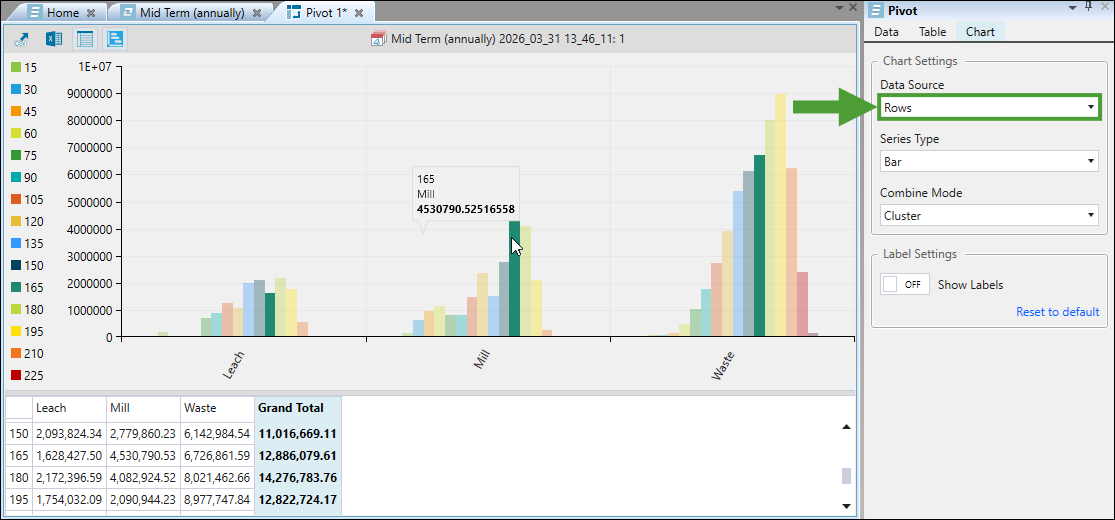
-
Series Type: Set how the chart series should be displayed by selecting Bar, Line, or Area.
Bar 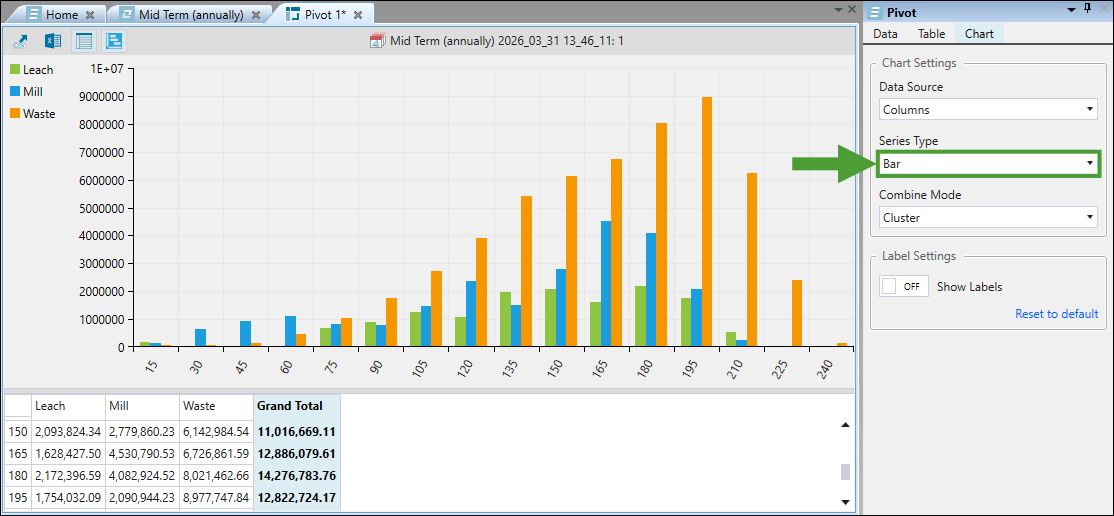
Line 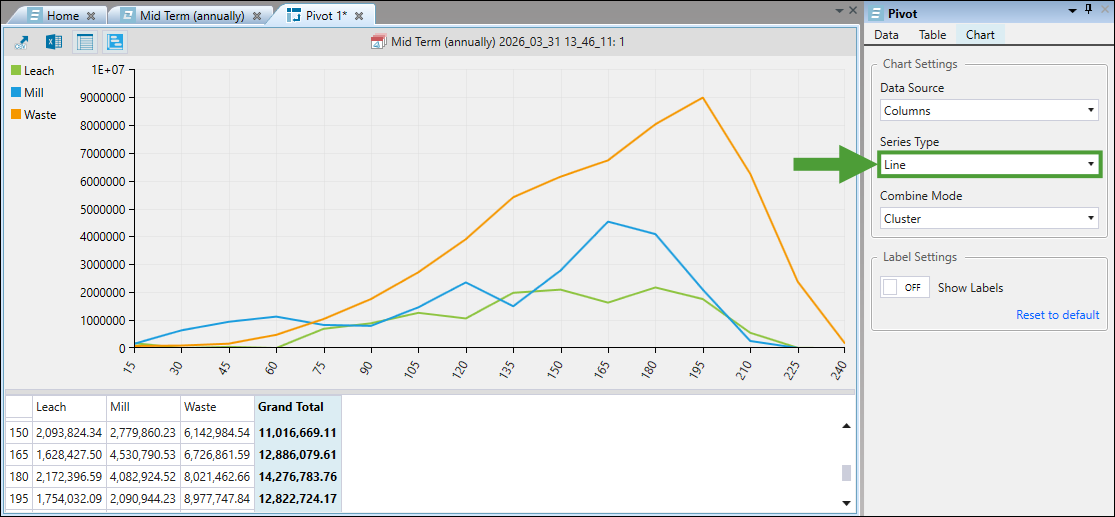
Area 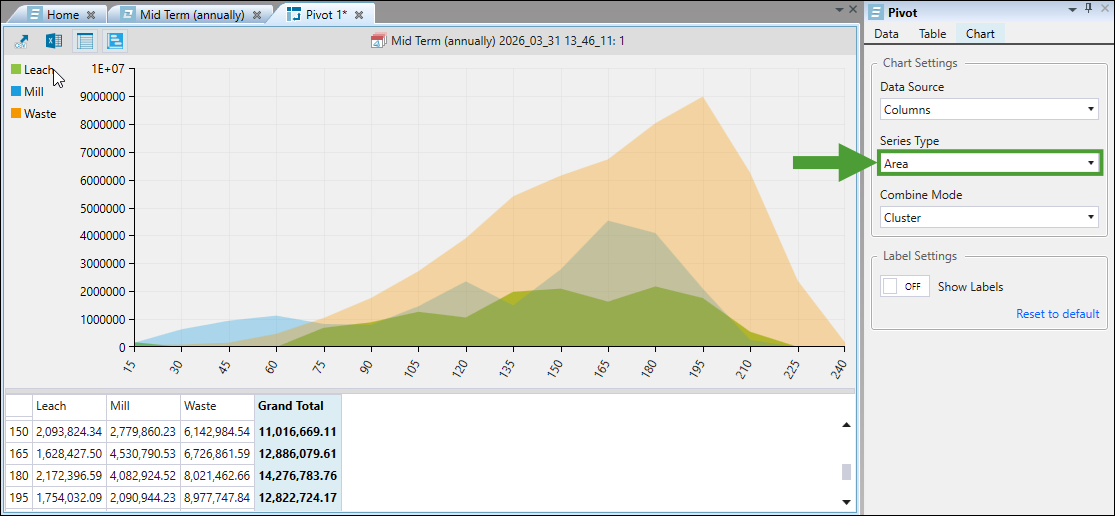
-
Combine Mode: Set how the method used to combine items in the chart series by selecting None, Cluster, Stack, or Stack 100%.
None 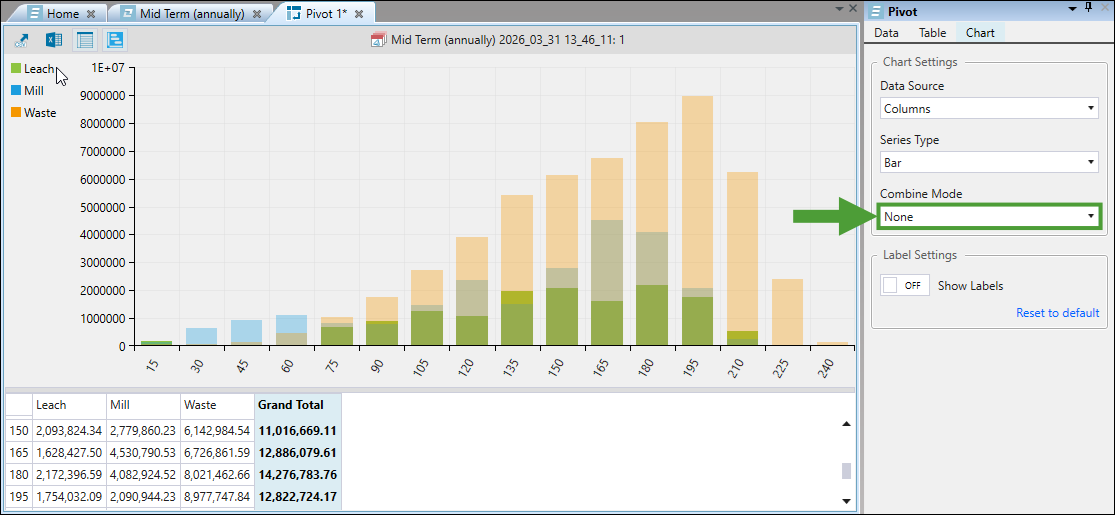
Cluster 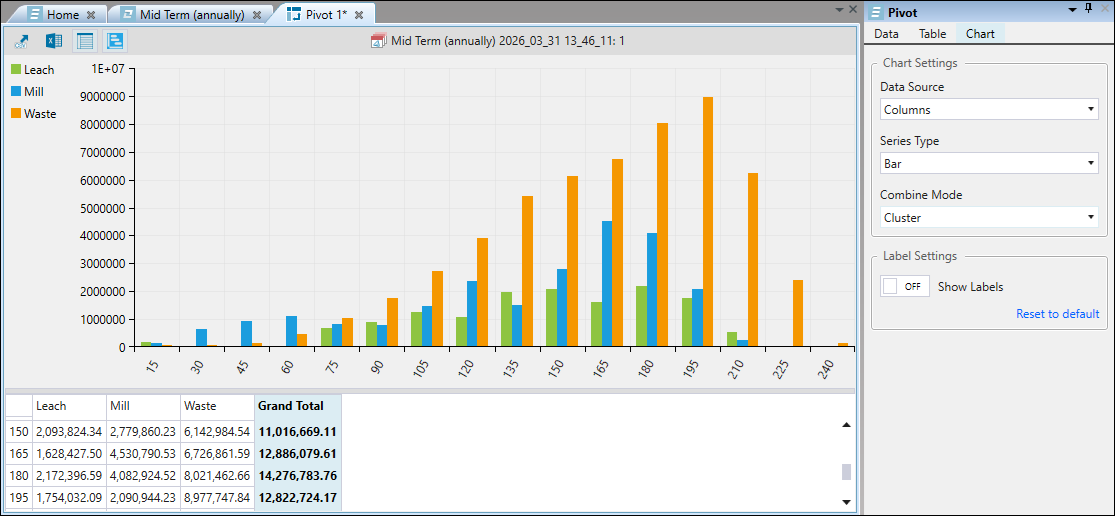
Stack 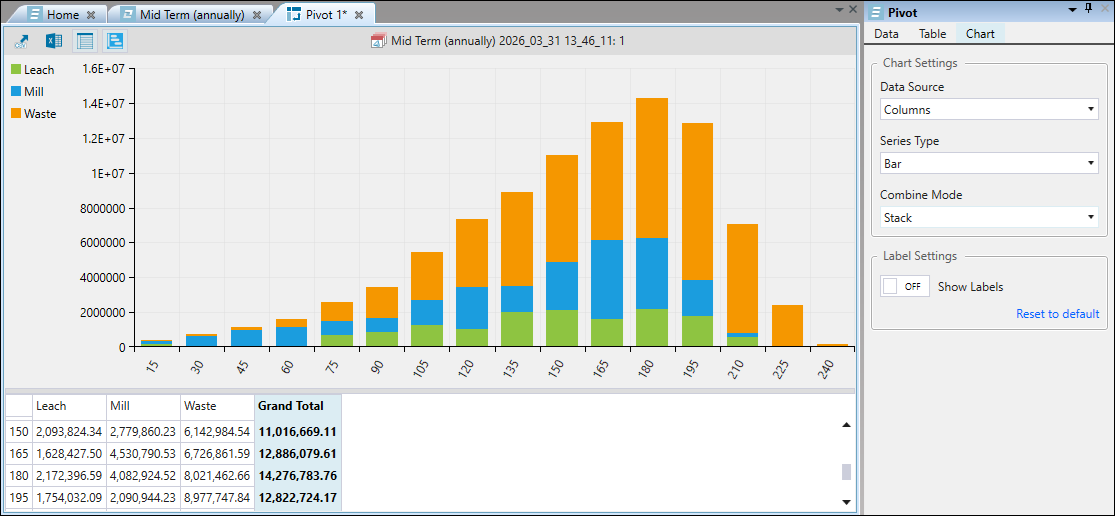
Stack 100% 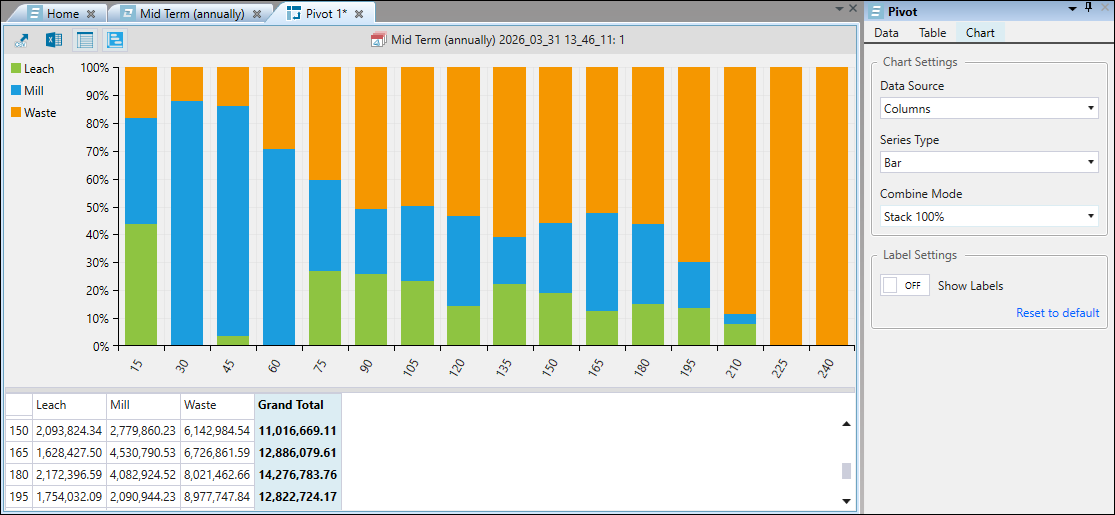
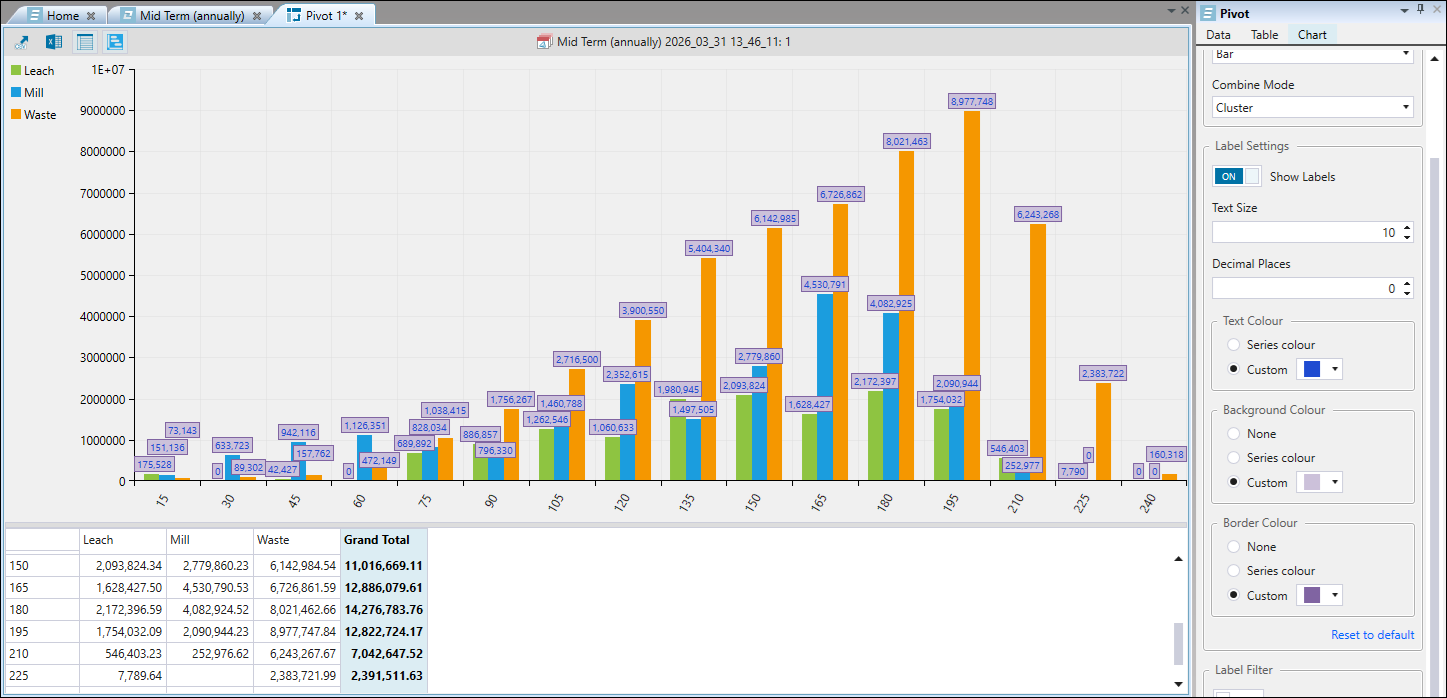
You can also enable and customise pivot chart labels. To do so, click the Show Labels toggle button.
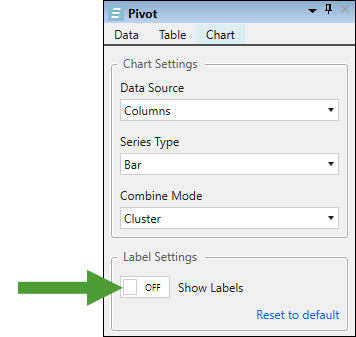
This will add a label with the corresponding value to each chart series.
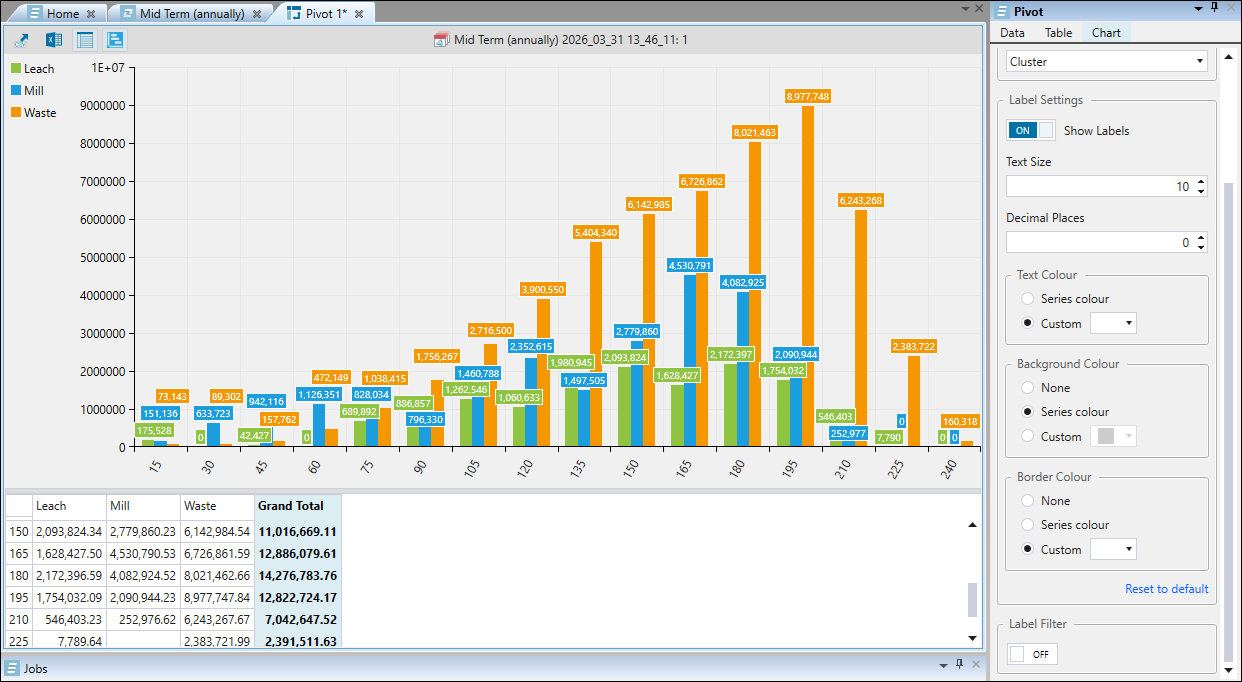
You can customise the labels in your pivot charts by setting the following:
-
Text Size. Enter a value between 8 and 72 pixels to set the label size.
-
Decimal Places. Enter a value between 0 and 15 to set the number of decimal places displayed in each label.
-
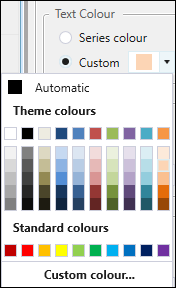
Text Colour. Select Series colour for the labels to have the same colour as the series in your chart or Custom to select a predefined colour.
-
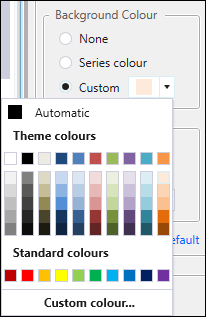
Background colour. Select None for the label background to be transparent, Series colour for the labels to have the same background colour as the series in your chart, or Custom to select a predefined colour.
-
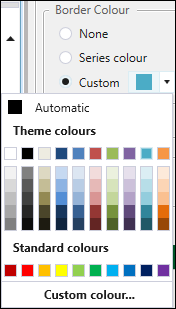
Border Colour. Select None for the label borders to be transparent, Series colour for the labels to have the same border colour as the series in your chart, or Custom to select a predefined colour.
Tip: Click Custom colour... to open the advanced colour picker. Select a color using the preview area on the left, or enter specific color values on the right. To adjust transparency, modify the percentage in the A field. Click OK to apply your selection.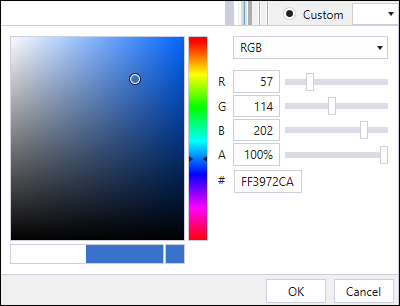
To filter the labels in your view, toggle the Filter Label button, select a mathematical relation from the drop-down, and enter the required value. You can select from the following mathematical relations:
-
== (Equality)
-
!= (Not equal to)
-
> (Greater than)
-
< (Less than)
-
> = (Greater than or equal to)
-
< = (Less than or equal to)
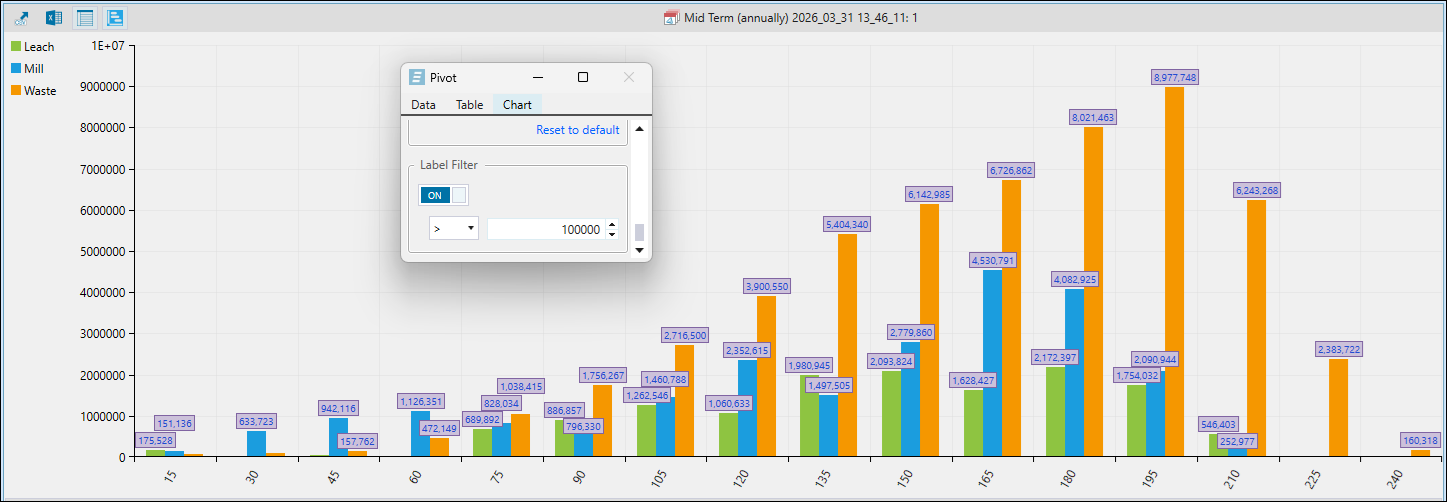
Note: Click Reset to default to revert the label changes you have made. This will reset the view to the default settings applied in the Settings panel. See Pivot Label Defaults for more information.
