Pivot Reporting
Use pivot reports to analyse your generated schedules, as well as solid and block models.
Note: This functionality is not available for dynamic solids pits.
Creating a pivot report
Note: The pivot generation steps outlined in this topic apply to models and schedules generated in the Strategy, Origin Blocks, and Origin Solids modules. To generate and analyse pivot reports in the Epoch module, use the Live Dashboard panel (see Live Dashboard for more information). However, as the Pivot Reporting topic contains general information on pivots in Evolution, we recommend that you familiarise yourself with this content before proceeding with pivot reports in Epoch.
Follow these steps to create a pivot report:
-
Click
 (Add Pivot Report) in the project explorer.
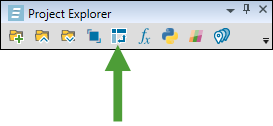
Tip: You can also add a pivot to a specific folder. To do so, right-click on the folder and select
Add Pivot from the context menu.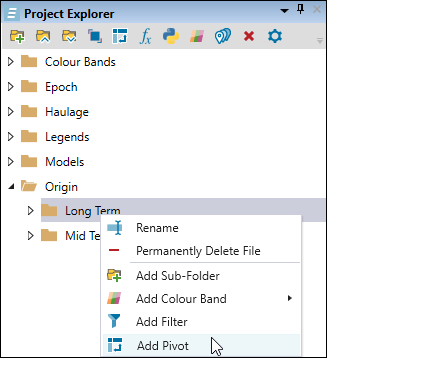
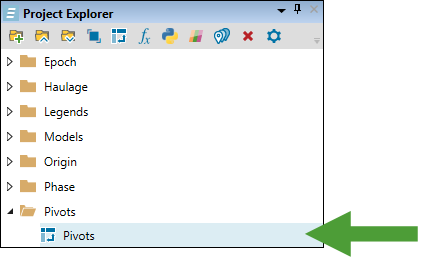
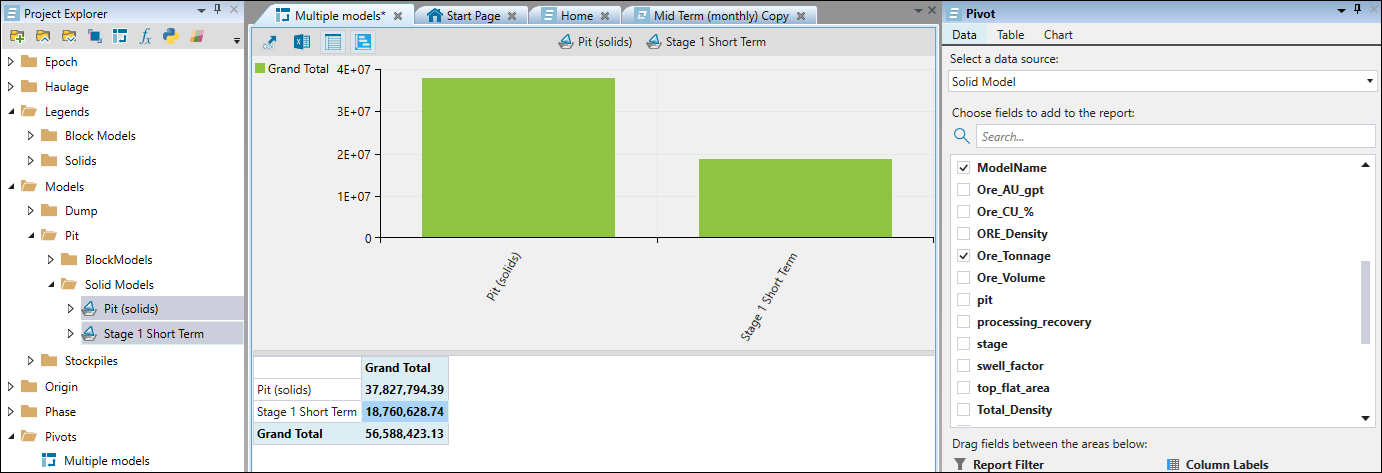
Evolution will place your newly created pivot report in the project explorer and will automatically open it in your workspace.
Tip: To rename a pivot file, right-click the file in the project explorer and select
 Rename… from the context menu (alternatively, press F2). Enter the new name, then either single-click or press Enter to confirm.
 -
Drag and drop the required schedule or model into the workspace.
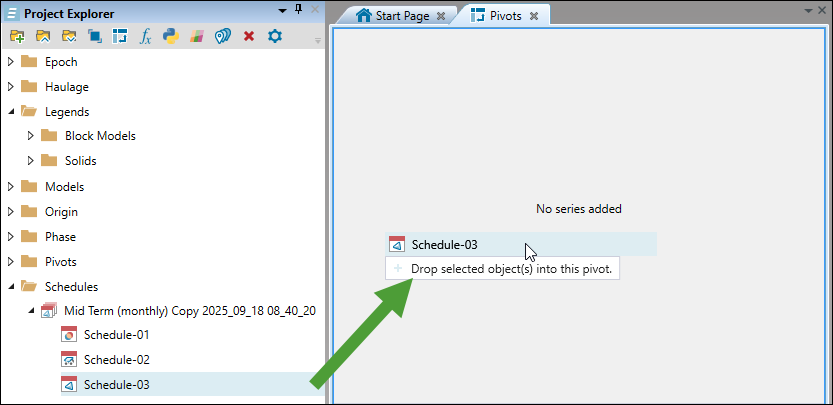
Tip: To add multiple schedules or models to your pivot, select them in your project explorer while pressing Ctrl and then drag them into the workspace.
-
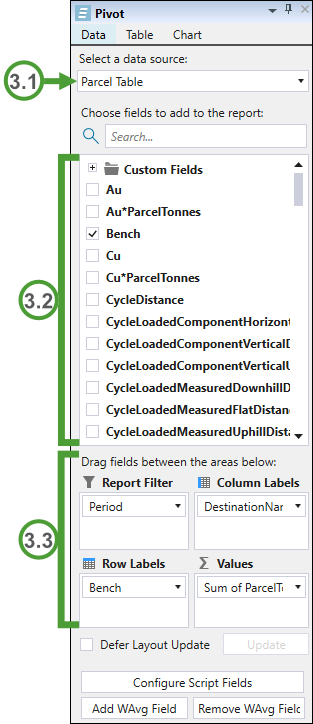
Open the Data tab in the Pivot pane and set the following fields:
-
Select a data source from the drop-down.
Note: The data source types listed in the drop-down will vary depending on the module in which you have configured your setup.
-
Specify the fields to include in your pivot report by selecting the corresponding checkboxes in the list.
-
Drag and drop the selected fields between the following areas:
-
Report Filter: Use if only a subsection of results is relevant. For example, if you only want to identify the amount of tonnes sent to the waste dump, you can filter your data by destination.
-
Column Labels: Headings for the columns in the pivot report.
-
Row Labels: Headings for the rows in the pivot report.
-
Values: Specify the data you want aggregated in each cell. By default, the aggregation type is set to sum.
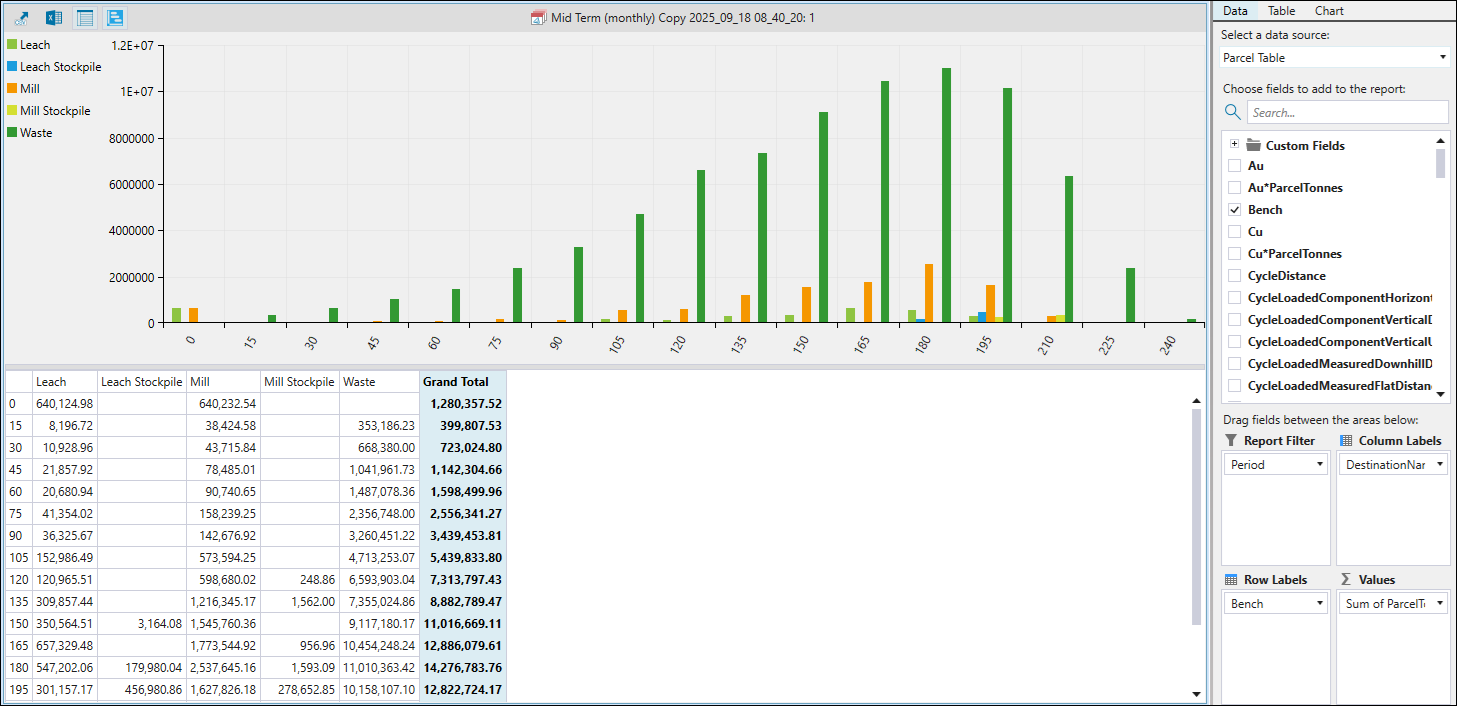
Example: In the example below, we display the per-period number of parcel tonnes sent to each setup destination from each bench.
-
-
-
Optionally, set the following fields in the Pivot pane:
-
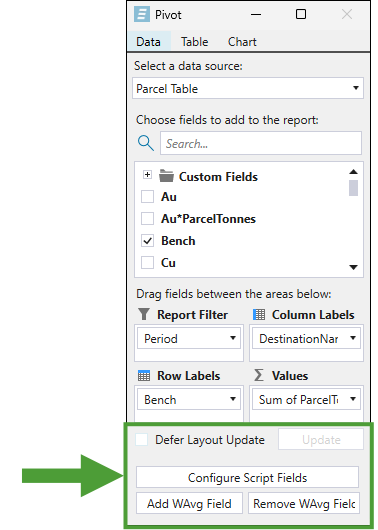
Defer Layout Update. Select the checkbox to make multiple changes to the pivot report without triggering updates after each change.
Note: When you select the checkbox, the Update button will be enabled. Click the button to reflect the changes that you made in the pivot.
-
Configure Script Fields. Click the button to define new script fields using maths scripts. The scripts that you enter will evaluate to numbers.
 Expand for more information on configuring script fields
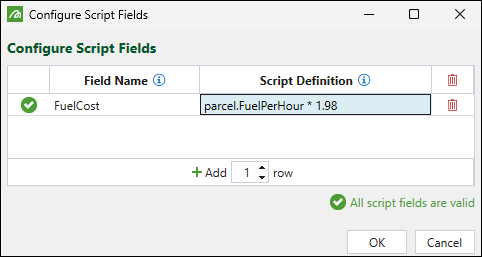
Follow these steps to configure custom script fields for your pivots:
-
Click the Configure Script Fields button at the bottom of the Pivot pane.
-
Click the
 Add (1) row button to add a single row to the table in the panel that appears.
Tip: To add multiple rows at once, enter the required number and click the
button. -
Enter the name for the custom field.
Note: You must assign a unique name, as the field names cannot be duplicated.
-
Enter the script definition.
Note
The following scripting prefixes can be used to access the values of existing fields:solid.
block.
parcel.
Example:
Note: To remove a single script field, click the
 button corresponding to the field that you want to delete. To remove all script fields, click the (Remove all) button in the table header.
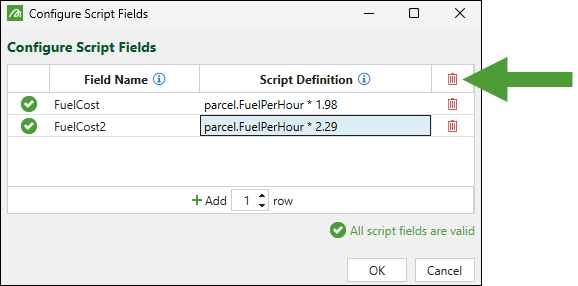
Note: If your script contains any errors, Evolution will display the
 icon on the left-hand side of the table. Additionally, the same icon will appear in the script field if there are any script definition errors. Hover over each icon to see the error details.
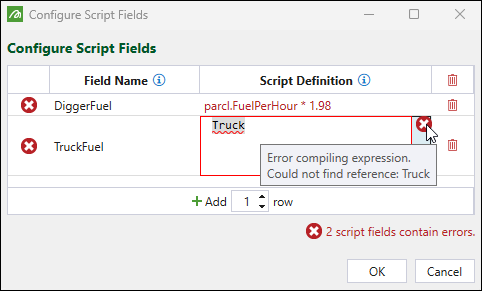
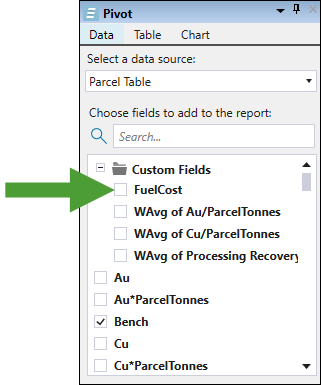
Click OK. The field that you created will be added to the Custom Fields folder in the Pivot pane and will be available only for this pivot.
Note: Script fields can also be referenced by weighted average fields (see Add WAvg Field below for details).
See also: Maths Scripts for Block Models, Maths Scripts for Solid Models
-
-
Add WAvg Field. Create fields to compute values such as average grade, cost, or recovery by factoring in a weight.
Expand for more information on configuring weighted average fields
Follow these steps to configure weighted average fields for your pivots:
-
Click the Add WAvg Field button at the bottom of the Pivot pane.
-
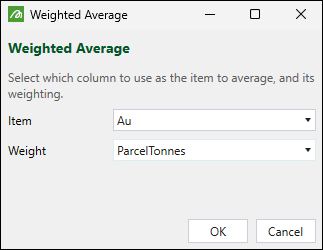
Using the drop-downs, define the field by selecting the required item and weight by which you want the item to be averaged.
-
Click OK.
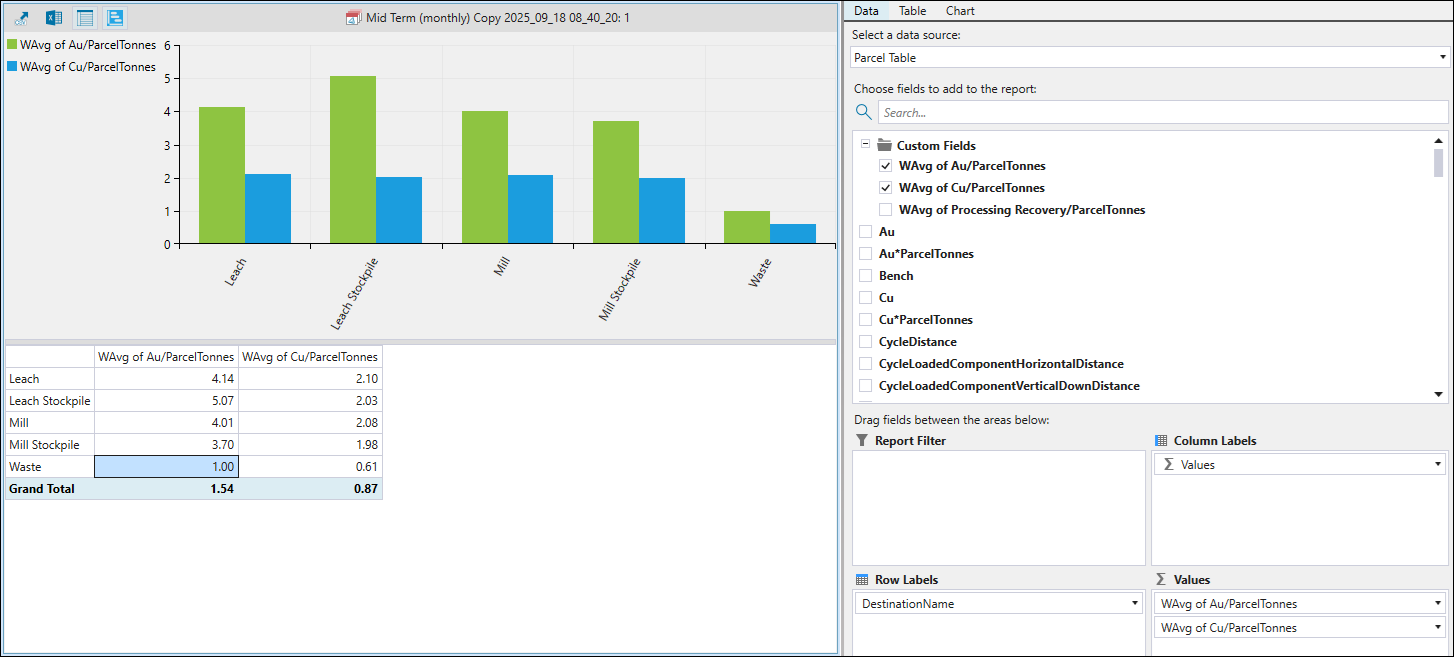
The field that you created will be added to the Custom Fields folder in the Pivot pane and will be available only for this pivot.
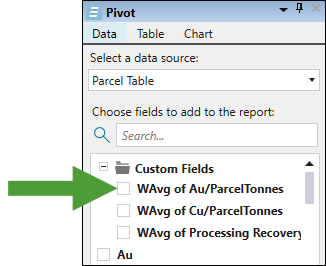
Example: In the example below, we use weighted average fields named WAvg of Au/ParcelTonnes and WAvg of Cu/ParcelTonnes to calculate the grade of gold and copper going to each process node.
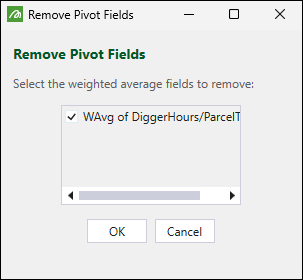
Note: To remove a weighted average field that you created, click the Remove WAvg Field button. Next, in the Remove Pivot Fields panel, select the field you no longer need and click OK.
-
-
Pivot exports and visibility
Use the following buttons to perform operations on the pivots displayed in your workspace:
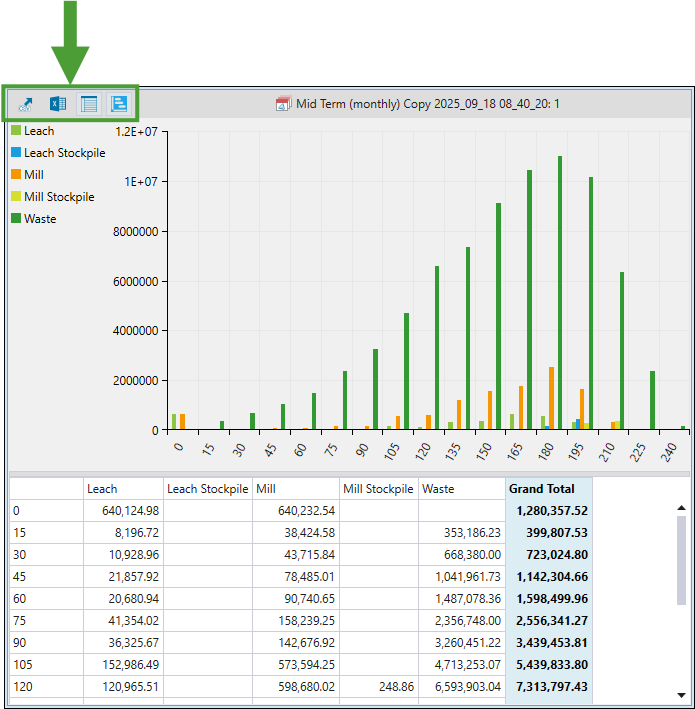
|
|
Copy the current pivot report to the clipboard. |
|
|
Export your report to an Excel file. After clicking this button, name the file and specify the location under which it should be saved. Click Save to confirm. |
|
|
Toggle the visibility of the pivot table. |
|
|
Toggle the visibility of the pivot chart. |
