Use Live Charts
The Live Charts allow you to view the results of Strategy and Origin setups as the jobs are being processed. This can help you check the extent to which the final schedule derived by Evolution satisfies the criteria of your setup.
Follow these steps to access Live Charts:
-
Validate your setup using
 Quick Validate or
  Advanced Validate in the Home ribbon > Scheduling group.
 -
If the validation was successful, click
 Run in the Home ribbon > Scheduling group.
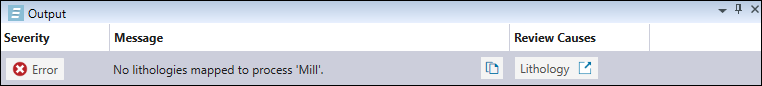
Note: If your setup contains errors that must be addressed before it can be scheduled, Evolution will display a pop-up informing you about it. The errors that you will have to resolve to schedule your setup will be listed in the Output tab at the bottom of your screen.
-
In the Run Setups window, select the setup for which you want the schedule to be generated and click
Run.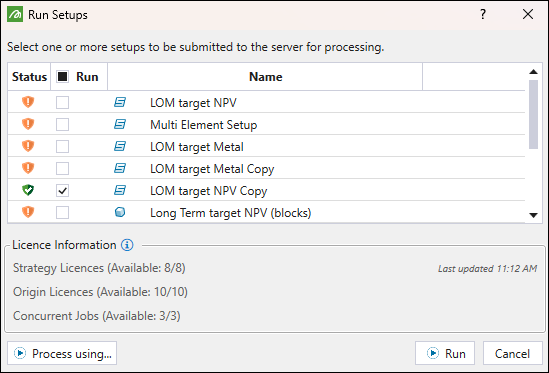
-
While your job is being processed:
-
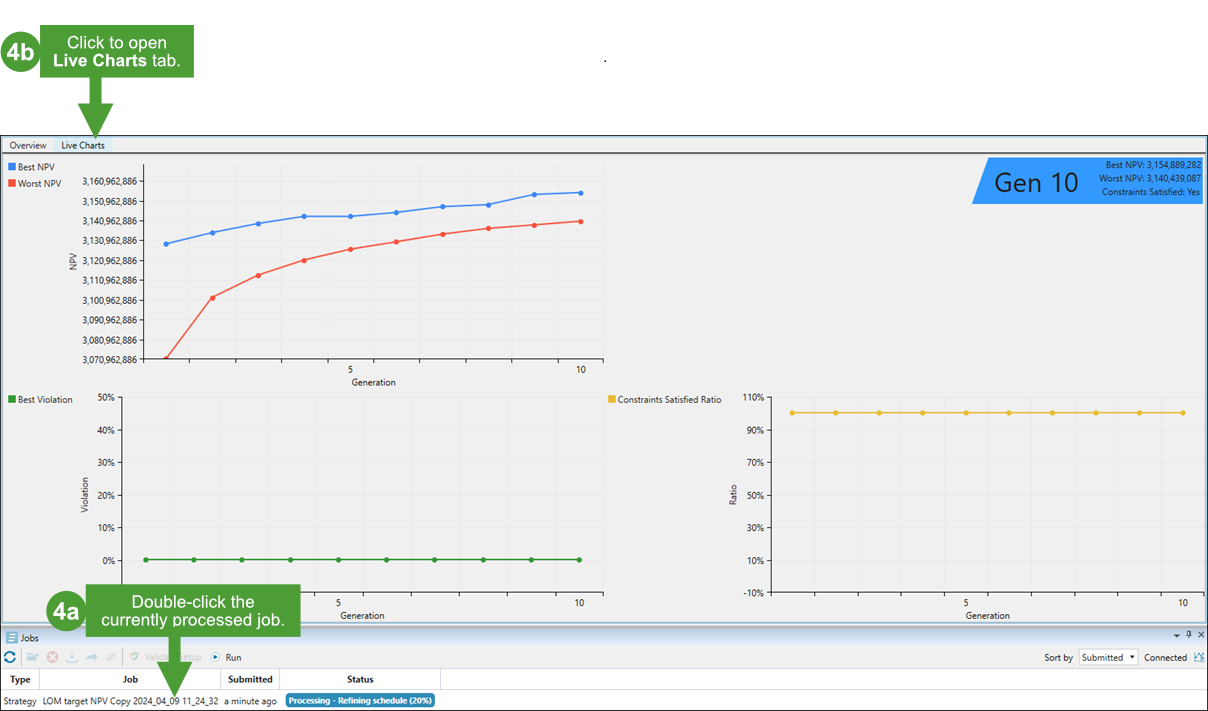
Double-click on the job in the Jobs window.
-
Next, click Live Charts at the top of the view window. You will be able to observe how the charts are being updated in real time as your schedule is generated.
-
For Strategy jobs, Evolution provides the following charts:
-
Best and Worst NPV: Shows the best and worst net present value result for each generation.
-
Best Violation: Shows if your setup violates the targets that you have set.
Note: The violation higher than 0% means that the resources are overused in your setup. On the other hand, a violation lower than 0% means that your setup is not using all its available resources, which results in achieving worse results than possible. That is why achieving the violation of 0% is the most desirable.
-
Constraints Satisfied Ratio: Shows the degree of meeting targets set for the constraints in your setup, with 100% being the most desirable value.
The table below shows how live charts can indicate if a schedule allows you to achieve the best possible outcomes.
| A schedule that will not allow you to achieve the set targets (example) |
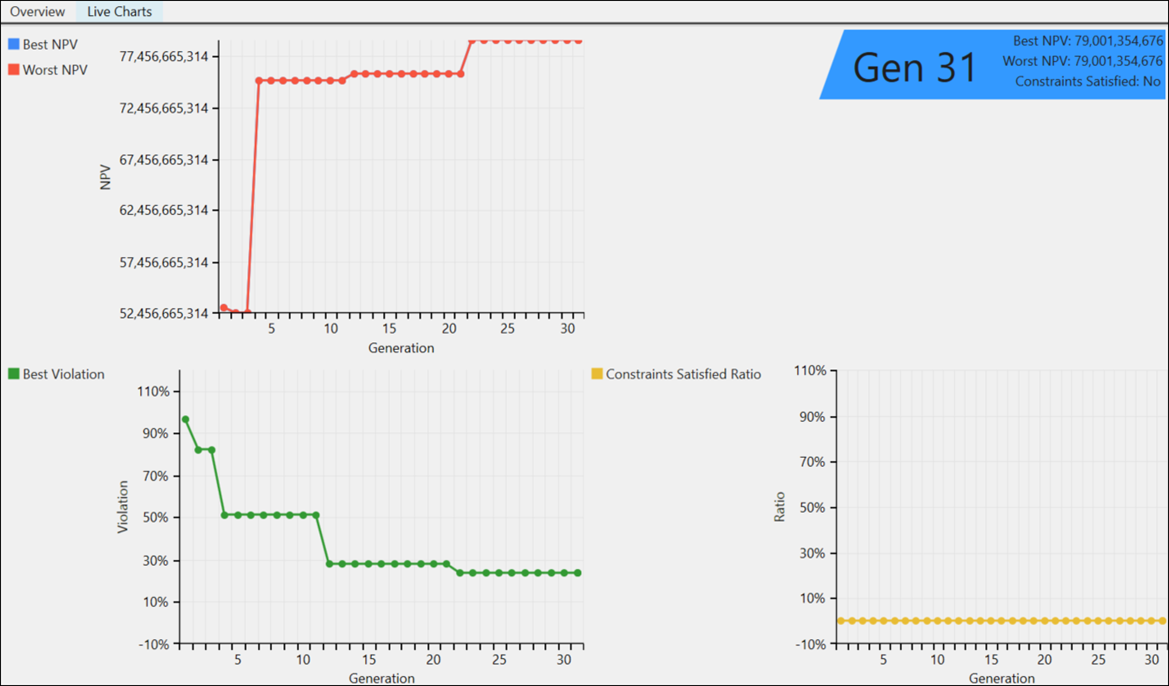
As shown in the image above:
|
| A schedule that meets the set targets (example) |
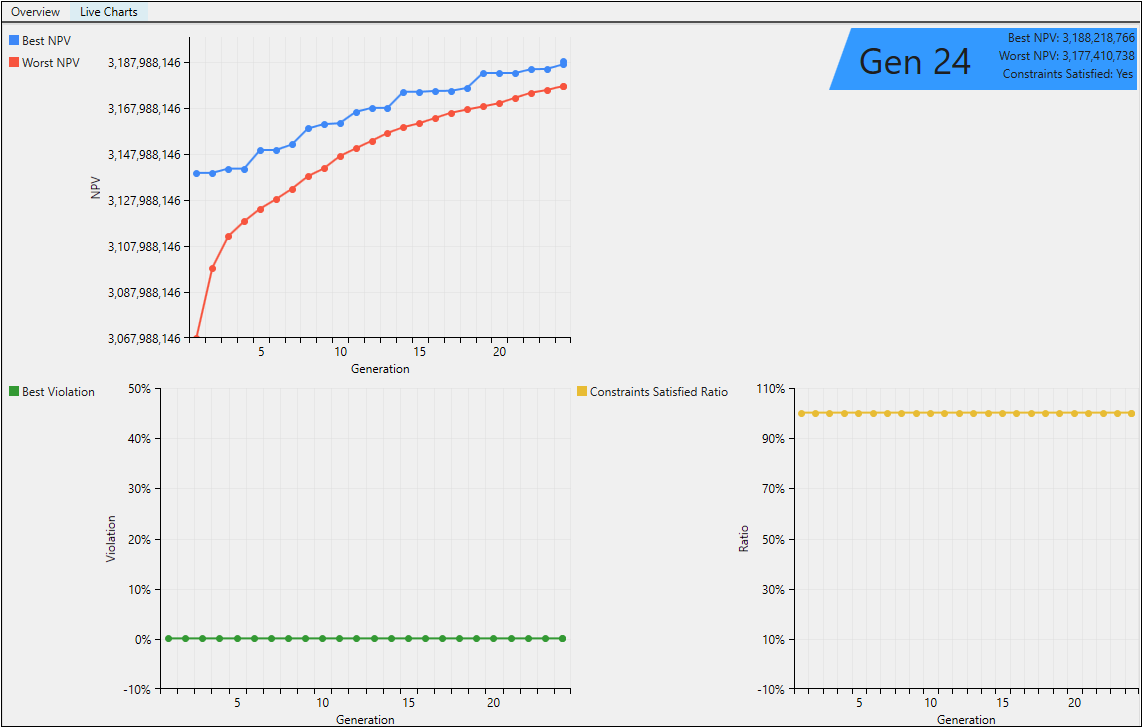
As shown in the image above:
|
See also Engine Parameters for more information on schedule generation algorithms.
