Query Waviness
Waviness in discontinuity analyses results from repeating features of flat and steeper areas perpendicular to the slope in the dip direction (forming a wavy pattern), and effectively providing greater resistance to sliding than a completely flat, steep face. The Query Waviness tool (Geotechnical tab > Analyse group) provides a means of examining and quantifying the roughness of a section of discontinuity. The process involves subdividing the section into patches of nominated sizes for a statistical analysis of waviness along a plunge and trend. A series of cross sections through the region helps to visualise and identify any wave-like patterns. The results can be saved in a PDF document.
Analyse waviness
To query and report on waviness, proceed as follows:
-
Select an area (using any suitable primitive) on a rock face surface

 for analysis.
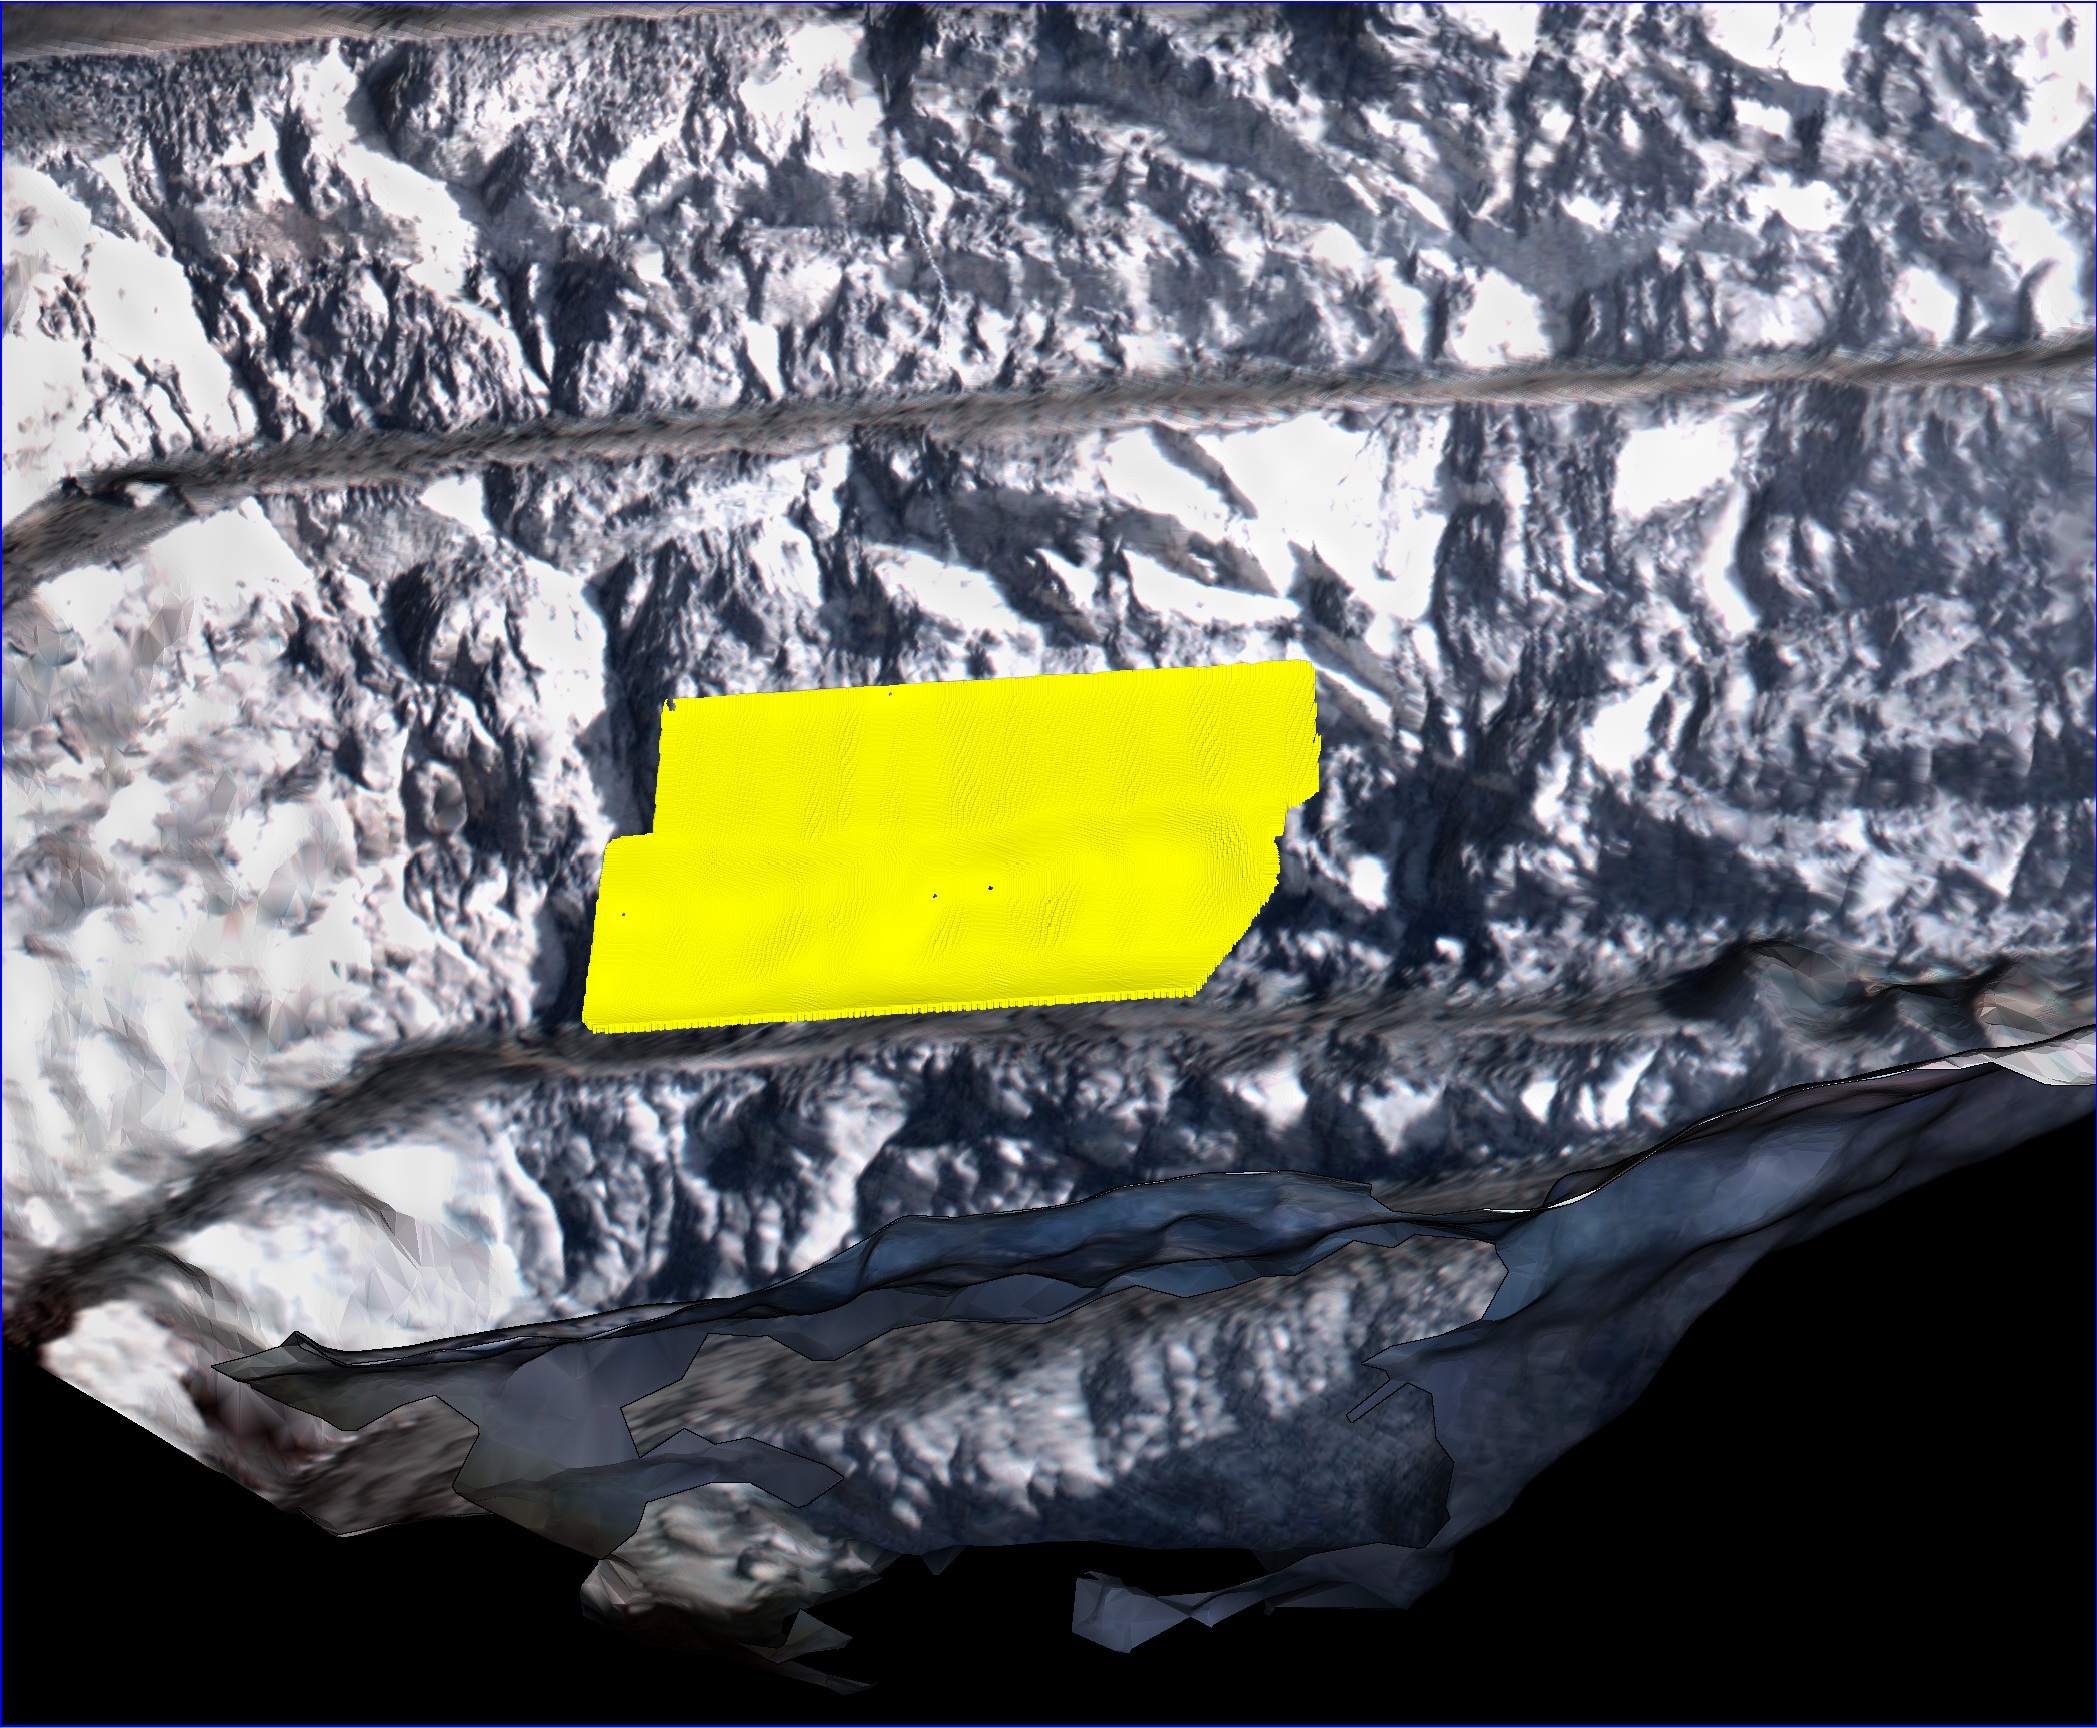
-
On the Geotechnical tab, in the Analyse group, click
 Query Waviness.
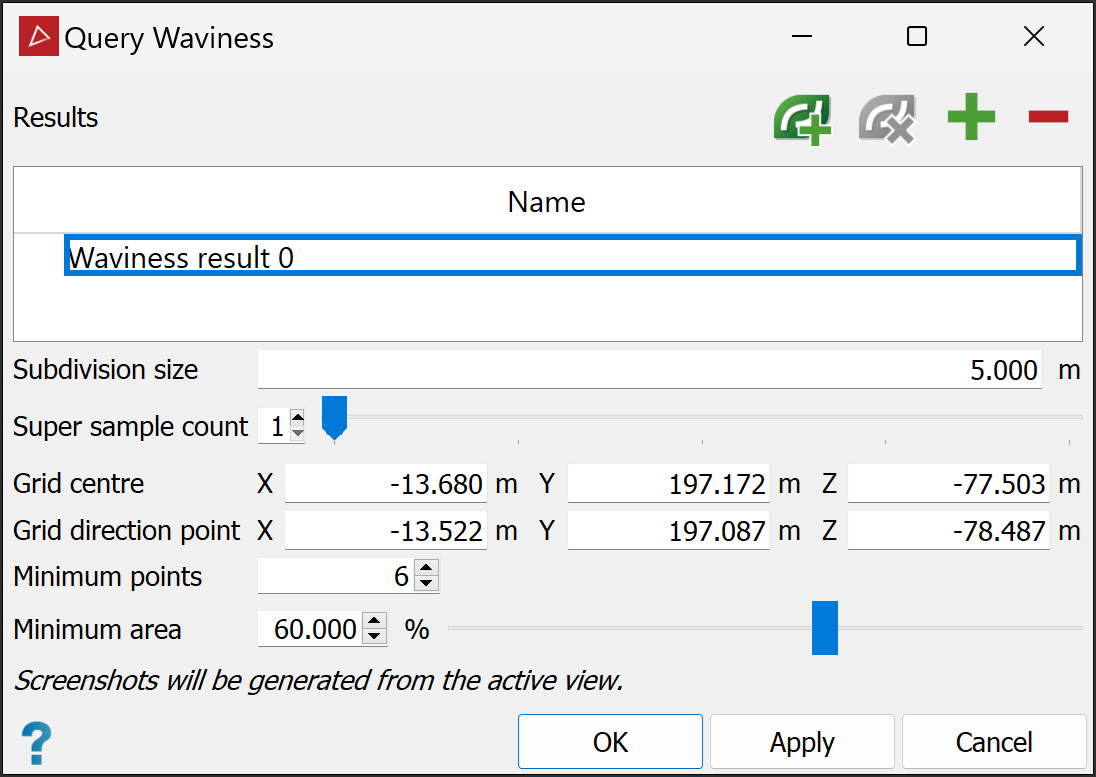
Check and adjust the settings you want to use.
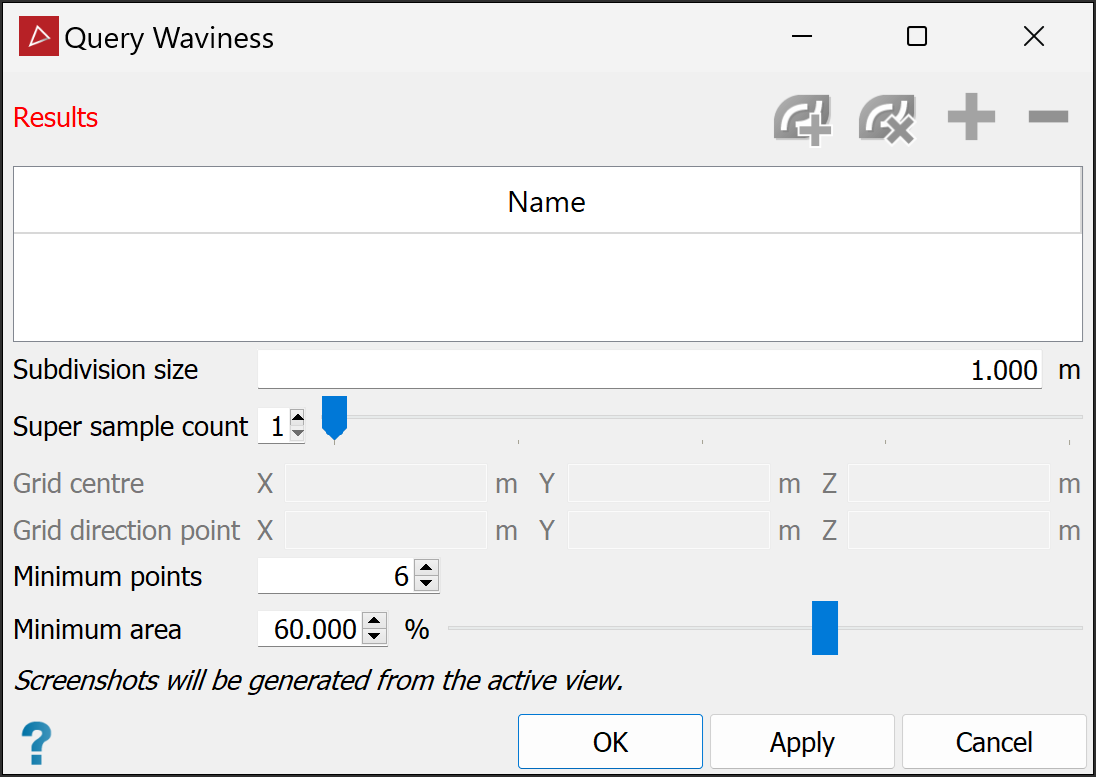
The following settings help to define the size and sensitivity of patches used to examine the variation of slope within the area of interest:
Subdivision size Nominate an appropriate size to divide the area into suitable patches for analysis. The smaller the size, the more sensitive the analysis. Super sample count A method to further refine analyses over the area. Extra subdivision patches are offset between the initial patches providing extra data. Grid centre and Grid direction point These identify the direction of slip and are usually auto-populated for a standard planar sliding case. For a wedge case, you can manipulate the line to coincide with the wedge centre line, which represents the direction of probable slip for a wedge block. Minimum points This figure specifies the minimum number of points required to make the individual plane in the patch. Otherwise the patch is ignored. Minimum area This figure specifies the minimum percentage of area required to make the individual (discontinuity) plane in the patch. Otherwise, if the resultant patch is smaller than this percentage, it is ignored. -
Click the
 button
to add any selected
areas to the Name list. As you
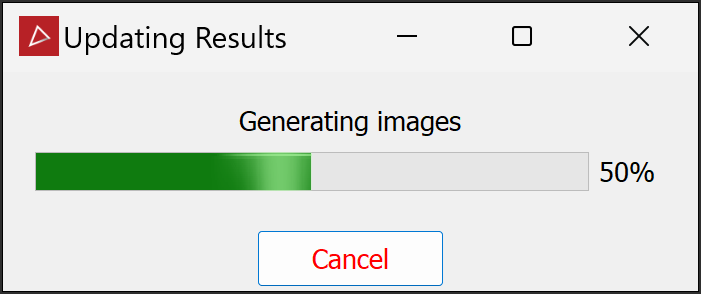
add the area of interest, the Query Waviness tool will calculate waviness while displaying a progress
bar. It will also generate report images in the background.
button
to add any selected
areas to the Name list. As you
add the area of interest, the Query Waviness tool will calculate waviness while displaying a progress
bar. It will also generate report images in the background.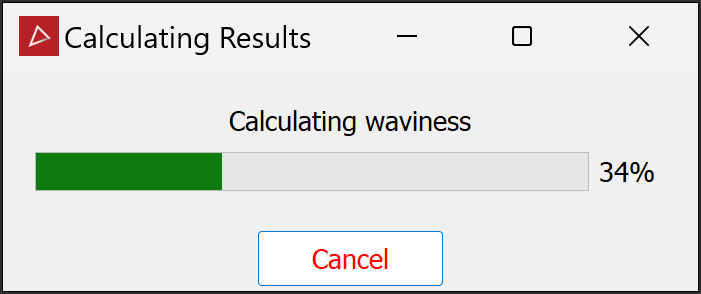
The waviness result appears in the Name list of the Query Waviness tool panel.
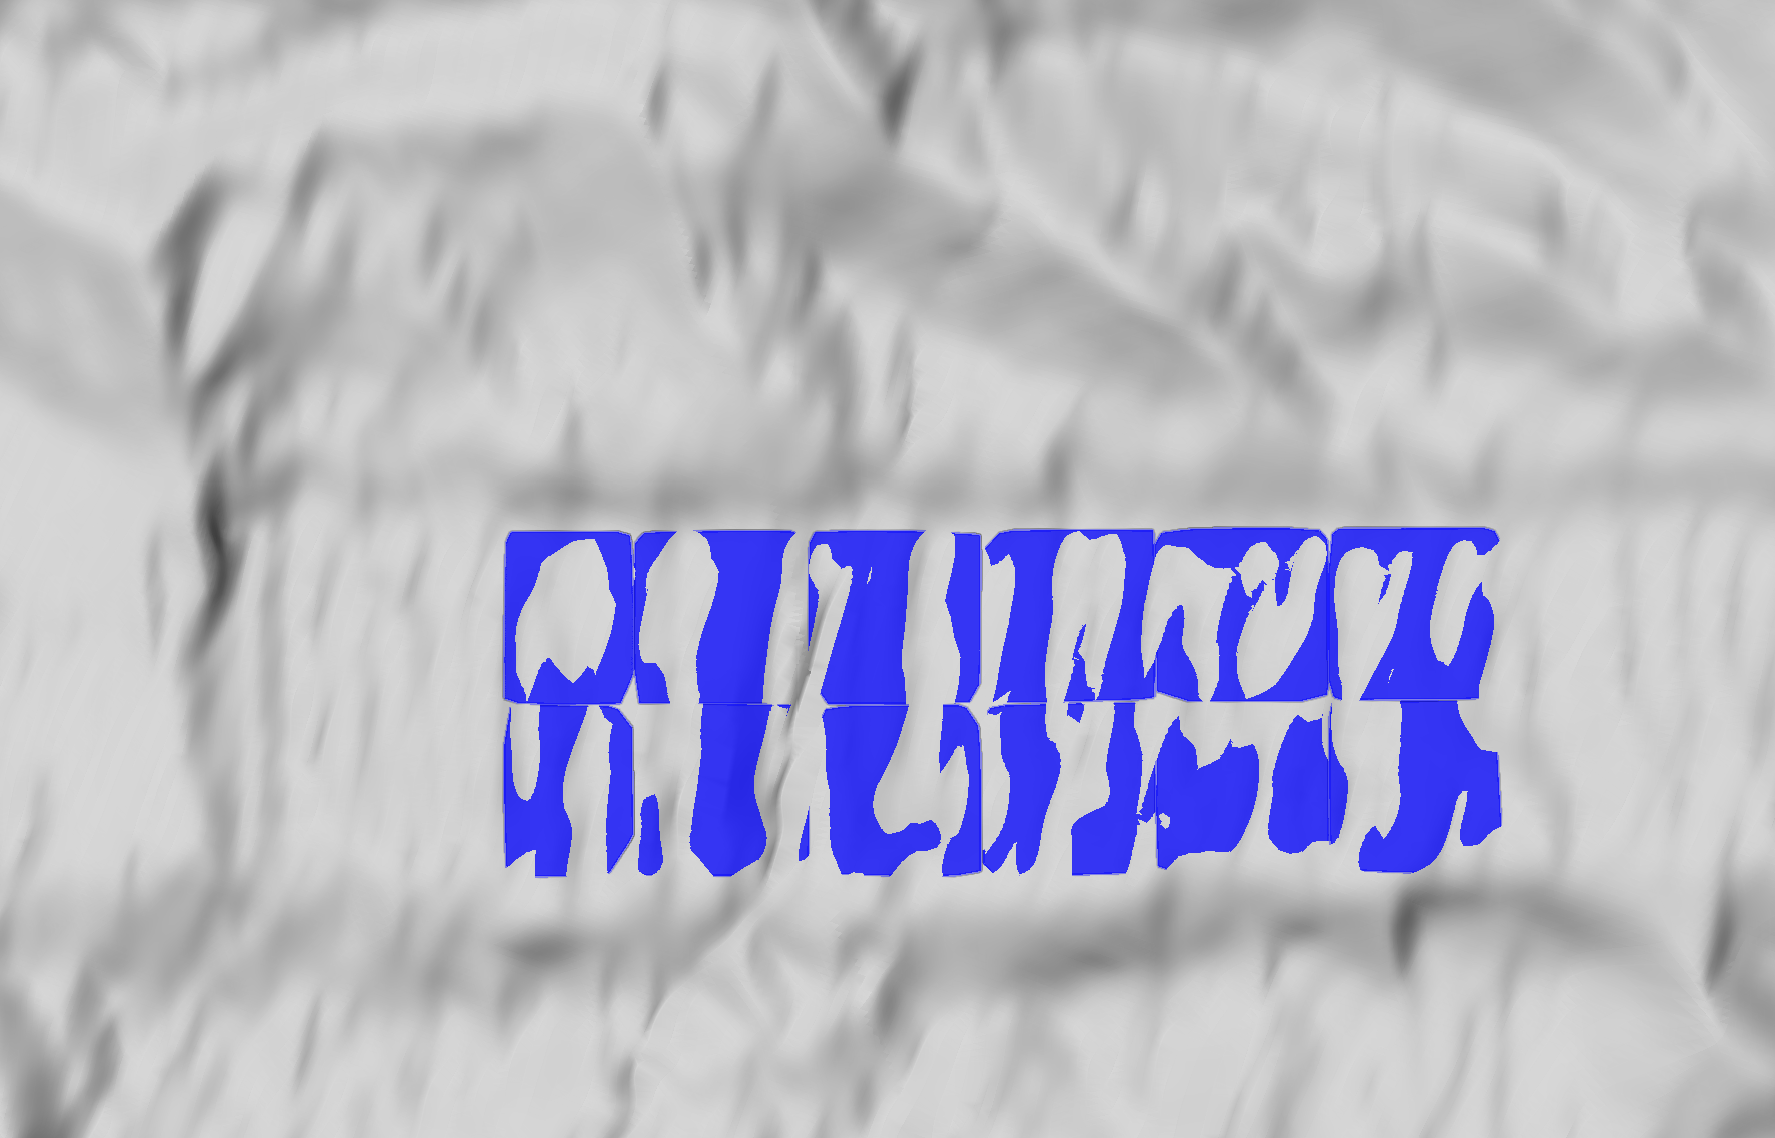
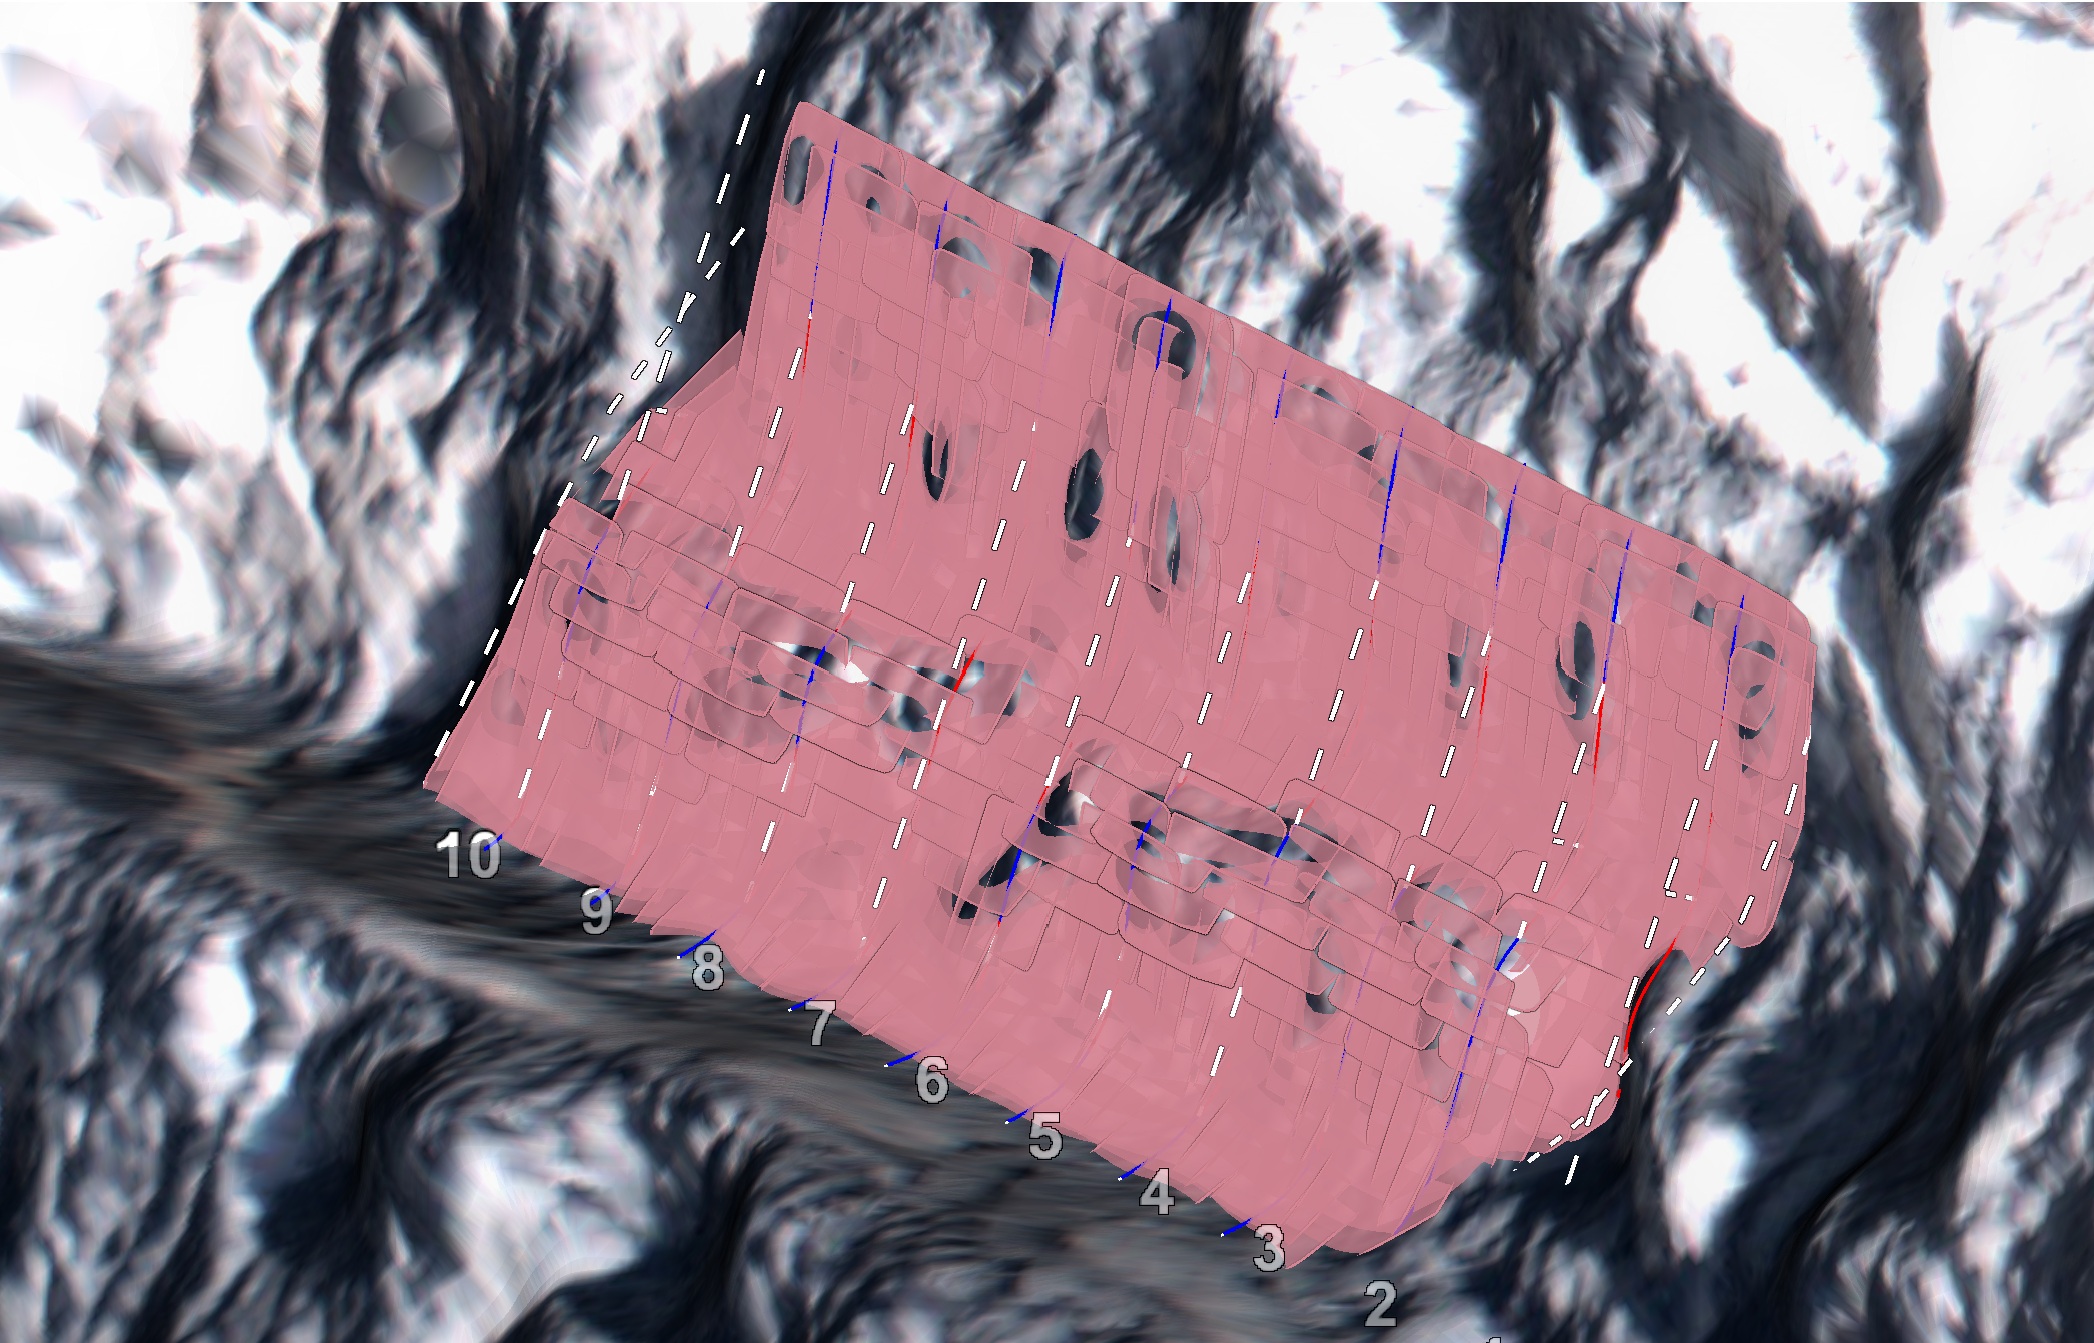
At this stage you can view the patches arranged on the surface of the areas under investigation in more detail. Select the waviness result in the tool panel and transient visualisations of the corresponding patches will appear on the surface selection.
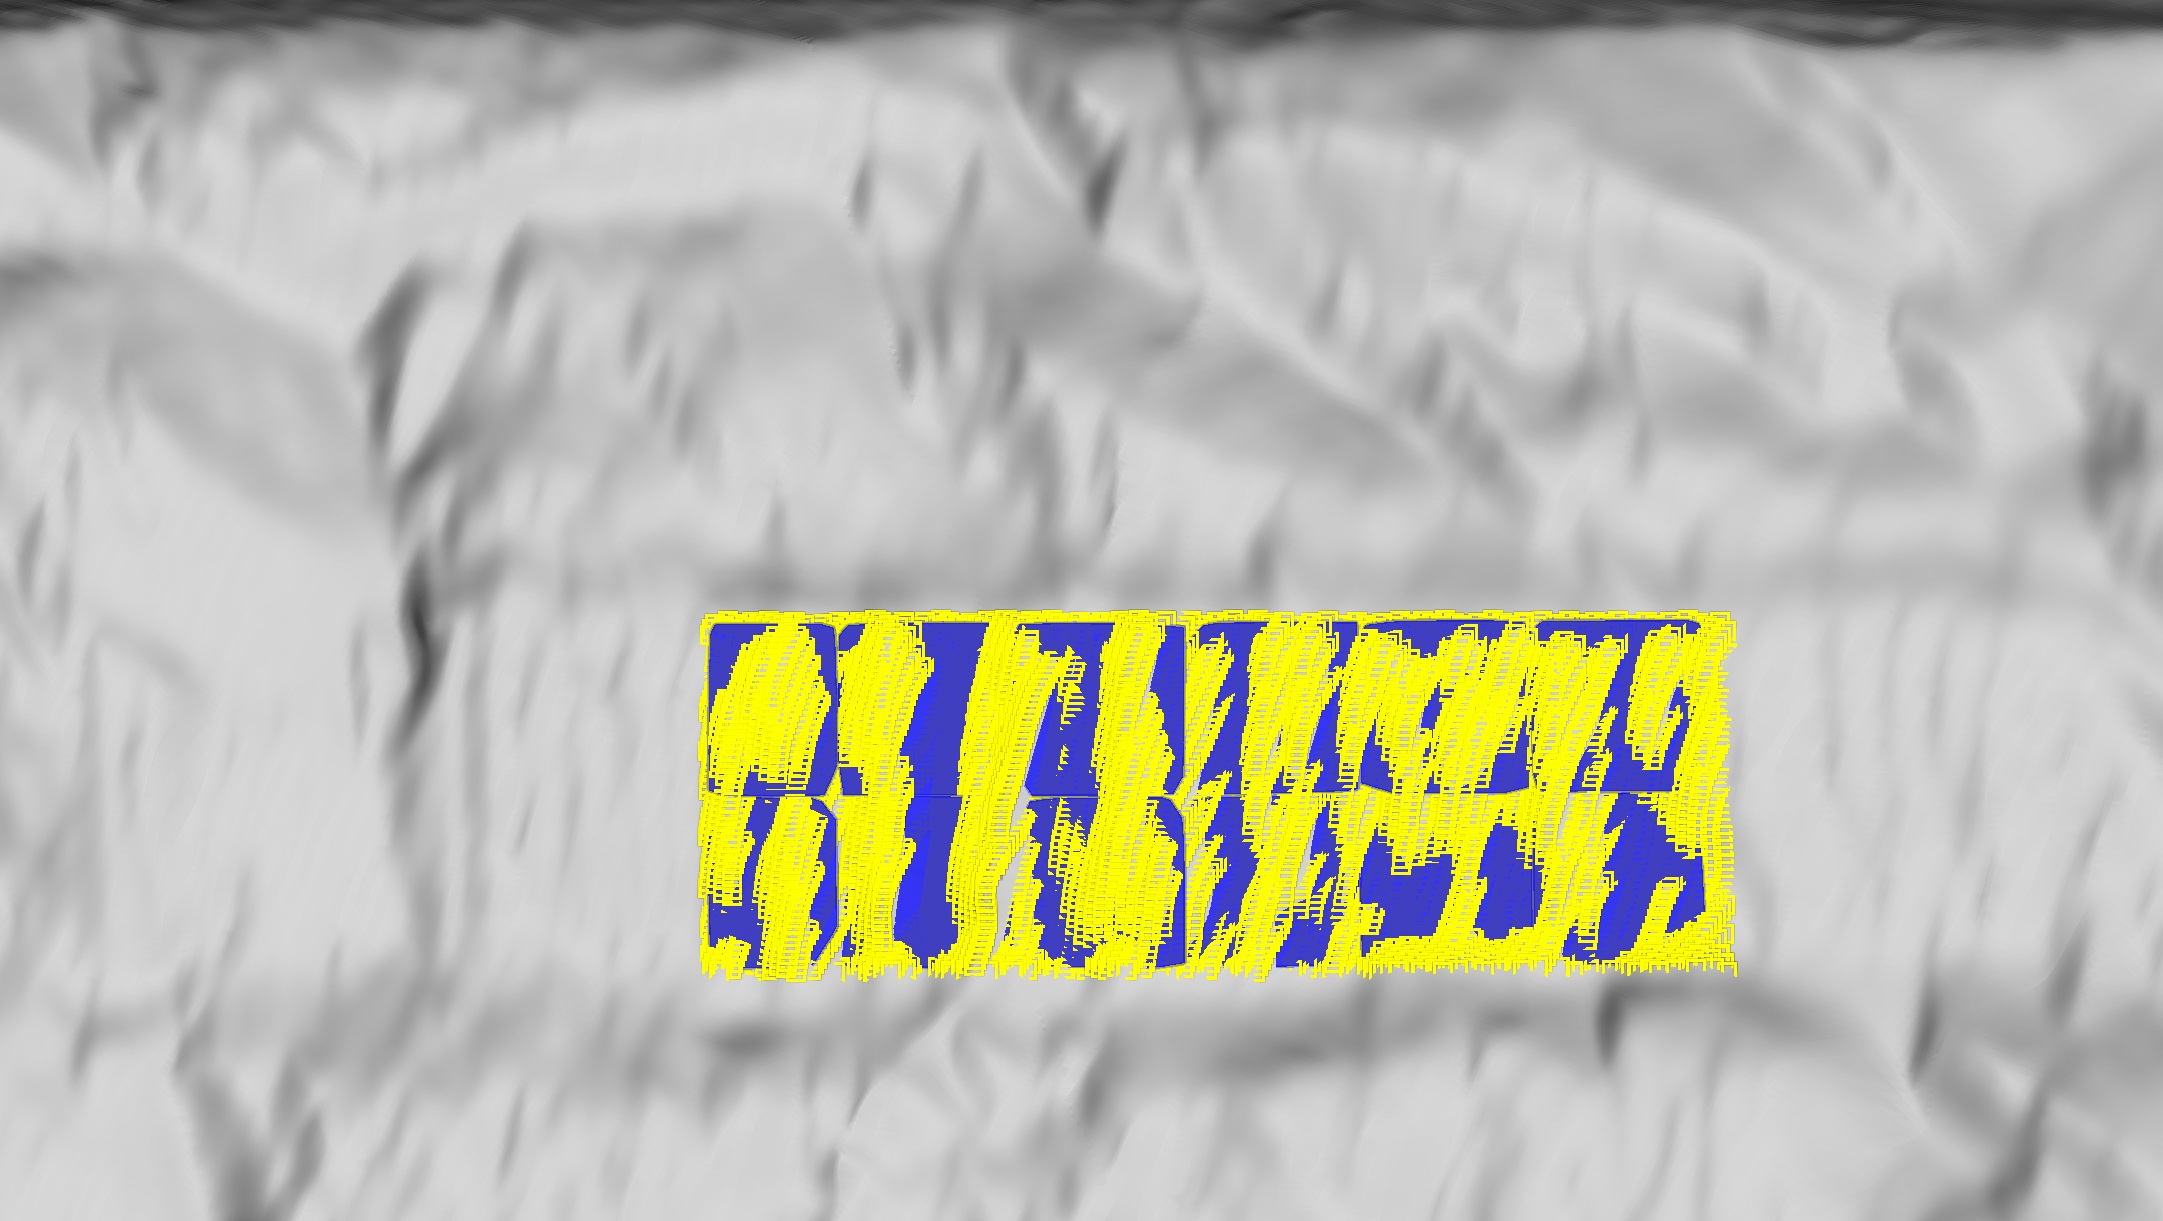 Tip
TipDeselect the area primitives to see the patches on the surface more clearly.
 Note
NoteYou can continue to add more areas, if required. Select the areas then click the
button.You can remove areas by selecting the corresponding waviness result, then clicking the
 button.
 You can also change any of the query settings for any area with the corresponding result selected. When PointStudio detects a parameter change, it automatically recalculates the result and regenerates new images.
-
When you have all required areas analysed, click Apply or OK to create waviness reports as PDF documents. Otherwise click Cancel to exit without creating PDF reports.
All objects and elements making up the patch analyses are saved in the

geotechnicalcontainer.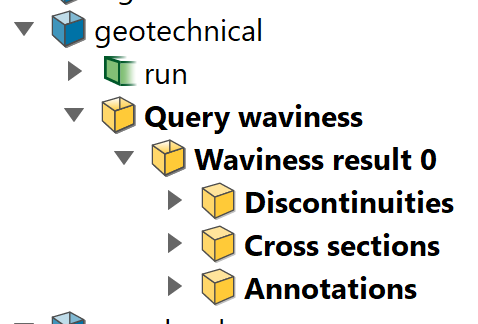
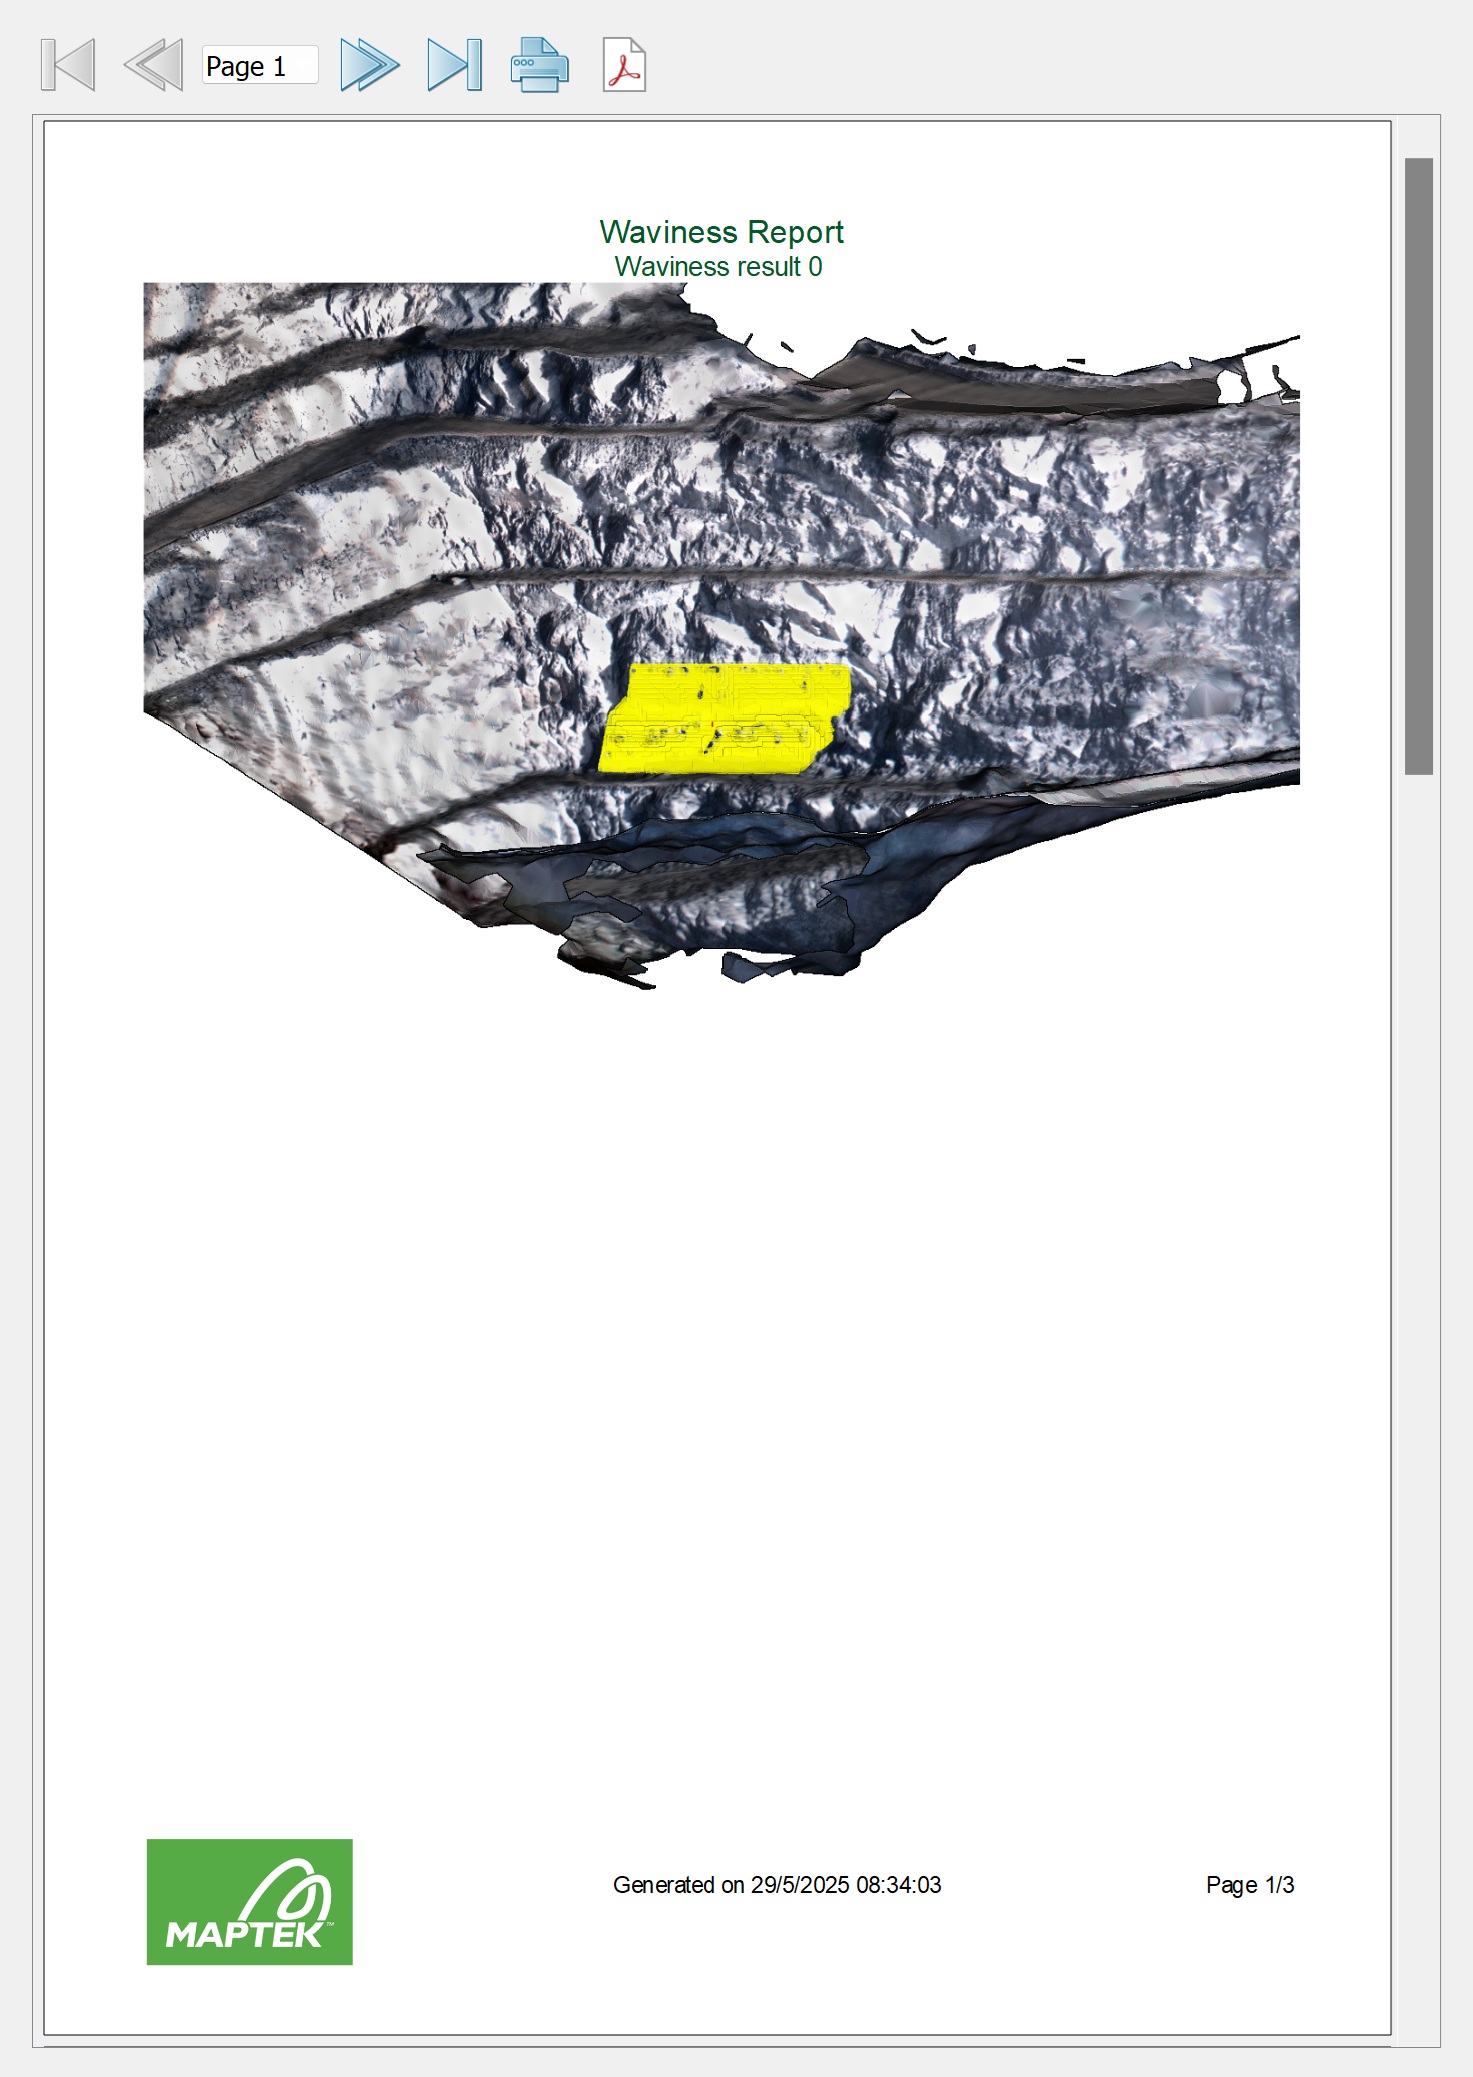
A draft Waviness Report appears in a new panel for review and modification before exporting. The report consists of a three-page section for each analysed area. The first
page of each section identifies
the area on the rock face under investigation. The image is a screenshot
of the current view on a white background, captured when you clicked the ![]() button.
button.
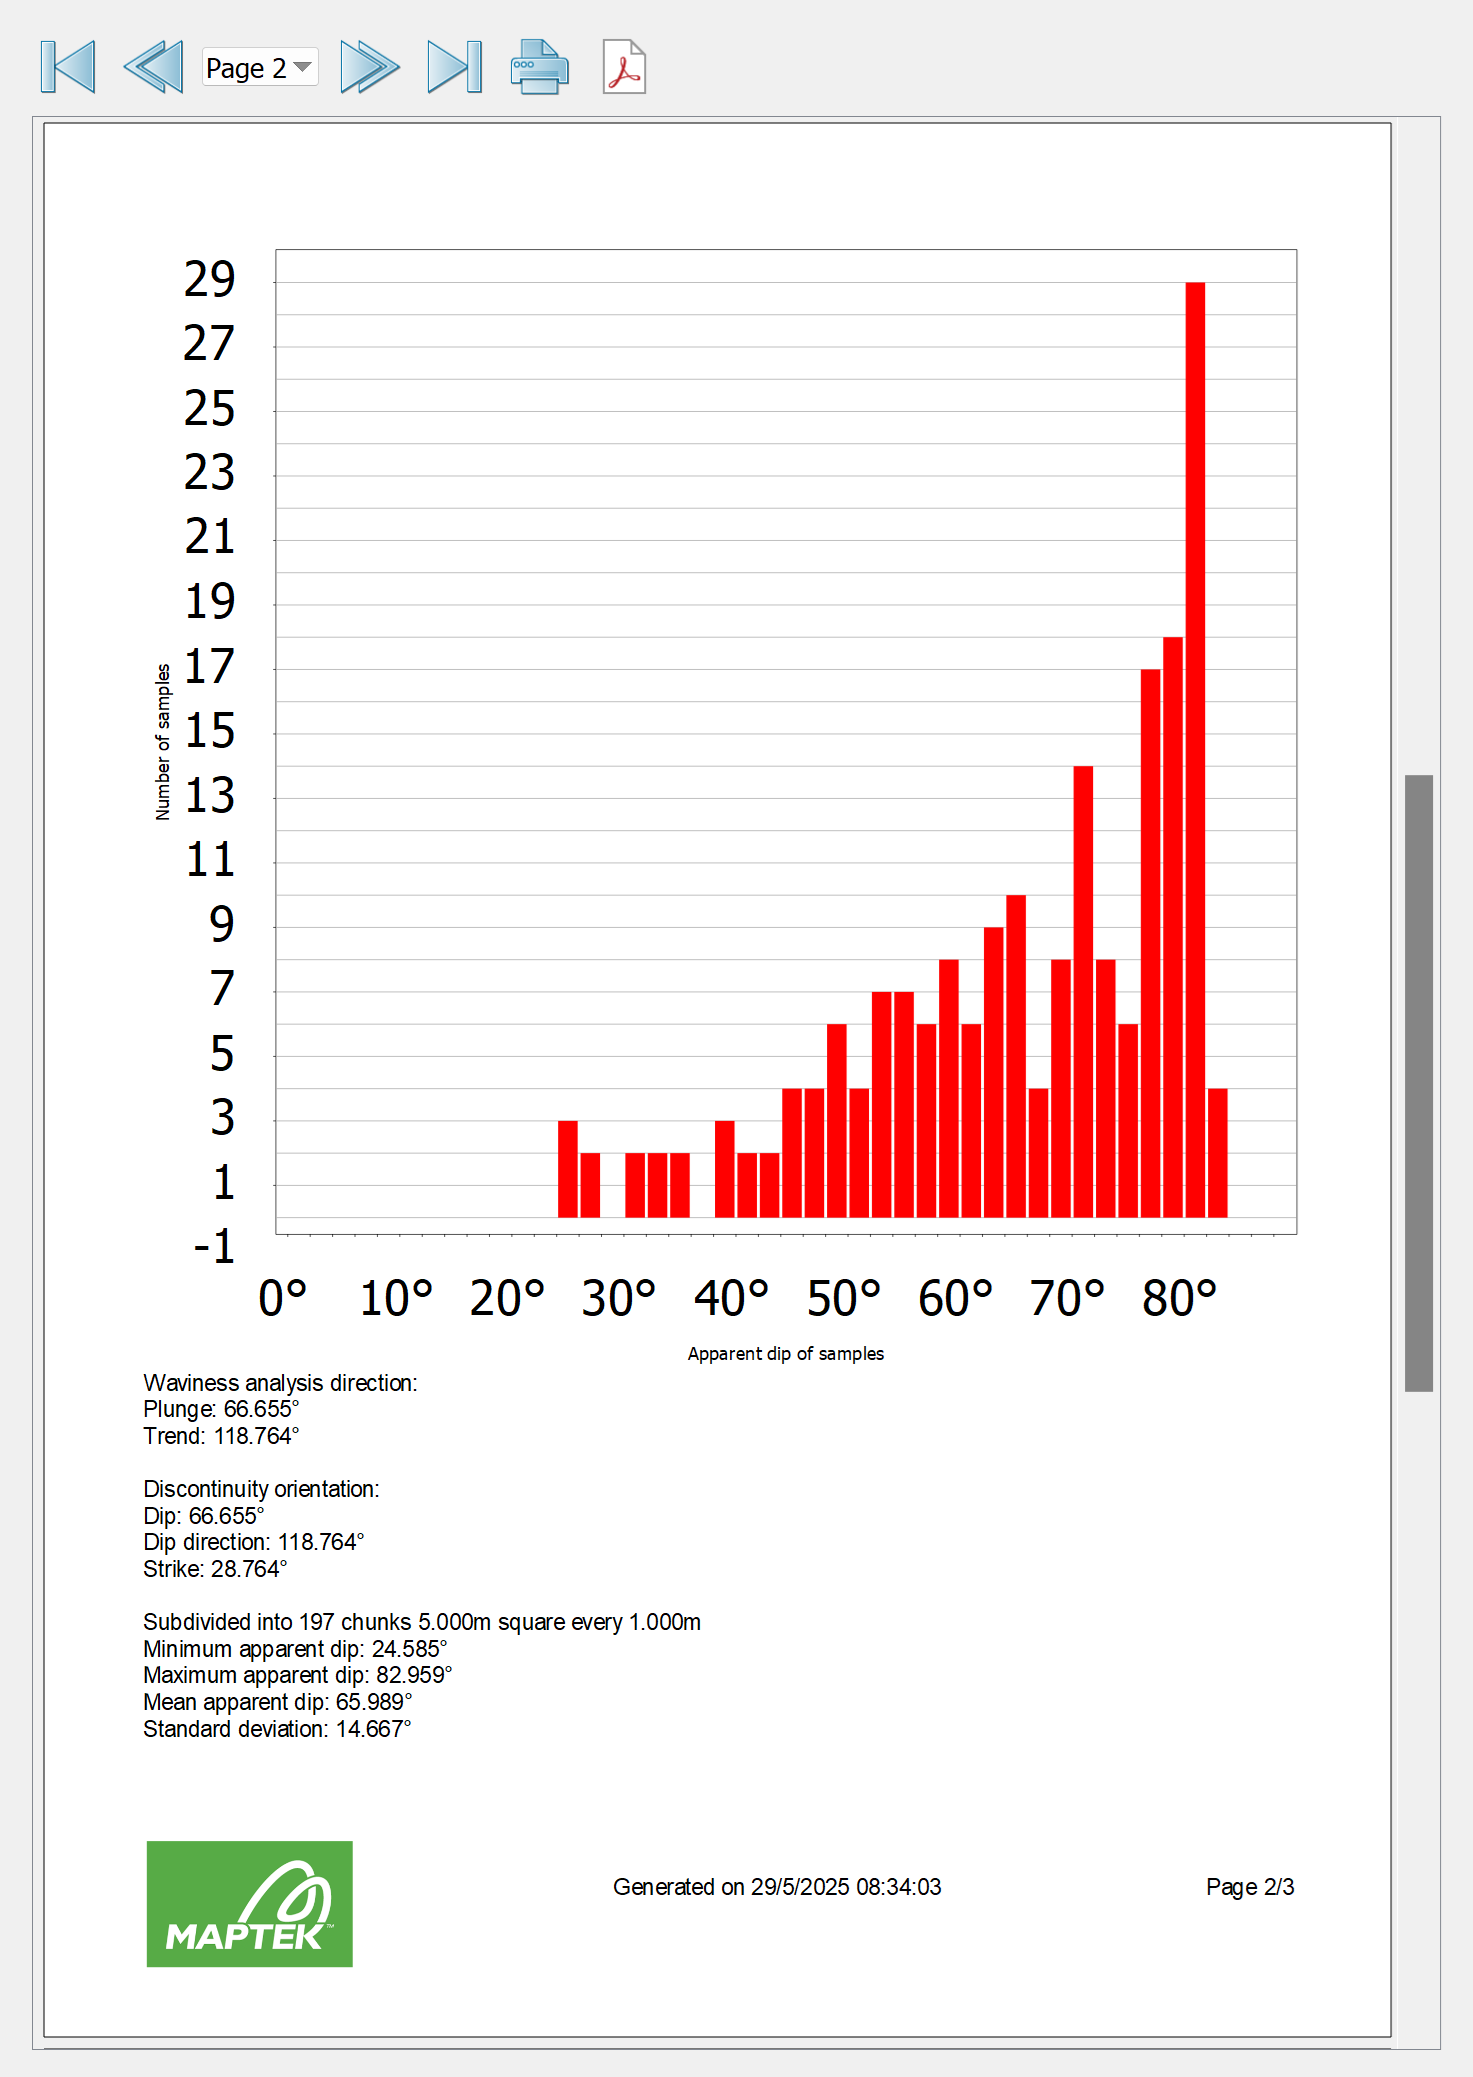
The second page presents a histogram of the apparent dip of the individual sampling patches used to break down the rock face under investigation, along with a summary of statistical data drawn from the analysis.
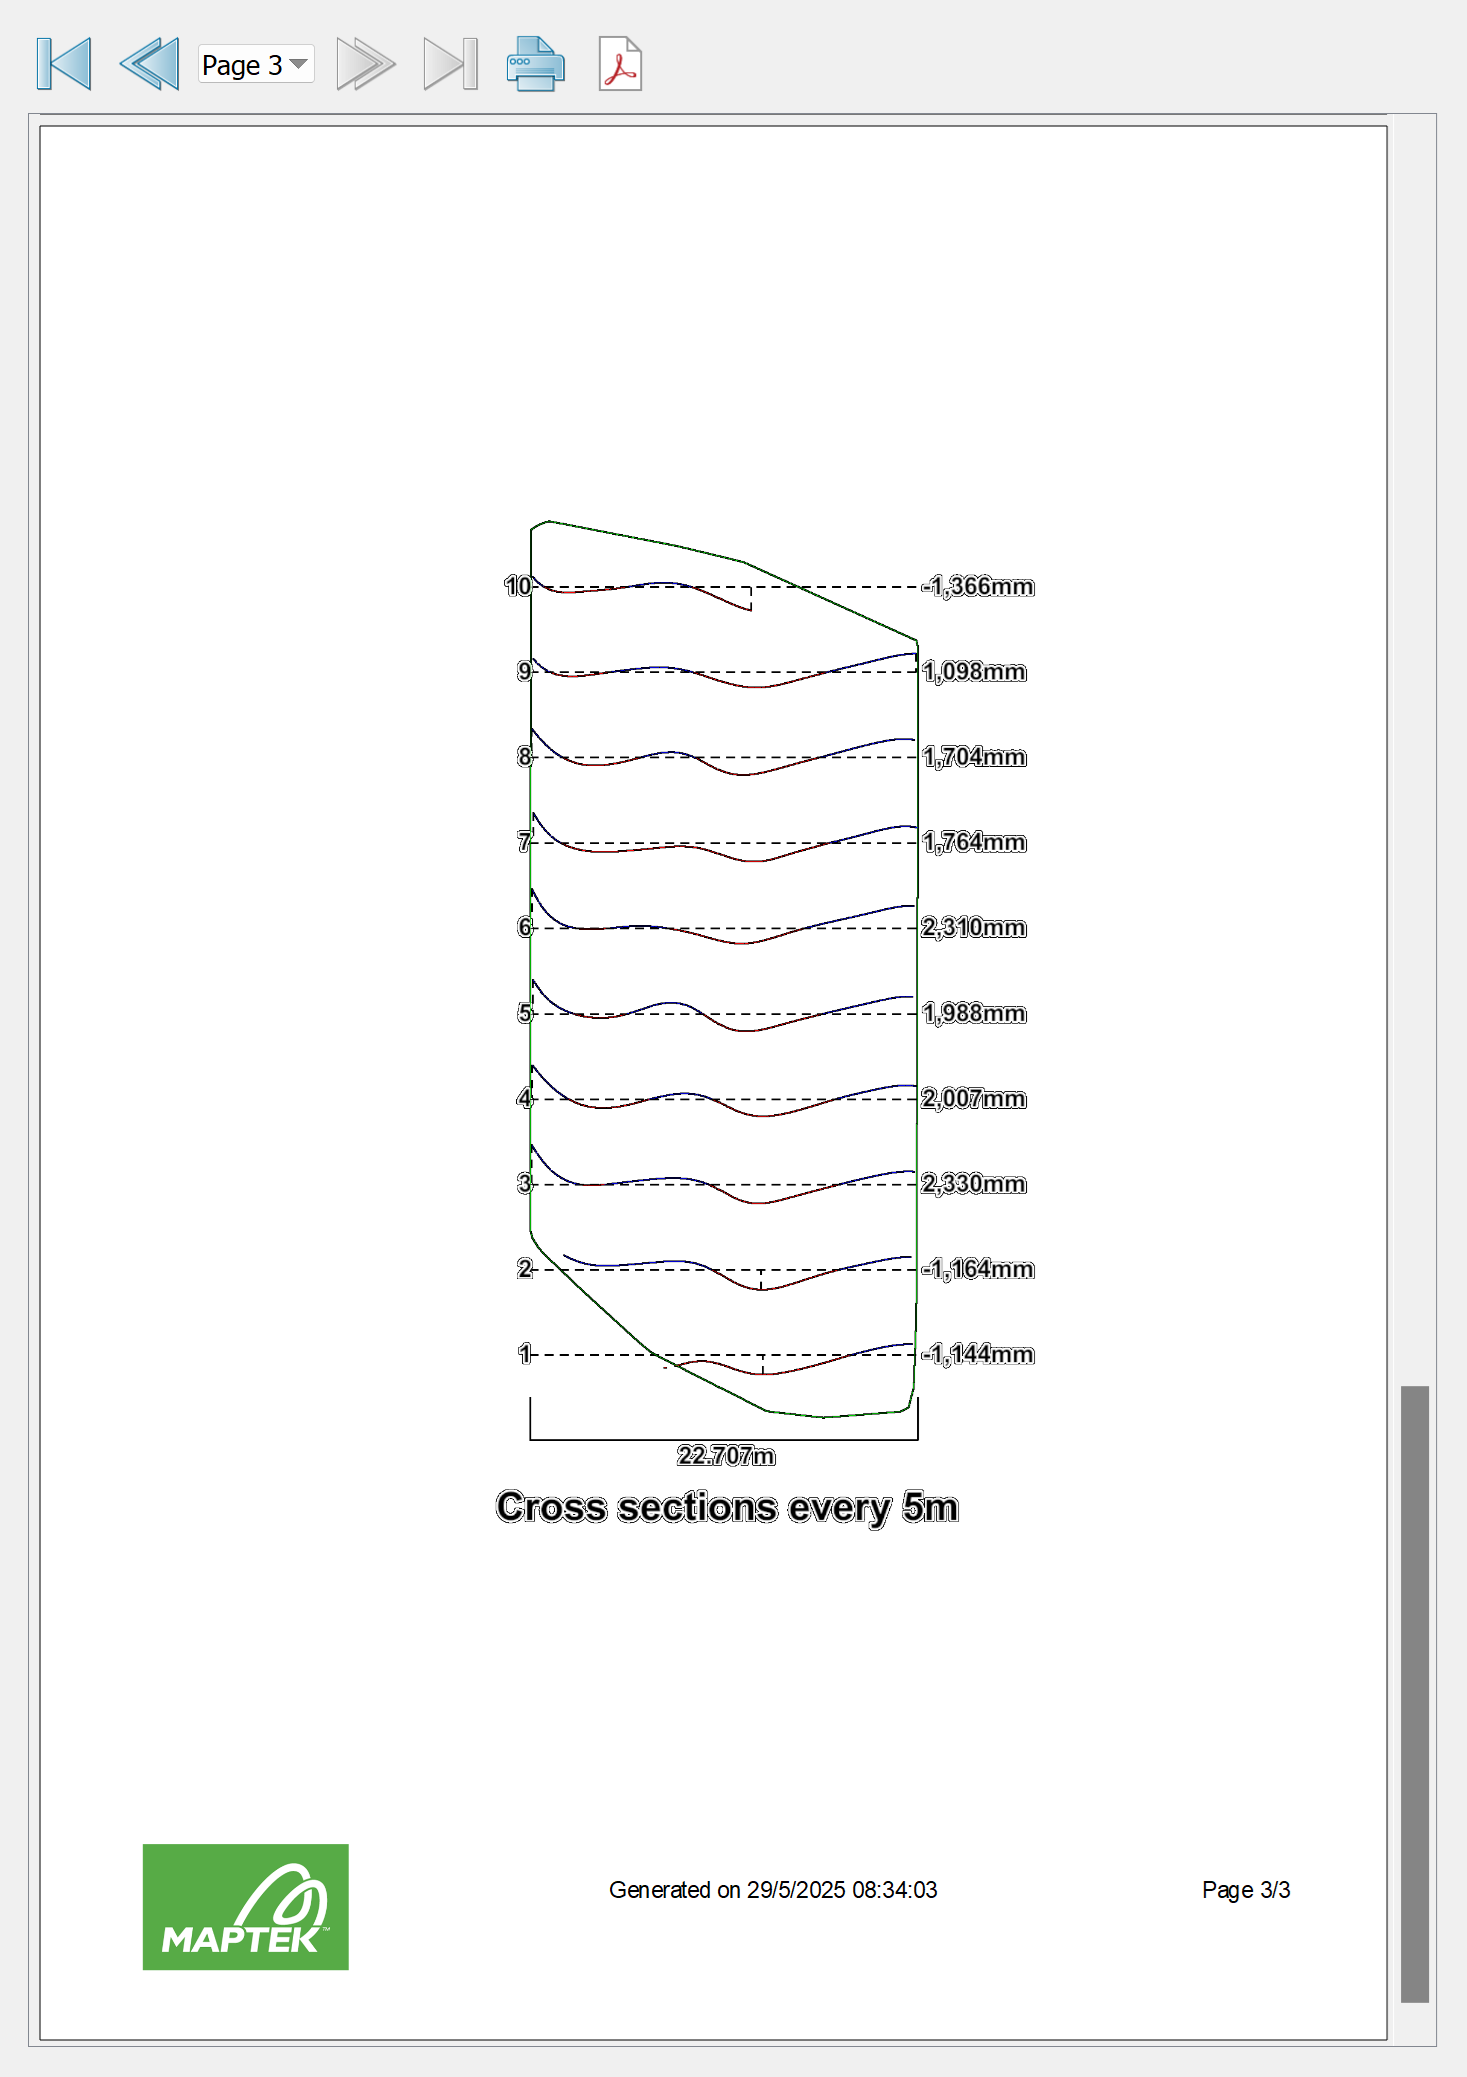
The third page displays cross-sections that are taken vertically through the face, then plotted graphically in sequence from the original right (top) to left (bottom). The cross-sections are spaced according to the subdivision size. Cross-section line colours indicate whether a line is above (blue) or below (red) the mean for that section, while the numbers on the right-hand vertical axis indicate the maximum deviation from the mean. The number on the horizontal axis is the maximum cross-section length.