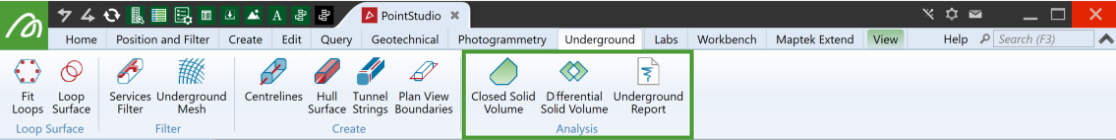
Analysis
The Analysis group on the Underground tab contains tools for analysing and reporting on tunnel and void volumes and designs.
|
|
Closed Solid Volume (Alt+B) Calculate the volume of closed surfaces. |
|
|
Differential Solid Volume (Alt+J) Calculate the cut and fill between closed surfaces. |
|
|
Create an underground conformance report. |
Closed Solid Volume
The Closed Solid Volume tool (Alt+B) measures the volume of a closed solid surface.
To calculate a closed volume, proceed as follows:
-
Select the solid surface

 to be measured.
 -
On the Underground tab, in the Analysis group, select
 Closed Solid Volume.
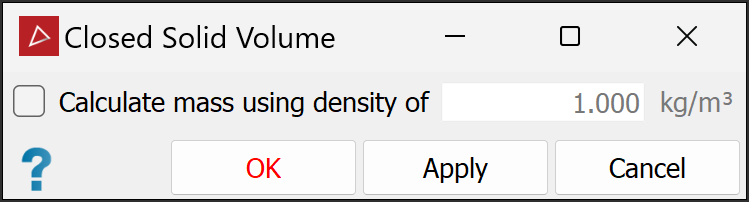
-
(Optional) Select Calculate mass using density of and enter the material density in the field.
-
Click OK or Apply.
The volume of the solid is displayed in the report window.

Differential Solid Volume
The Differential Solid Volume tool (Alt+J) measures the volume difference between two solid surfaces and is useful for checking the progress of a stope as it is mined, or to check a stope against design.
To calculate a differential volume, proceed as follows:
-
On the Underground tab, in the Analysis group, select
 Differential Solid Volume.
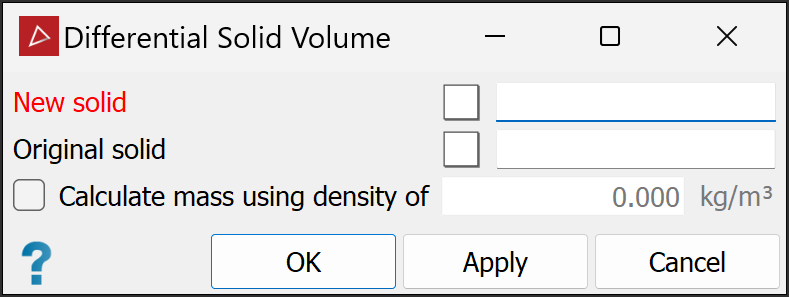
-
Drag the new surface
into the New
solid field. -
Drag the original surface
into the Original
solid field. -
(Optional) Select Calculate mass using density of and enter the material density in the field.
-
Click OK or Apply.
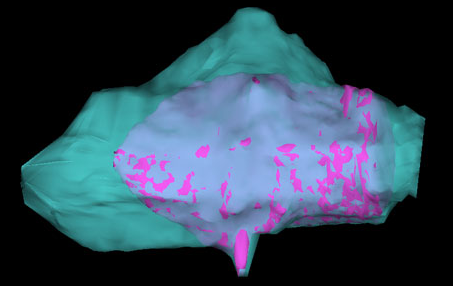
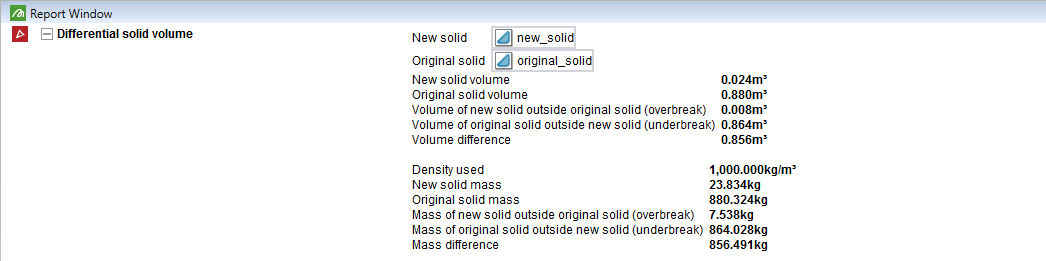
Both surfaces are checked for inconsistencies and the volume of each solid is calculated. Results appear in the report window, in terms of volume and mass differences, and the areas of overbreak and underbreak.
|
|
|
The pink shaded areas indicate what has been excavated against the design stope (light blue). |
|
|
|
|
Example of a report displayed in the report window. |
|
Underground Report
The Underground Report tool allows you to create reports detailing the conformance between the design surfaces of a tunnel or void, and objects representing the as-built surfaces (all with ends). These reports are useful for determining the amount of underbreak and overbreak resulting from digging or shotcrete application thickness.
Note: A design surface may also be derived from a tunnel centreline, along with a polygon to trace out the surface of the tunnel when projected along the centreline.
To create an underground report, proceed as follows:
-
On the
 Underground.
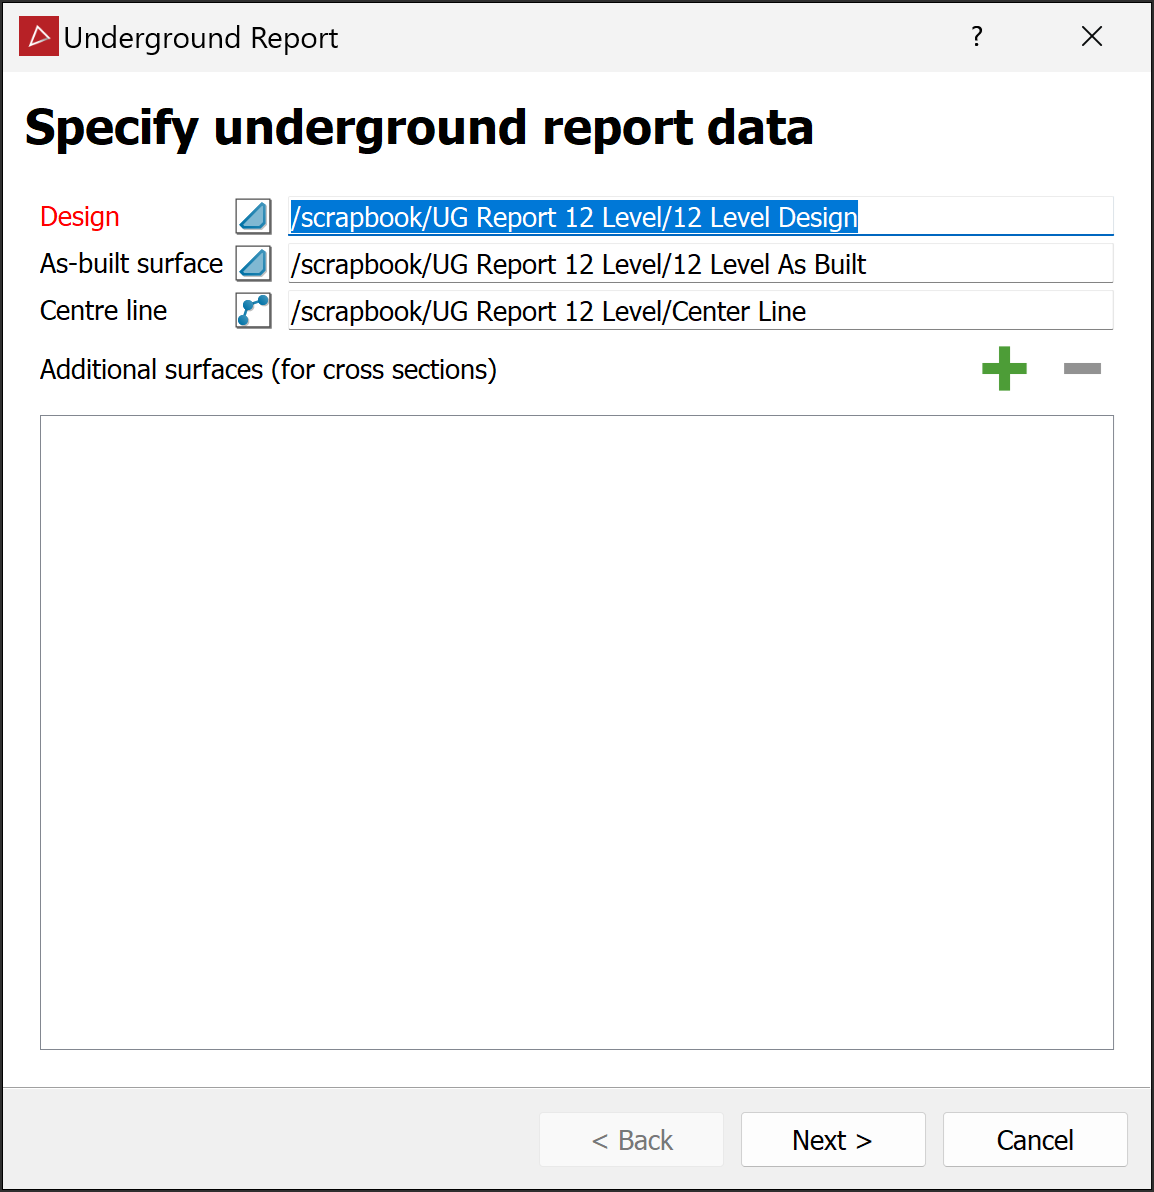
The Underground Report panel will open on its Specify underground report data page.
-
Drag the design and as-built surfaces
into the corresponding fields. Drag in any of the following optional objects, as required:-
Centre line
-
Additional surfaces (for cross sections)
-
-
Click Next > to open the Configure report page.
Adjust the look of the report and the data that will be displayed with the following criteria:-
Content. Select components to include in the report, and apply appropriate image and surface labels. For example, if the surfaces are for shotcrete analysis, the could be renamed
pre-shotcreteandpost-shortcrete.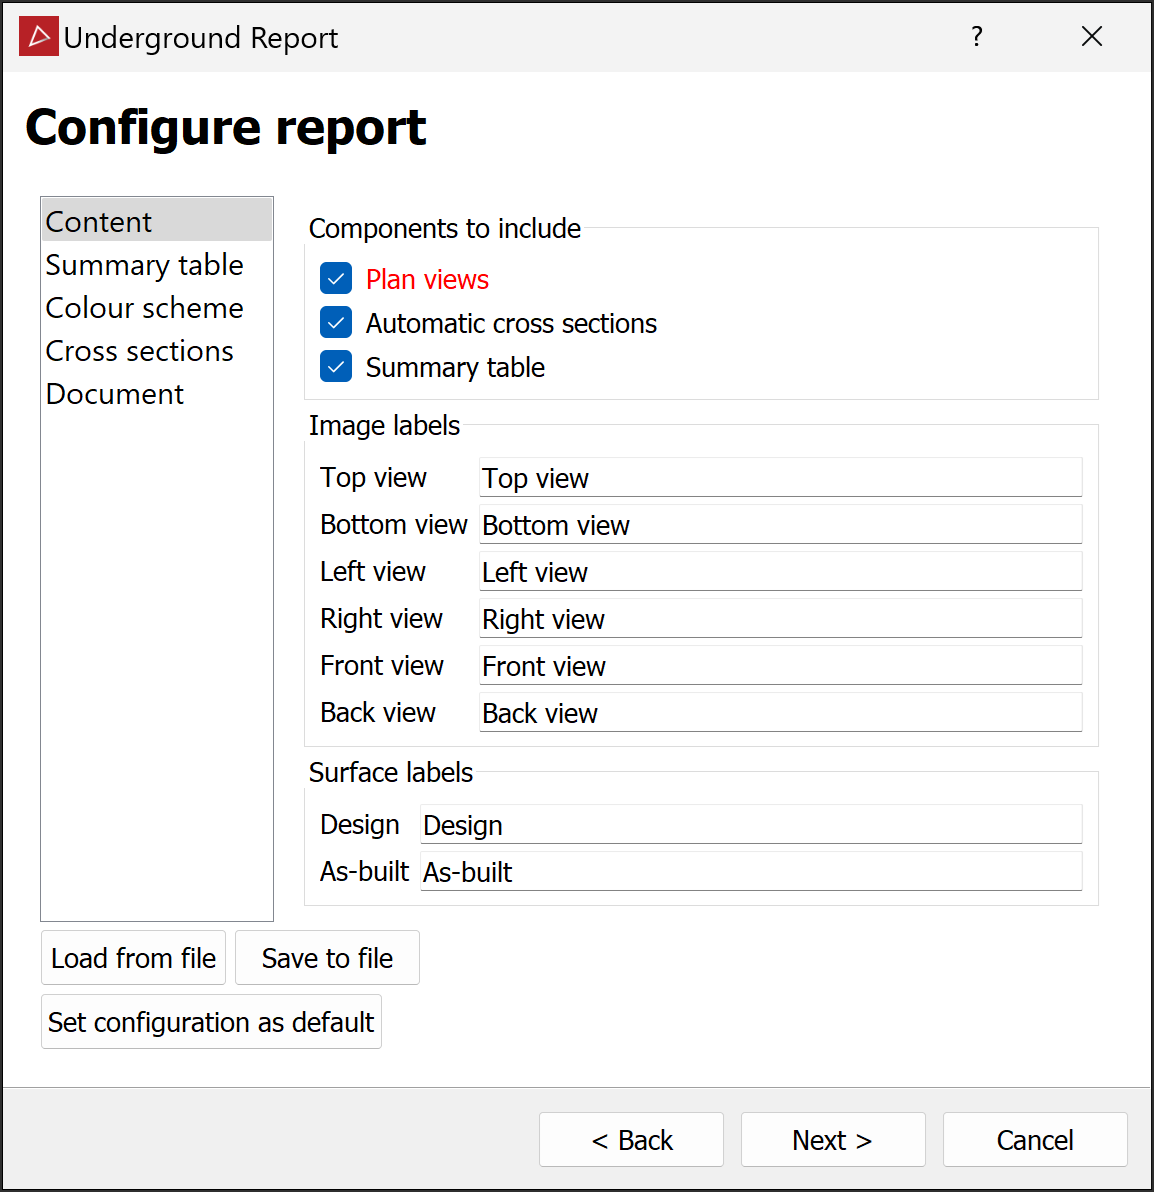
-
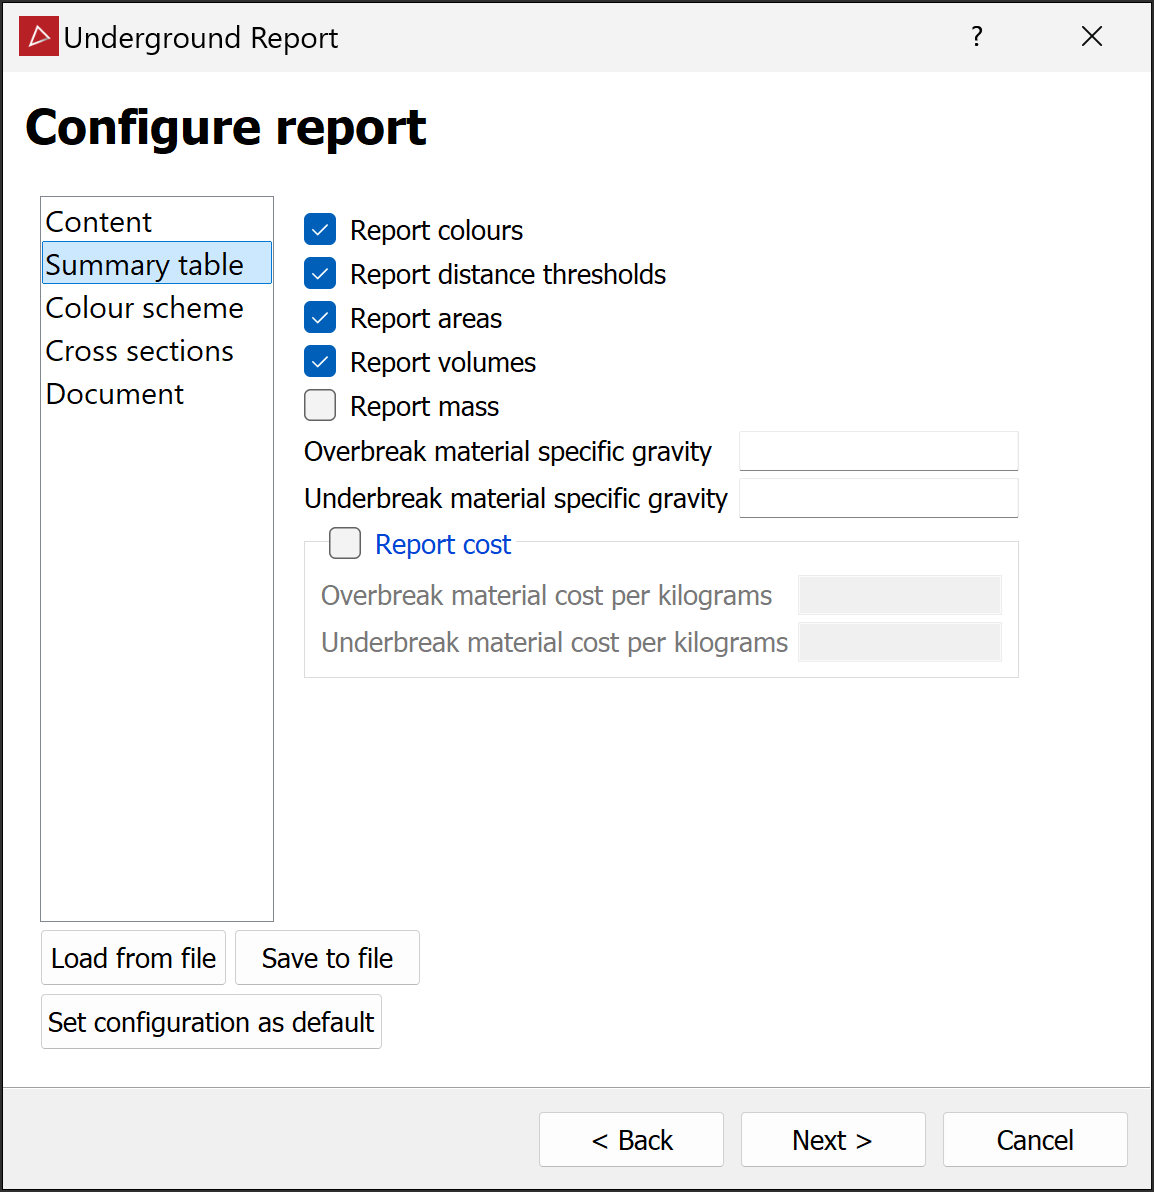
Summary table. Select the details to summarise.
-
Colour scheme. Set up the colour scheme to reflect the values that will be used in the output. See Modifying a Colour Scale for detailed instructions.
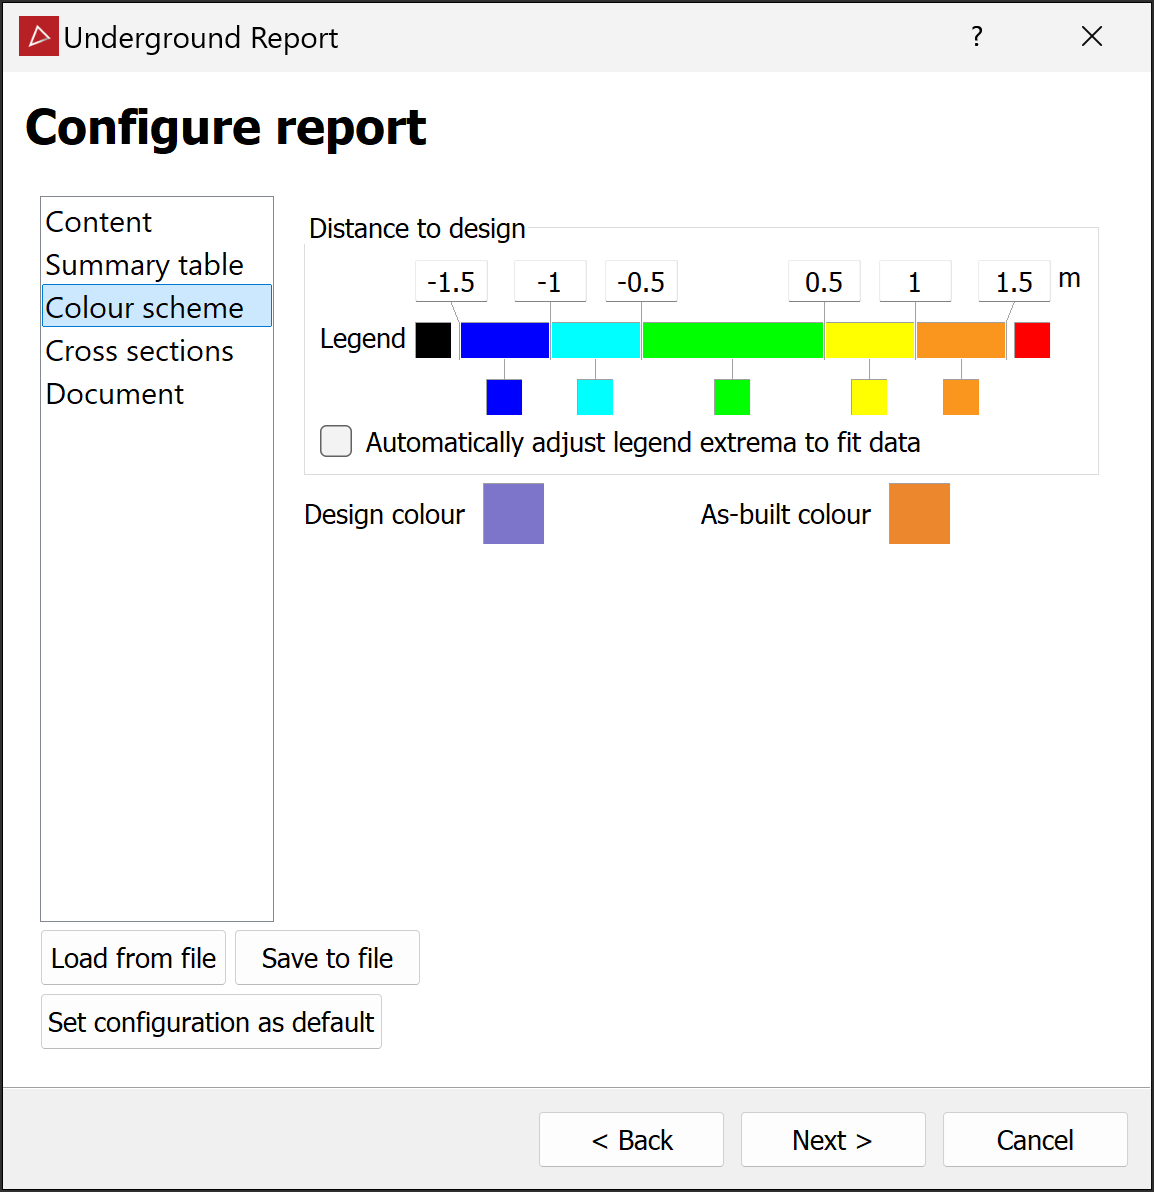
Note: The values in the colour scheme are used to define the increments in the results table of the output. Solids are also created based on the underbreak and overbreak increments used in the colour scheme. These are checked later, after analysis, in order to validate results. In the case of no noticeable results, you can adjust the values can to show details at the level of the variation for the case in hand.
-
-
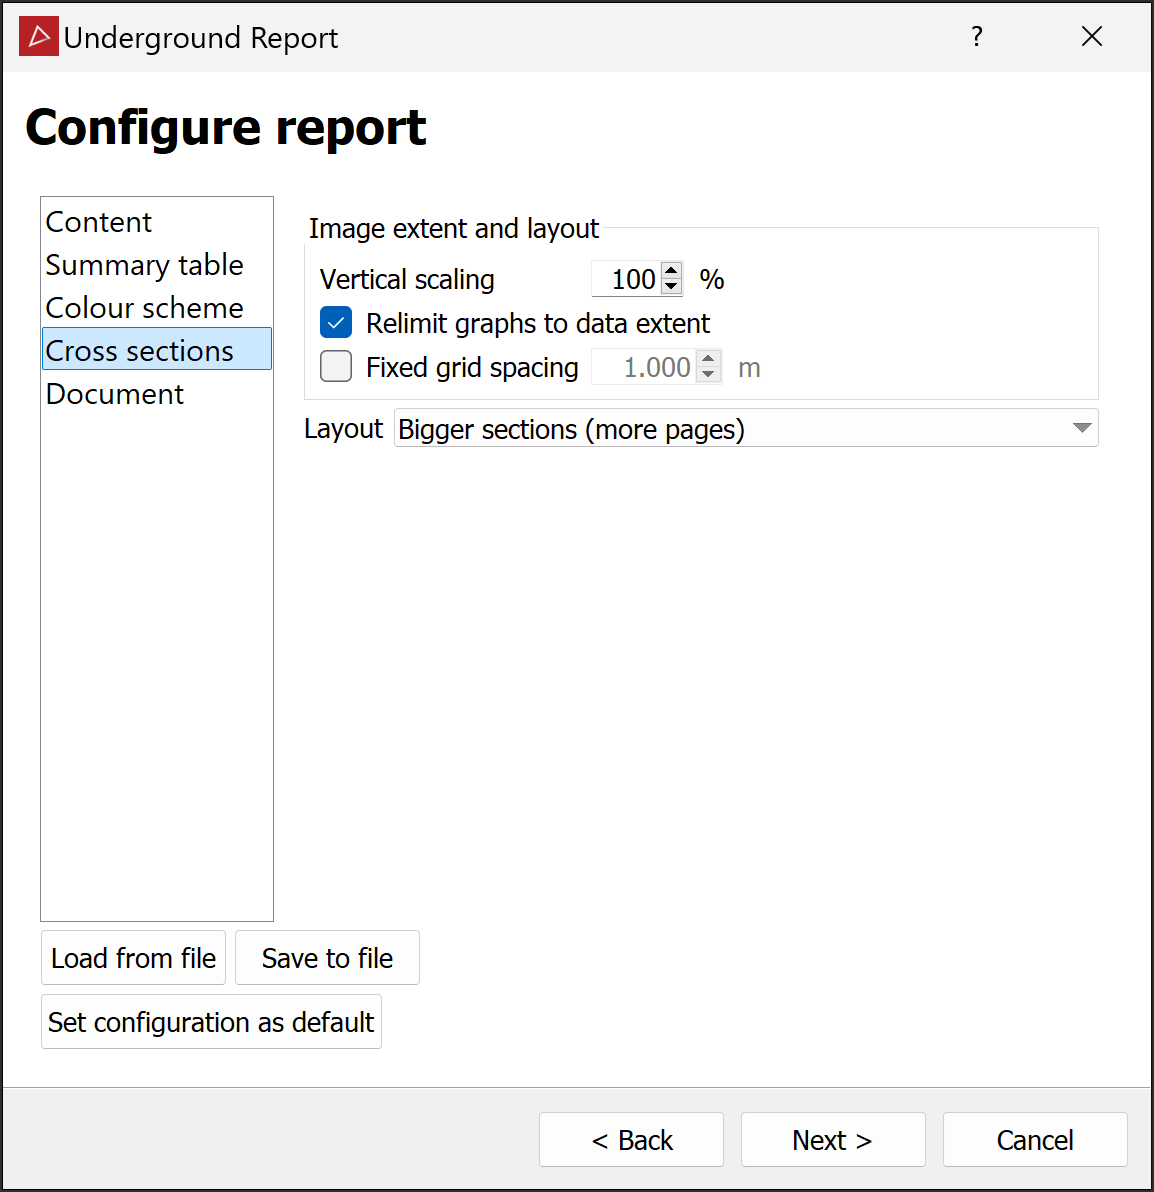
Cross sections. Set up cross section criteria, including a regular fixed spacing and custom locations.
When creating sections for the underground report, PointStudio will save the sections in a custom container
 called
 underground report sectionsin the
contourscontainer.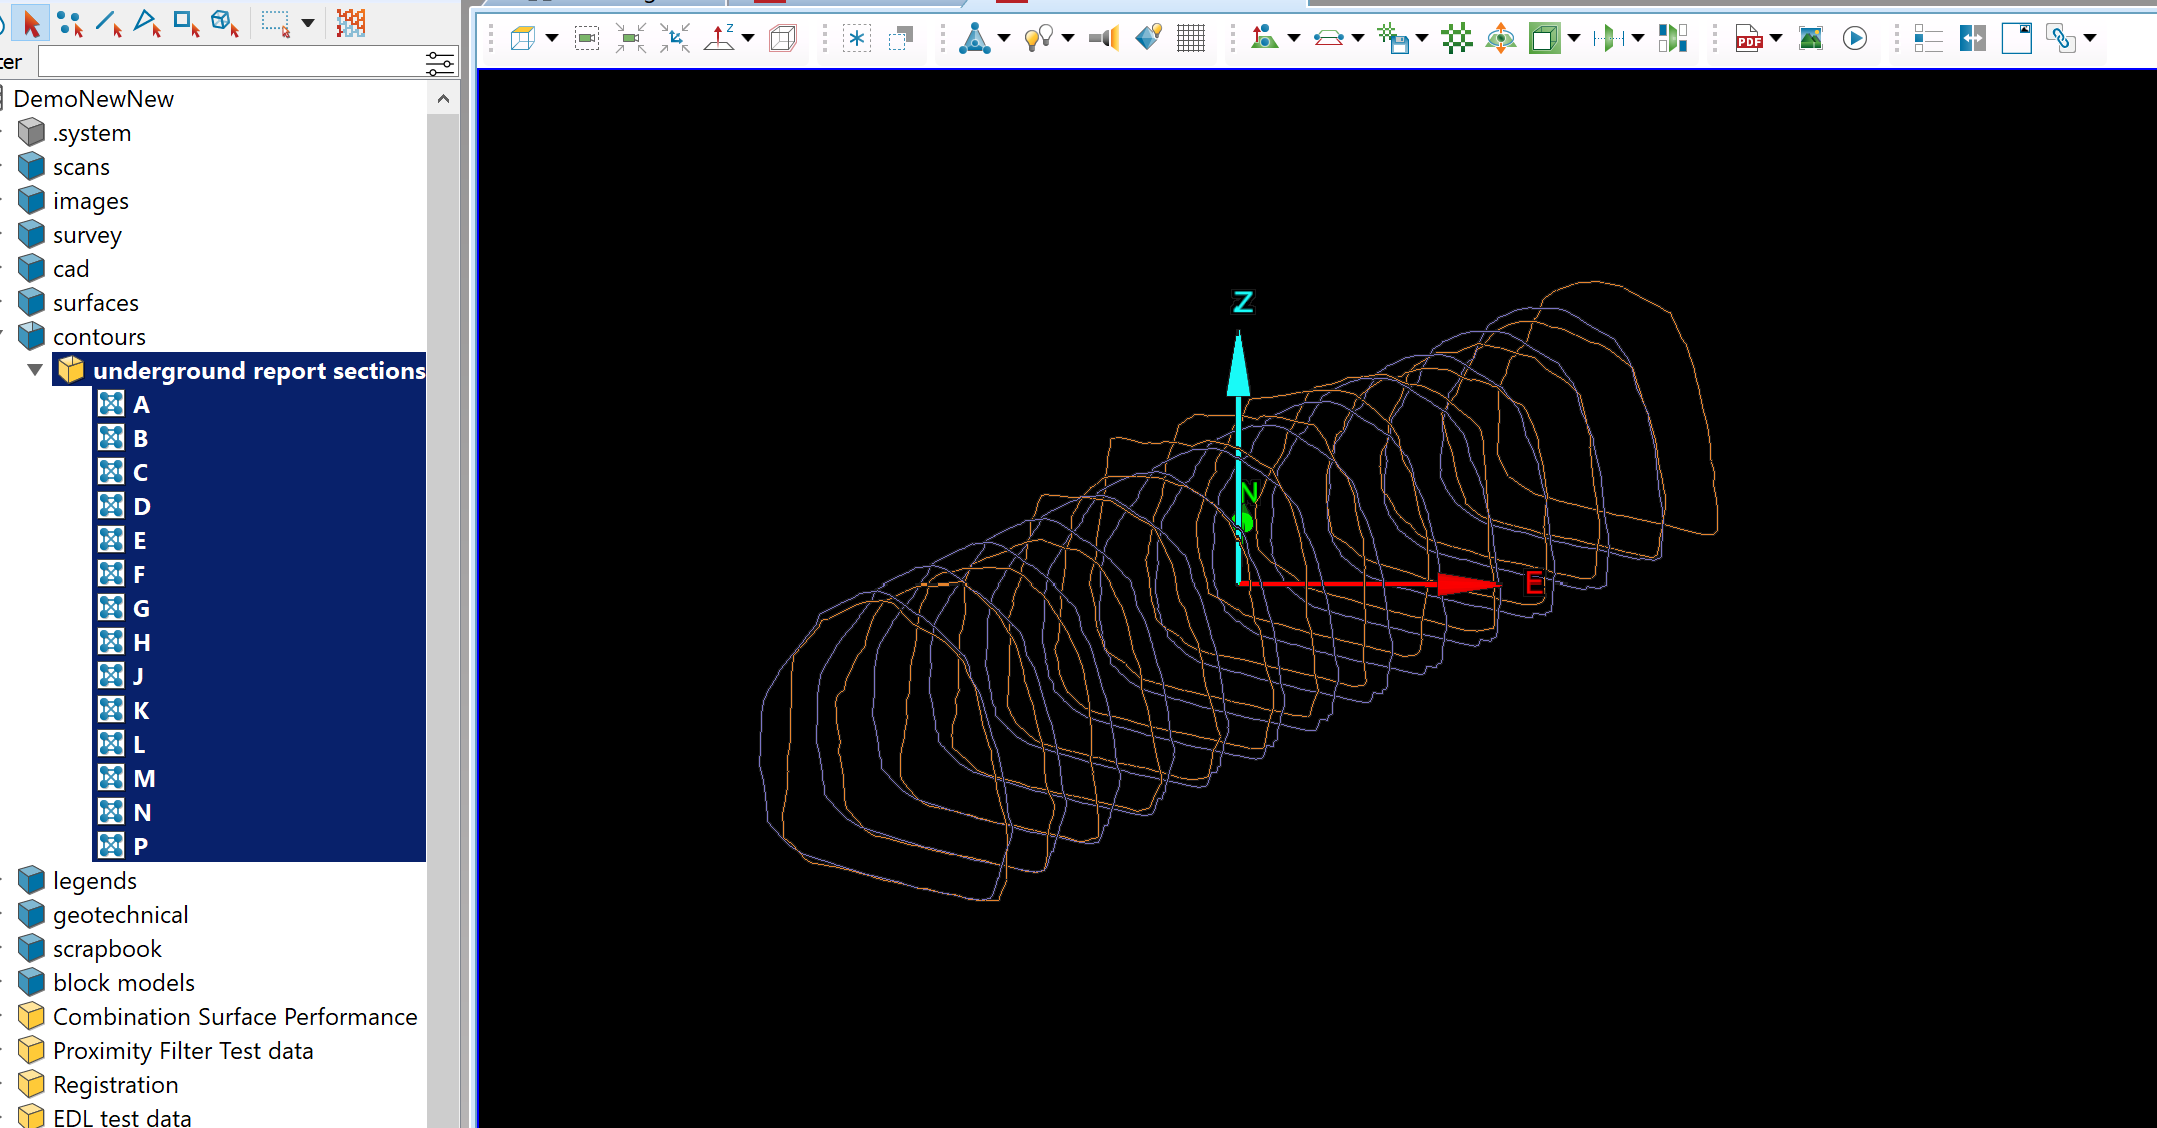
-
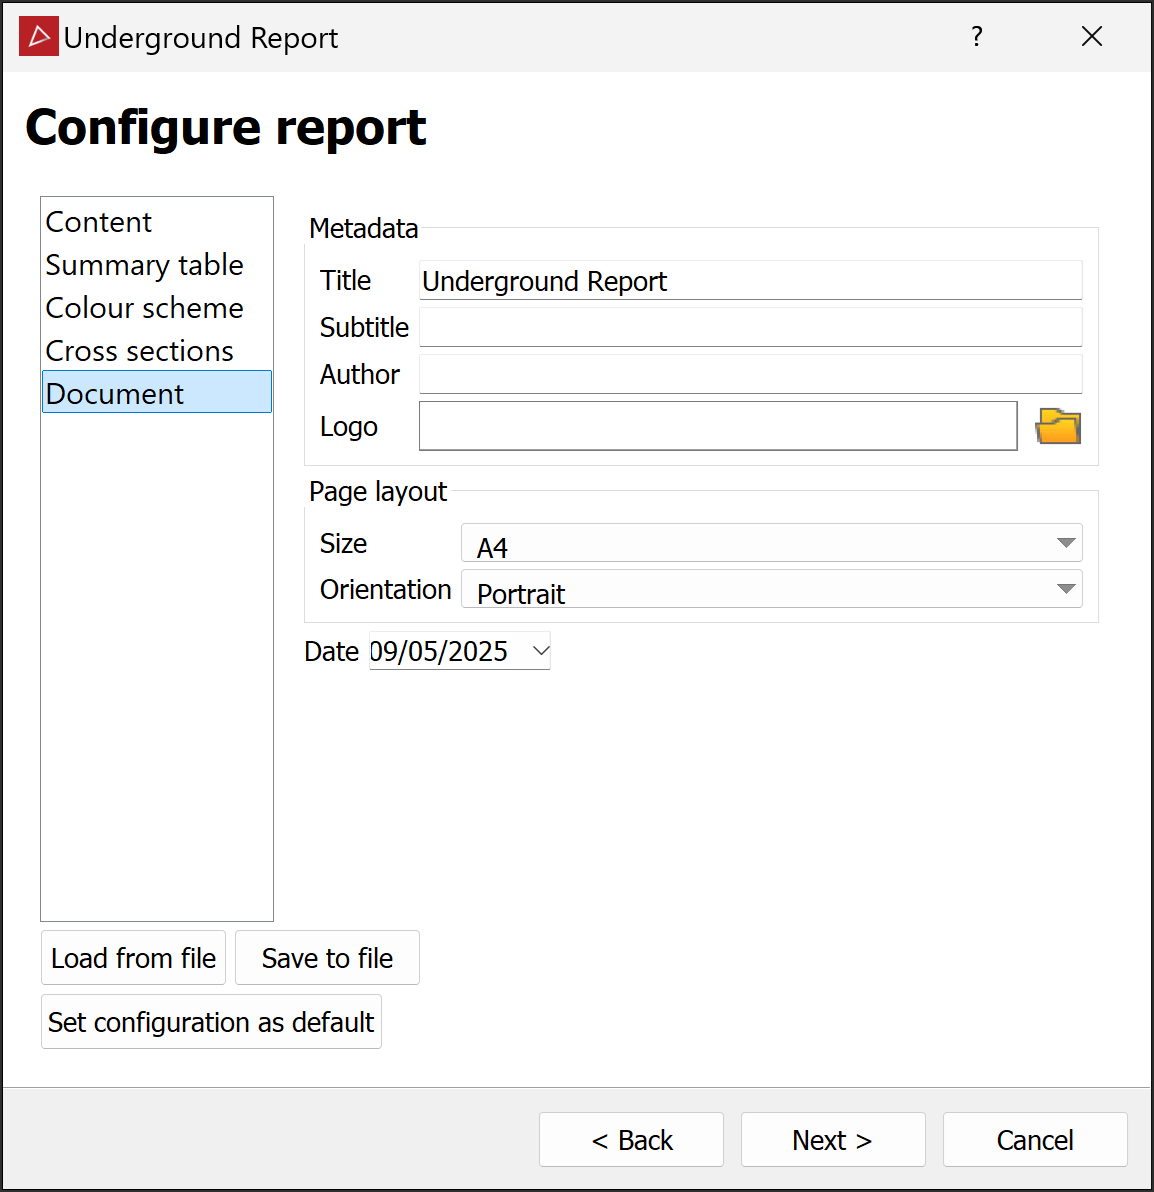
Document. Enter metadata to include (report title and subtitle, author's name, and logo) and a page layout. Change the date if necessary.
-
Click Next > to open the Define report area page.
Examine the layouts and adjust them as necessary. Specify the distance between automatically generated cross-sections and add any custom cross sections, as required.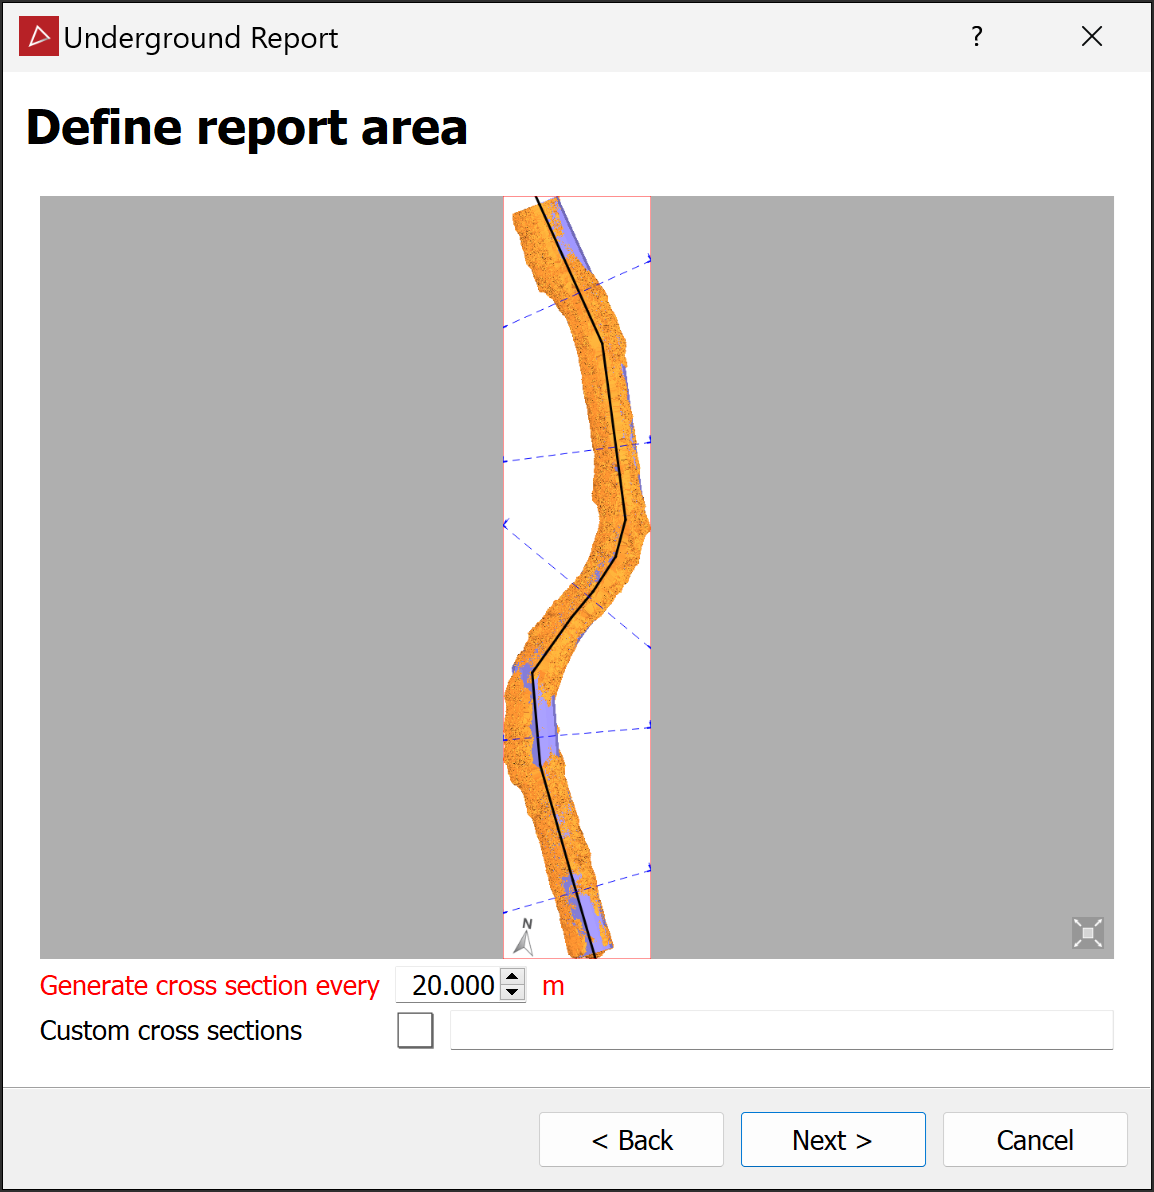
-
Click Next > to generate report content.
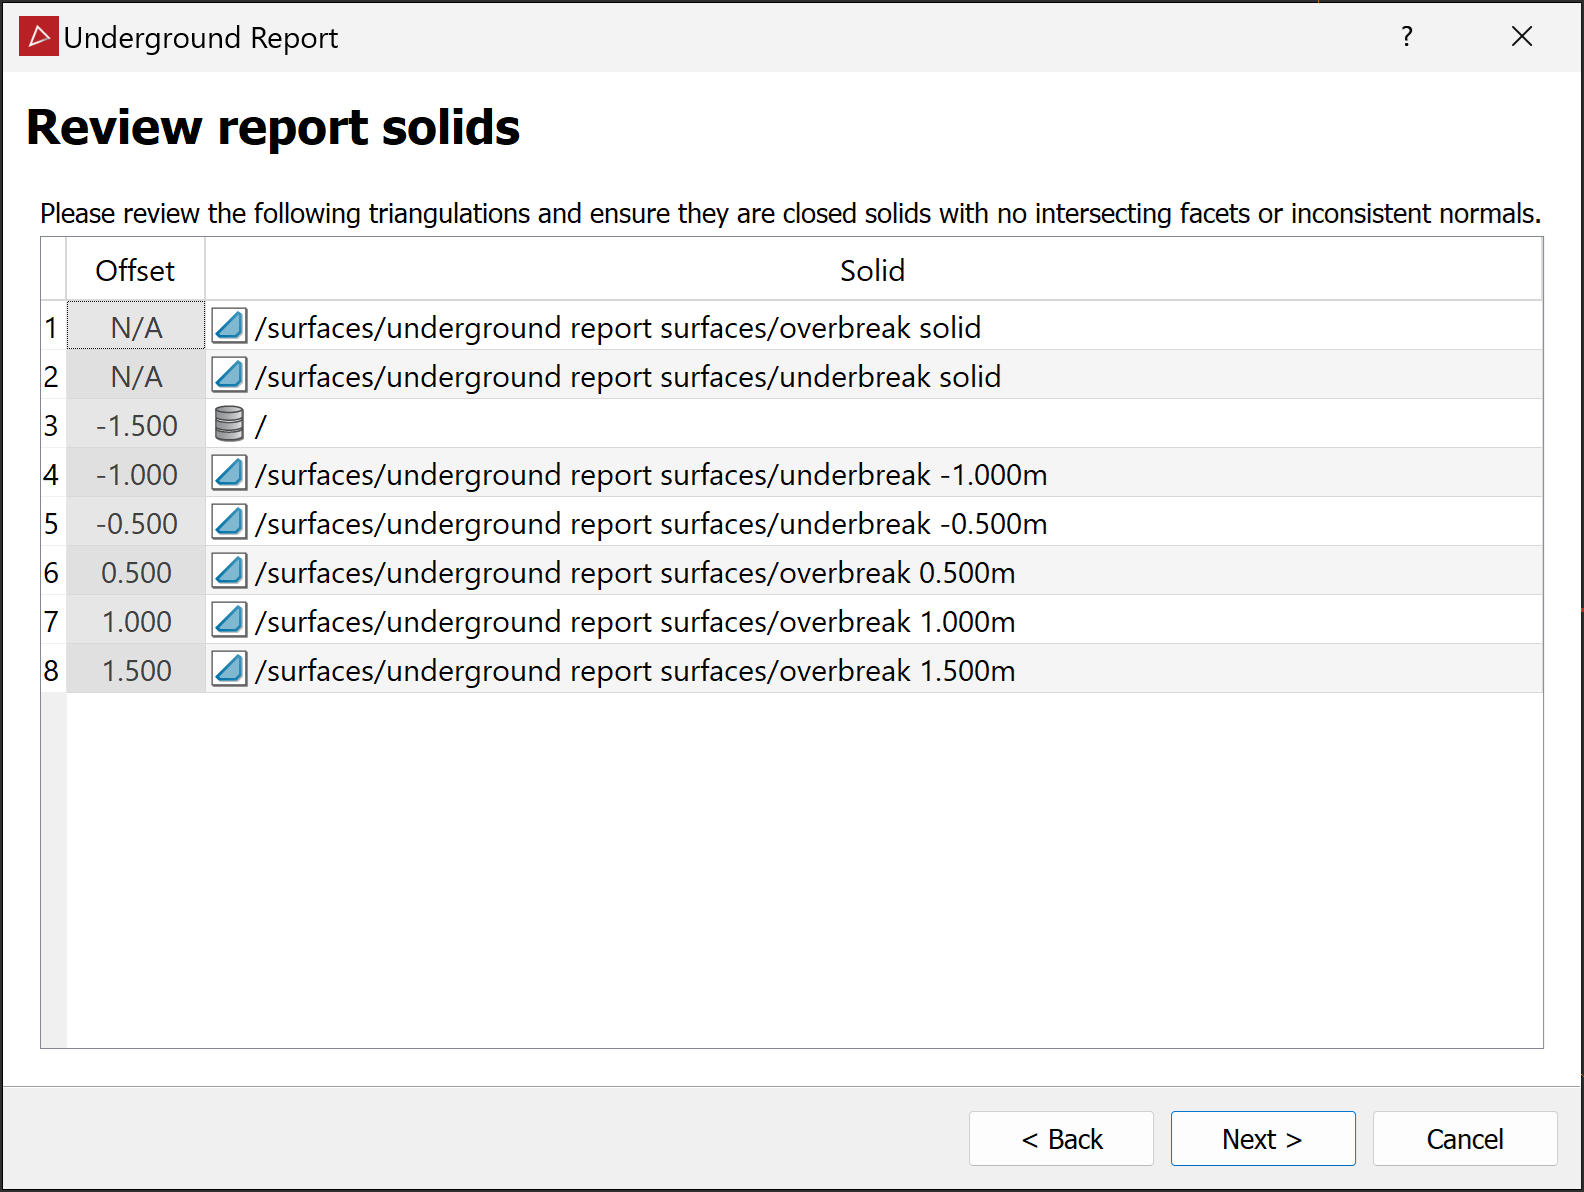
When content generation finishes, the Review report solids page will open.
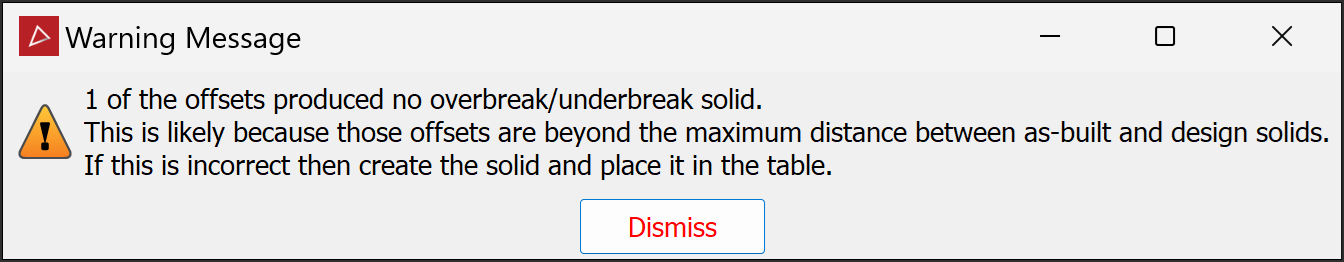
 Note
NoteThe following warning message may appear. If necessary, resolve the issue as instructed before continuing.
-
The analysis produces solids representing each of the overbreak and underbreak criteria as specified by the colour scheme setup. Leaving the report tool open, review each solid with the
 Surface Validity tool. Fix any errors found.
 -
Click Next > to open the Review report images page.
-
Click Next > to open the Preview report page.
The report will display left, right, top, bottom, front and back views of the underground tunnel.
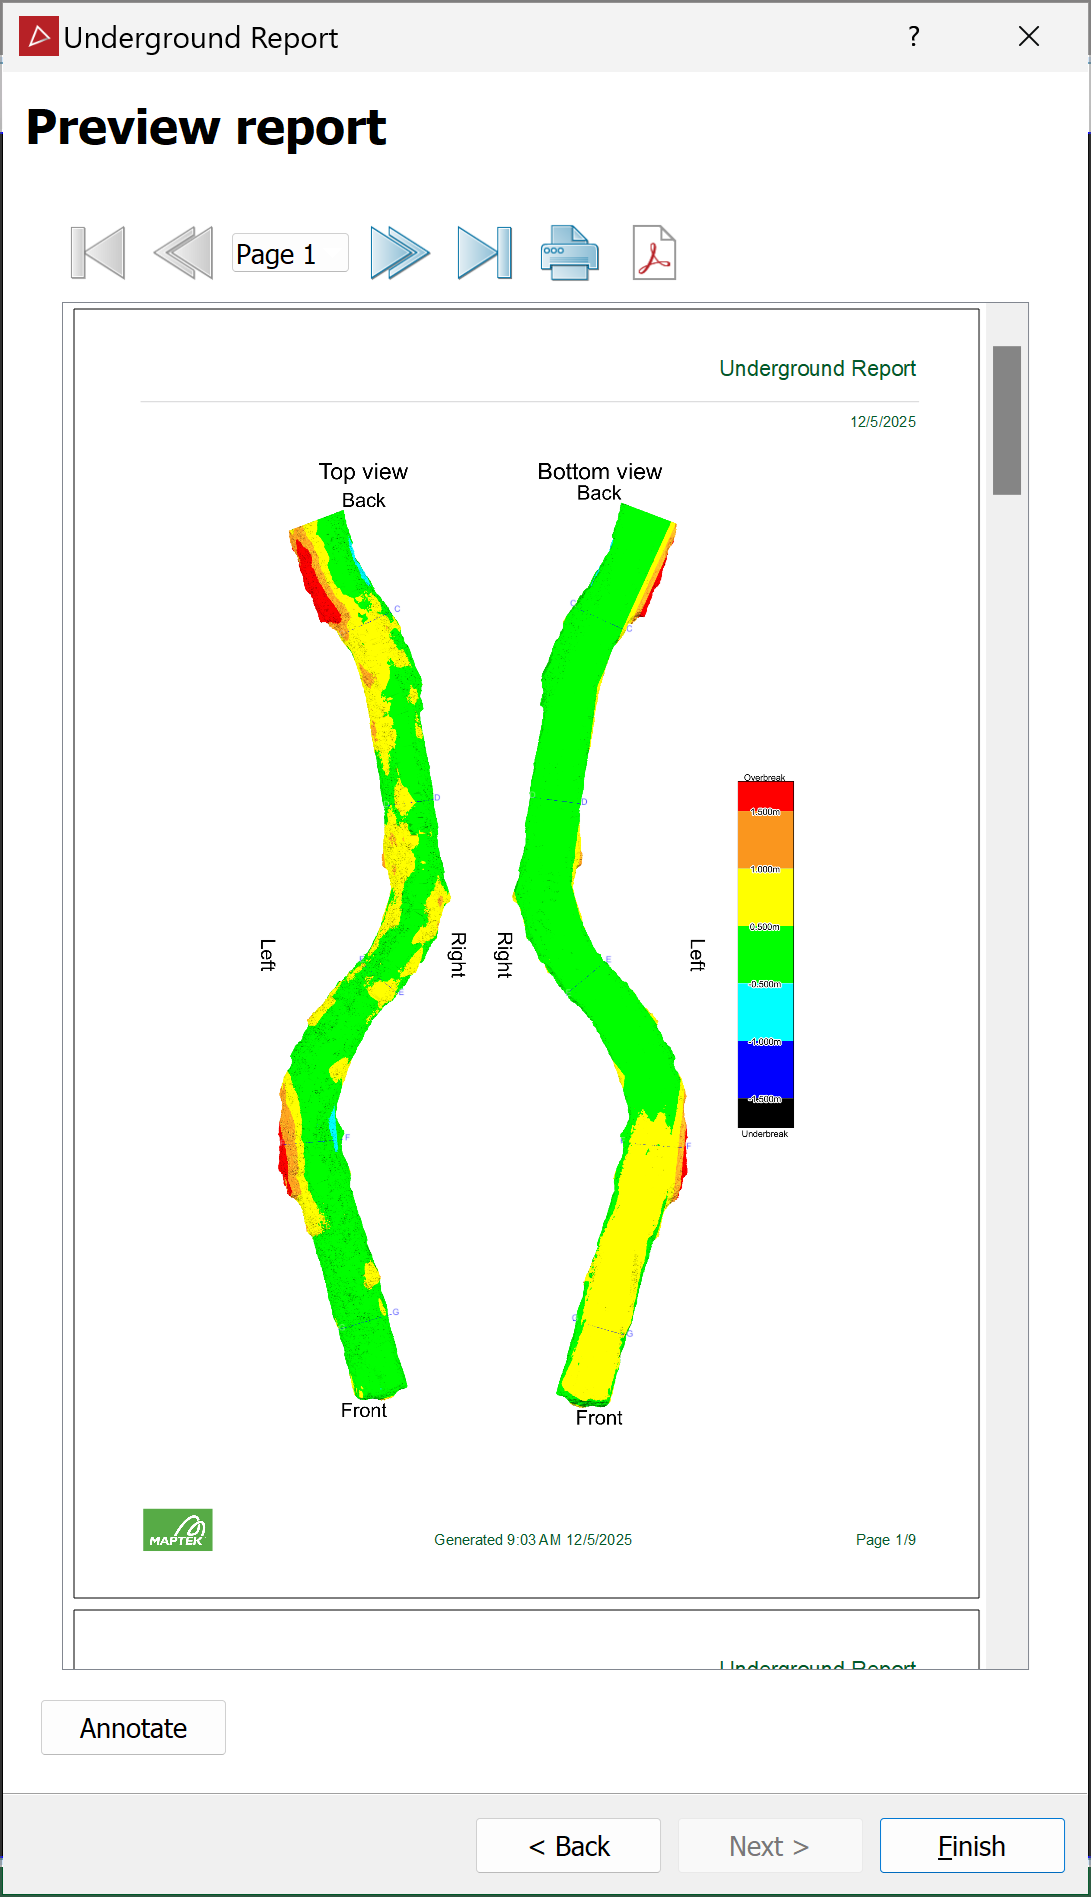
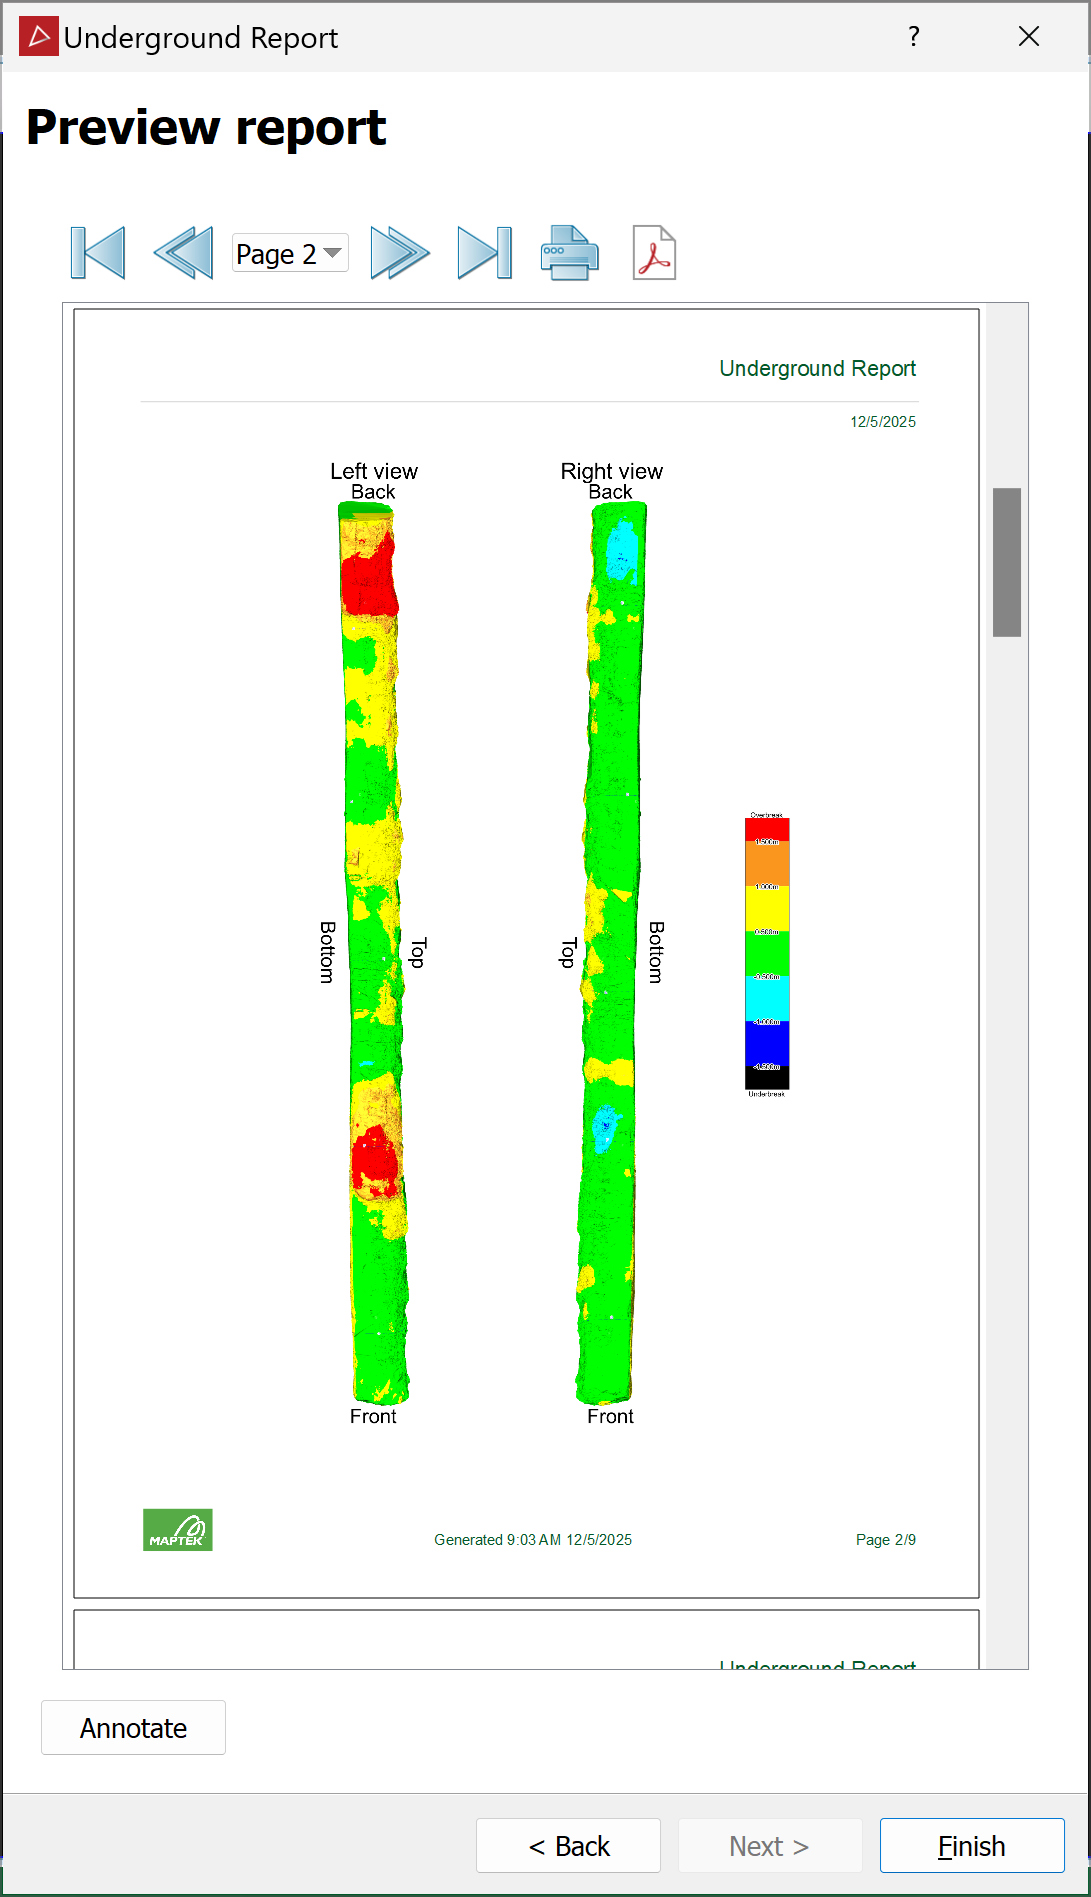
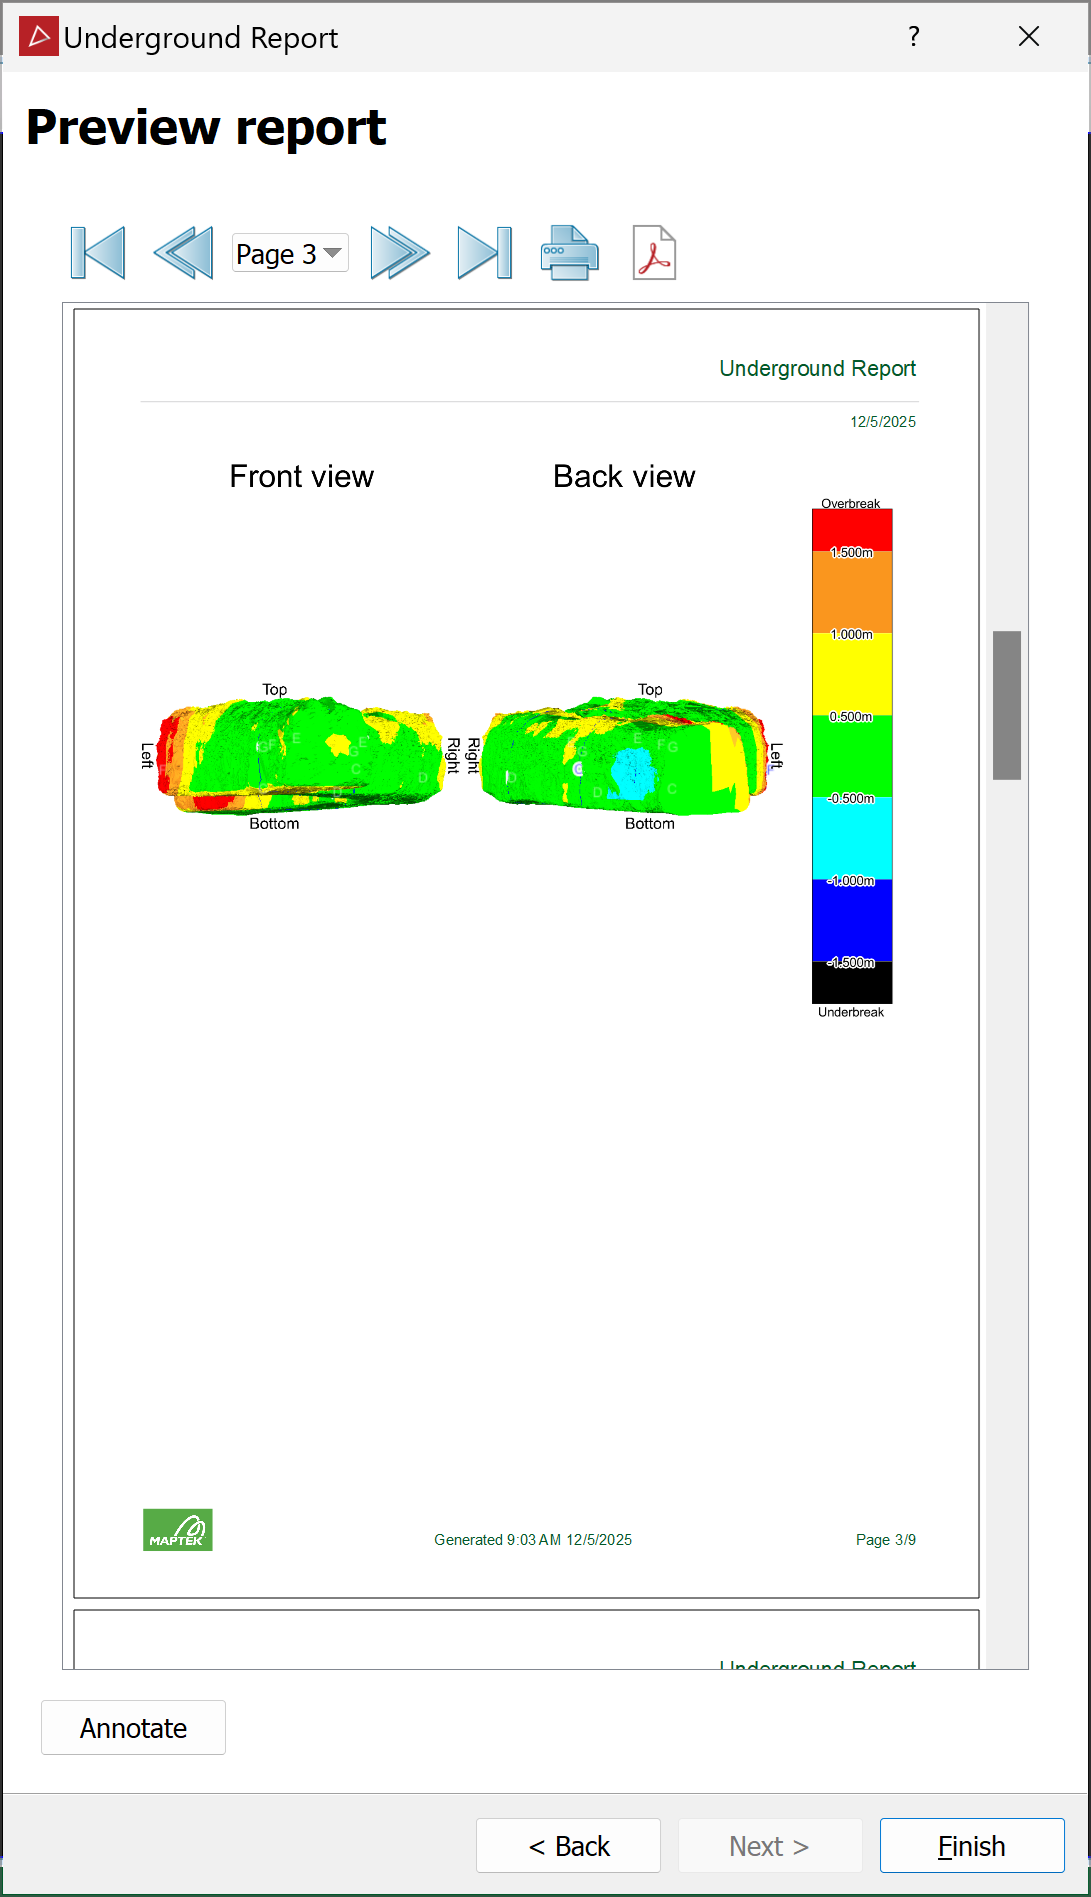
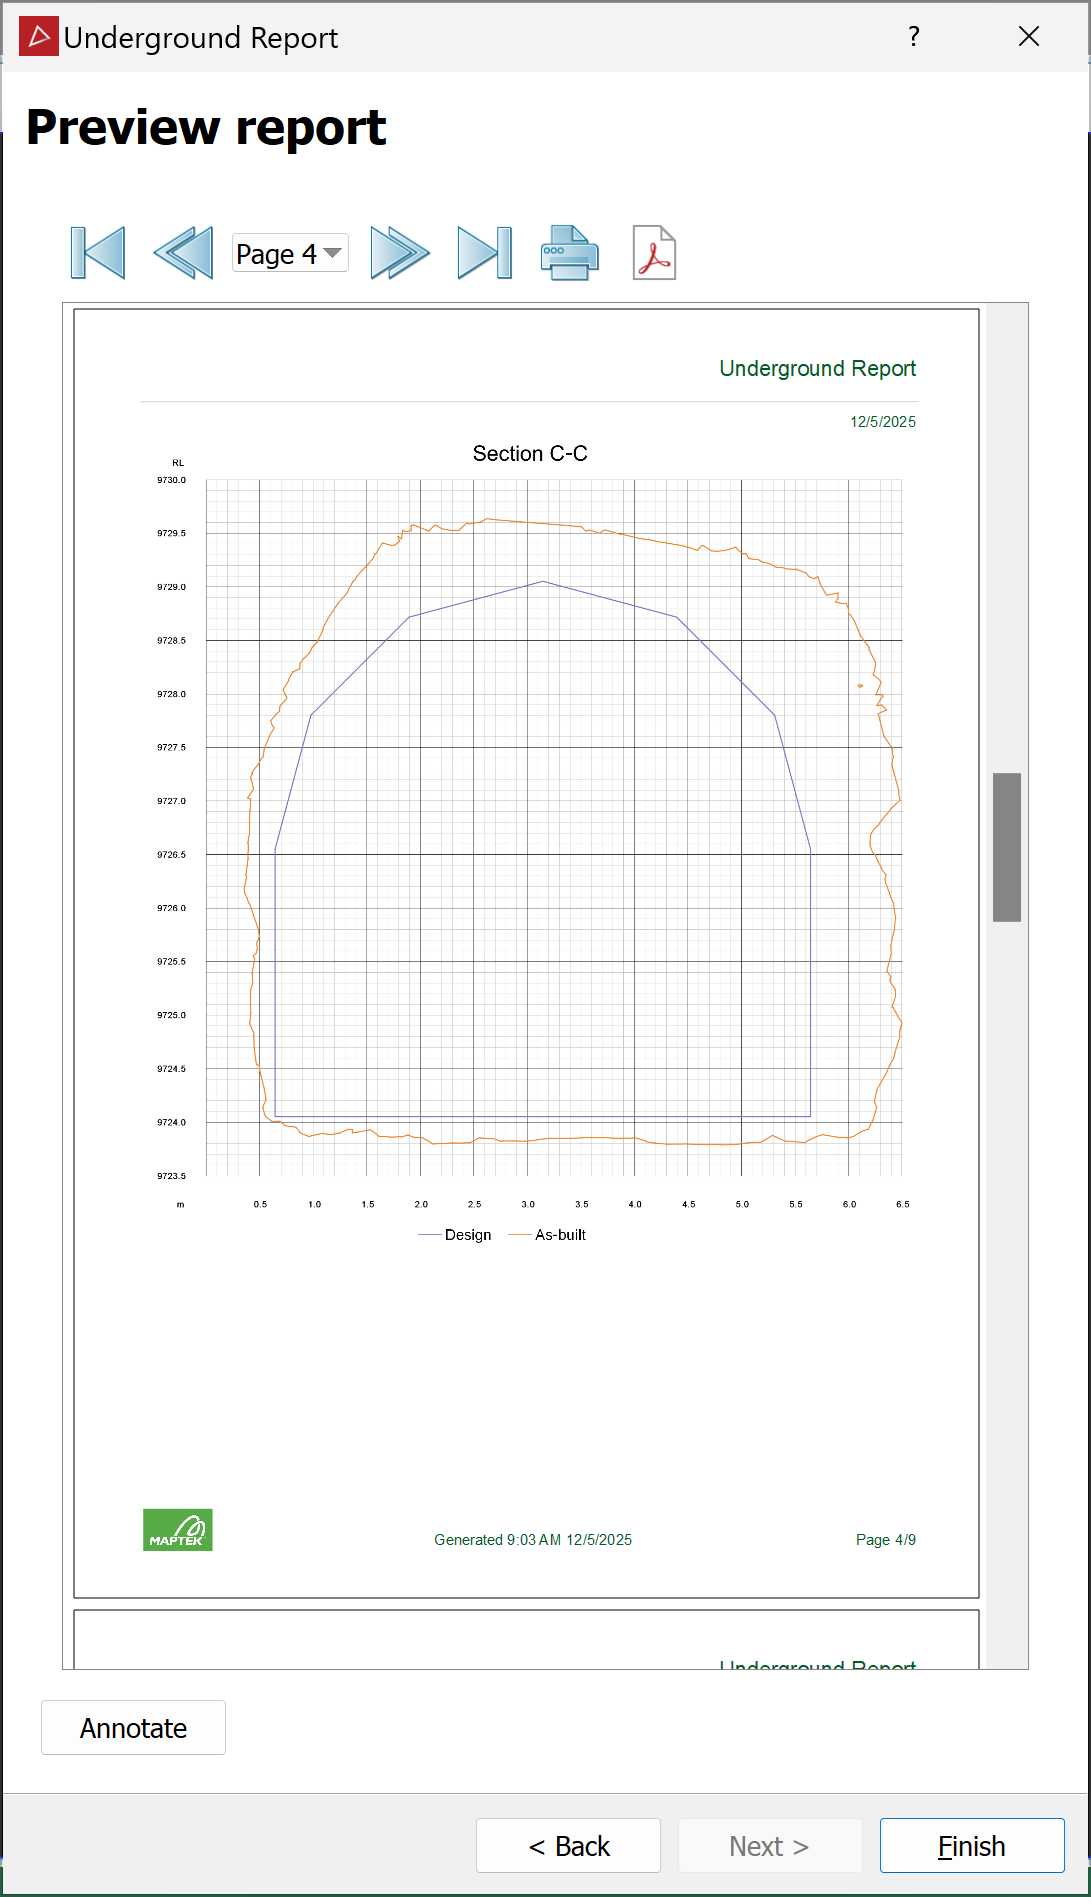
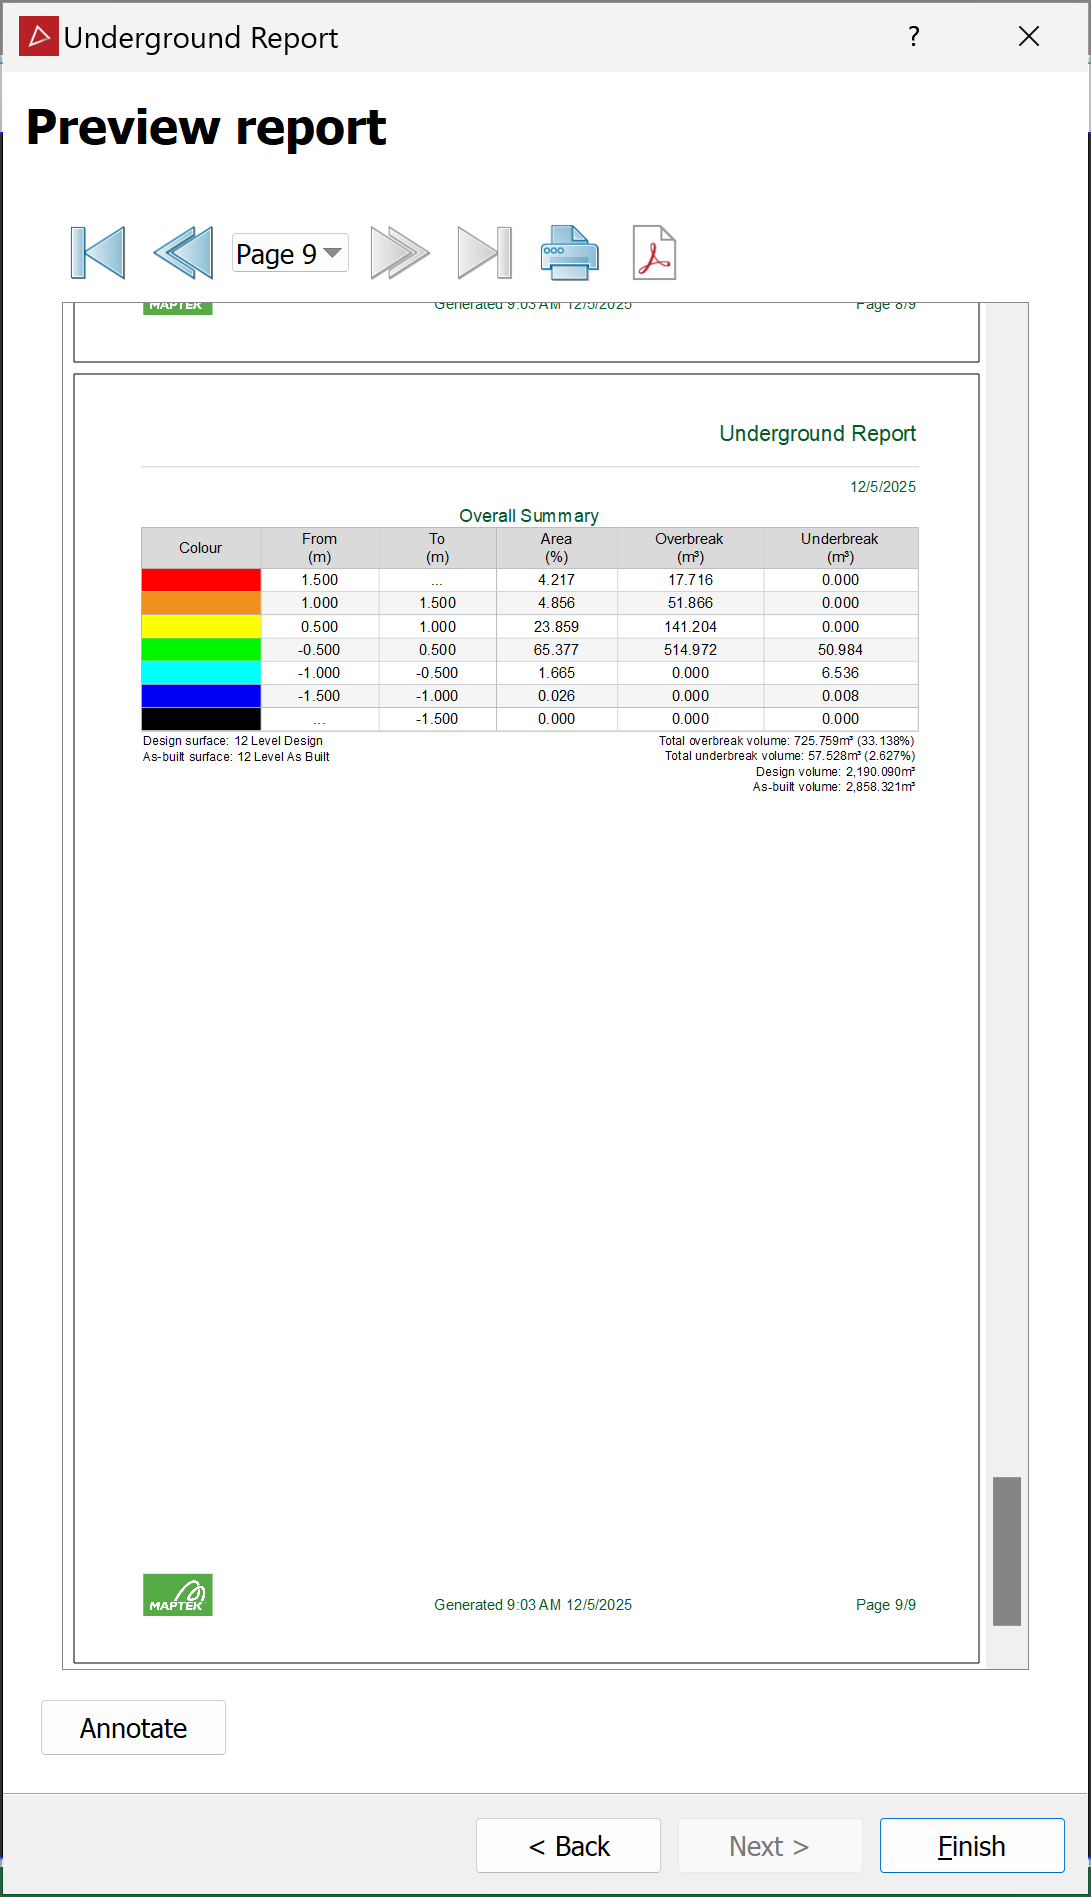
The report will also display all measurements for each cross section over multiple pages, and end with a results summary table.
-
Click < Back to make any further changes.
-
Click Annotate to add comments to each section of the report before publishing.
-
Click the
 button to print the report.
 -
Click the
 button to save the report as a PDF.
 -
Click the
 button to save the report as a CSV or text file.
-
-
Click Finish when done.
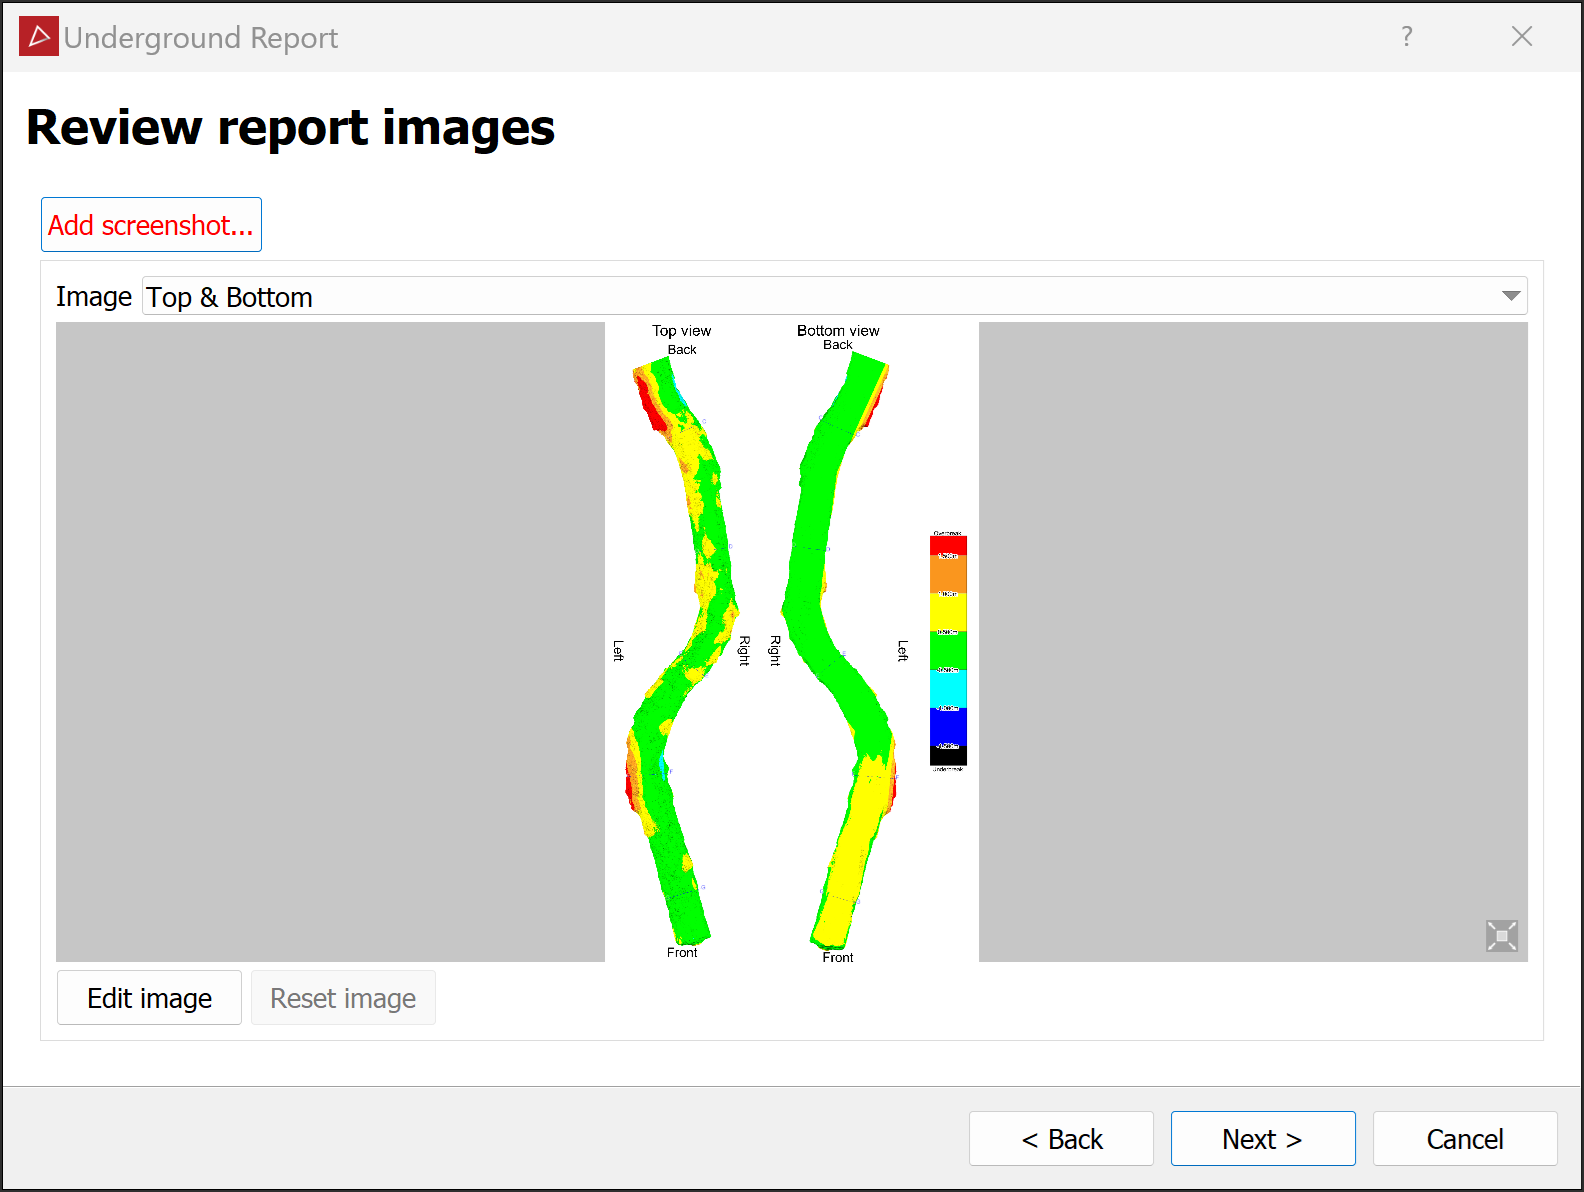
Review the report images and make any final adjustments, if needed. To do this, click Edit image to open the Windows default image editor.
