Inter-Ramp Compliance
Note: Inter-Ramp Compliance (IRC) is an add-on that requires additional licensing, which may be obtained via your Maptek Account portal. Please see Licensing Applications in Workbench help for details.
The Inter-Ramp Compliance reporting tool (Query tab > Reporting group) enables you to analyse bench face angles and catch bench widths, then generate reports detailing the compliance with site specific tolerances.
The IRC reporting tool also creates a set of output objects in a secondary container ![]() (in the
(in the ![]()
scrapbook container) named for the boundary polygon. This container will be referred to below as the output container. You can choose not to generate some of these objects, as explained under Content in step 5, below. You can view these output objects in PointStudio for further inspection. Using the results, you can identify areas
of concern in wall angles and catch bench widths for stability,
rock fall, and design optimisation.
Before running the IRC reporting tool, you must create the following objects to define the area for analysis:
-
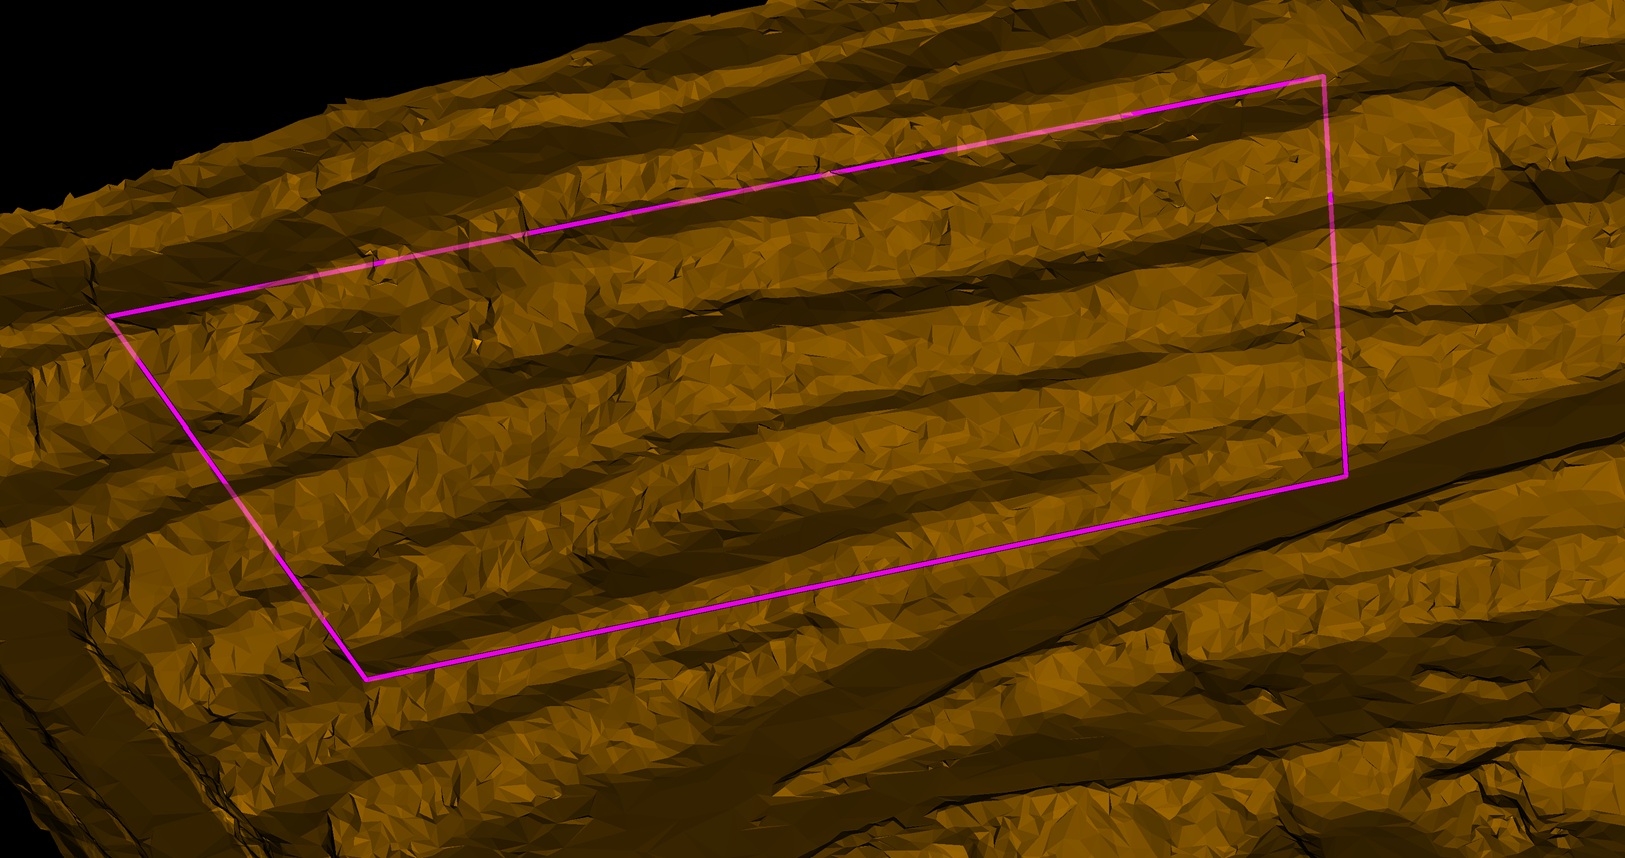
A bounding polygon surrounding the region you want to report on.
-
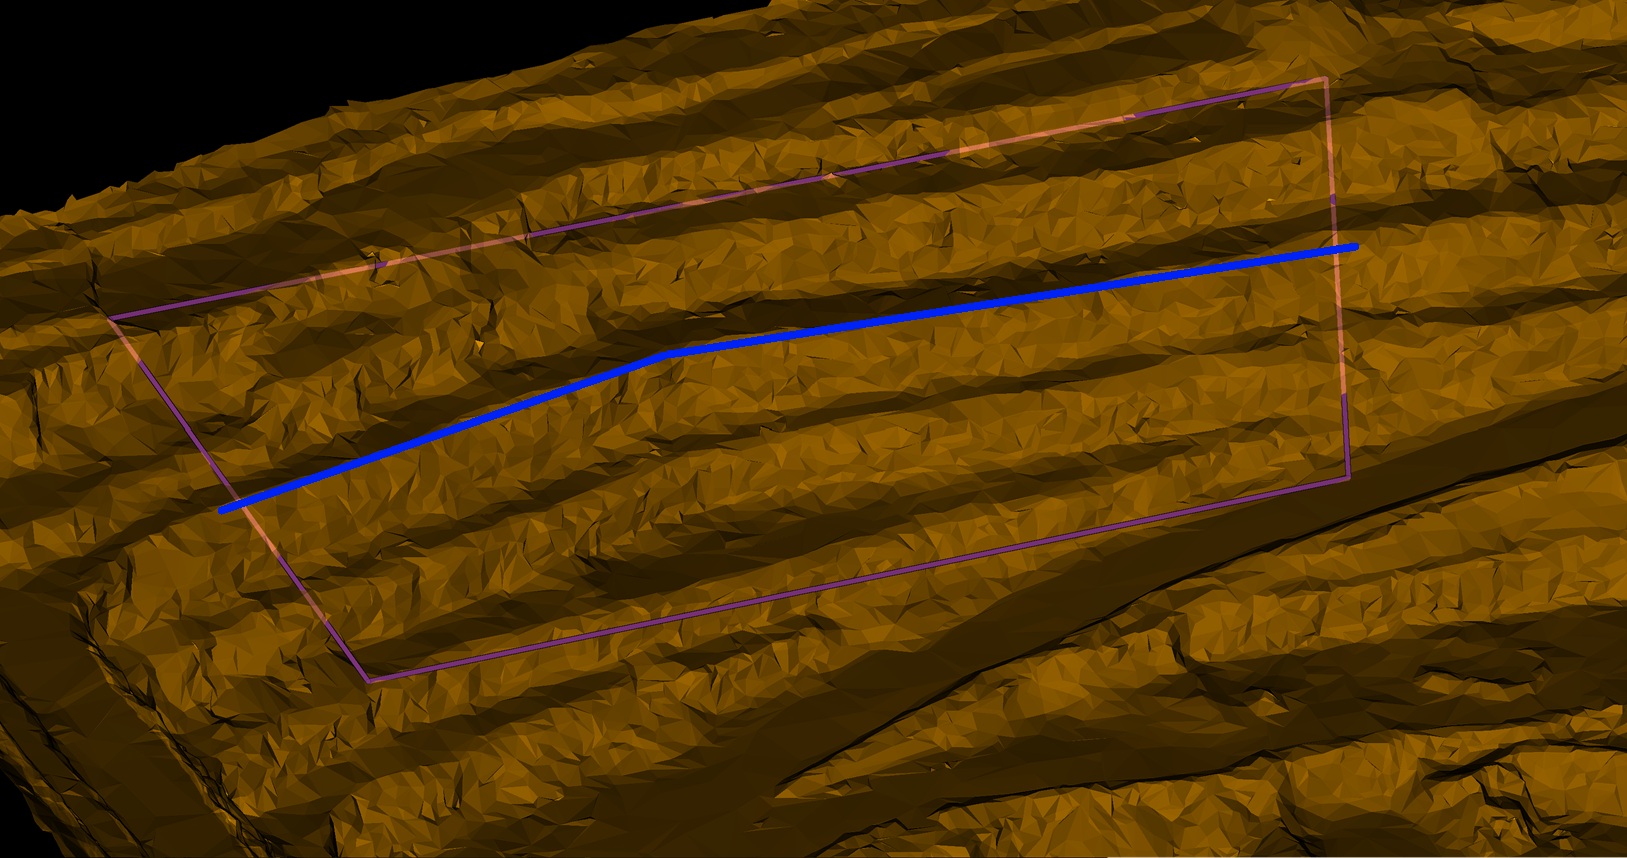
A segments line to define the direction of the wall. Strips are created perpendicularly to the segments line.
-
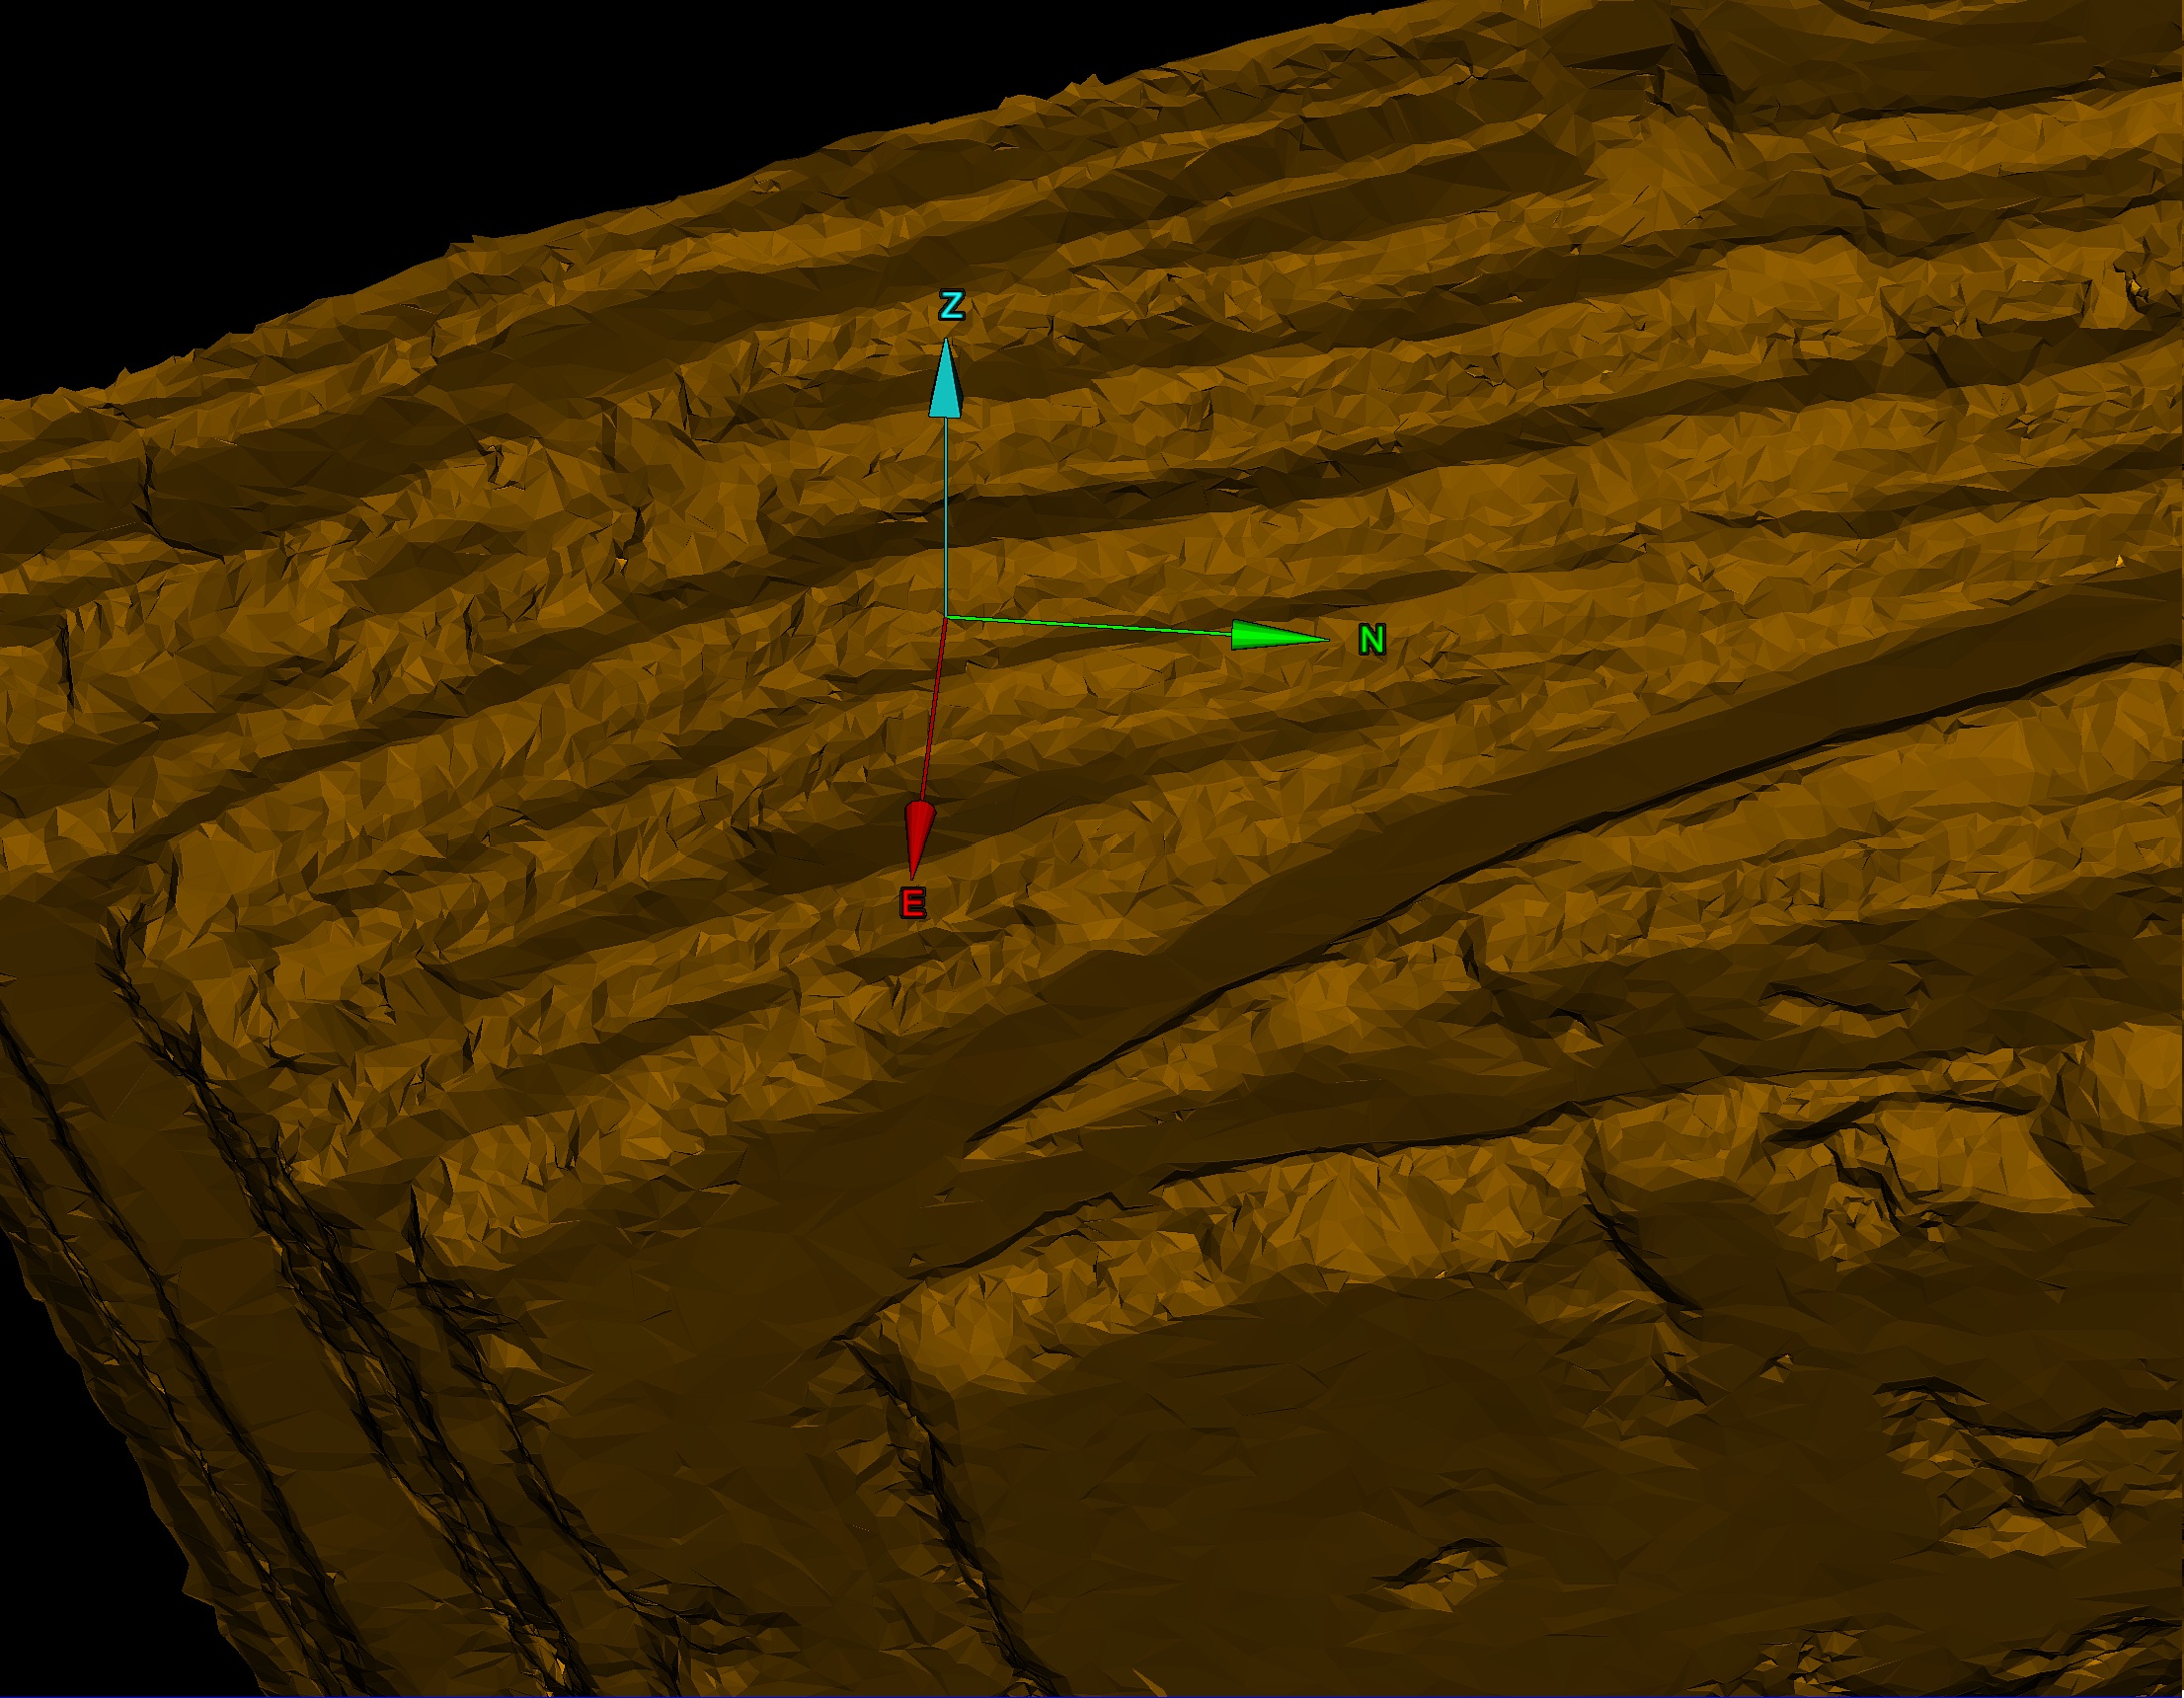
The as-built surface, which is used for visualising the analysis results.
Create any of the following optional objects as well, to enhance the analysis and report:
-
An additional surface for comparing cross sections.
-
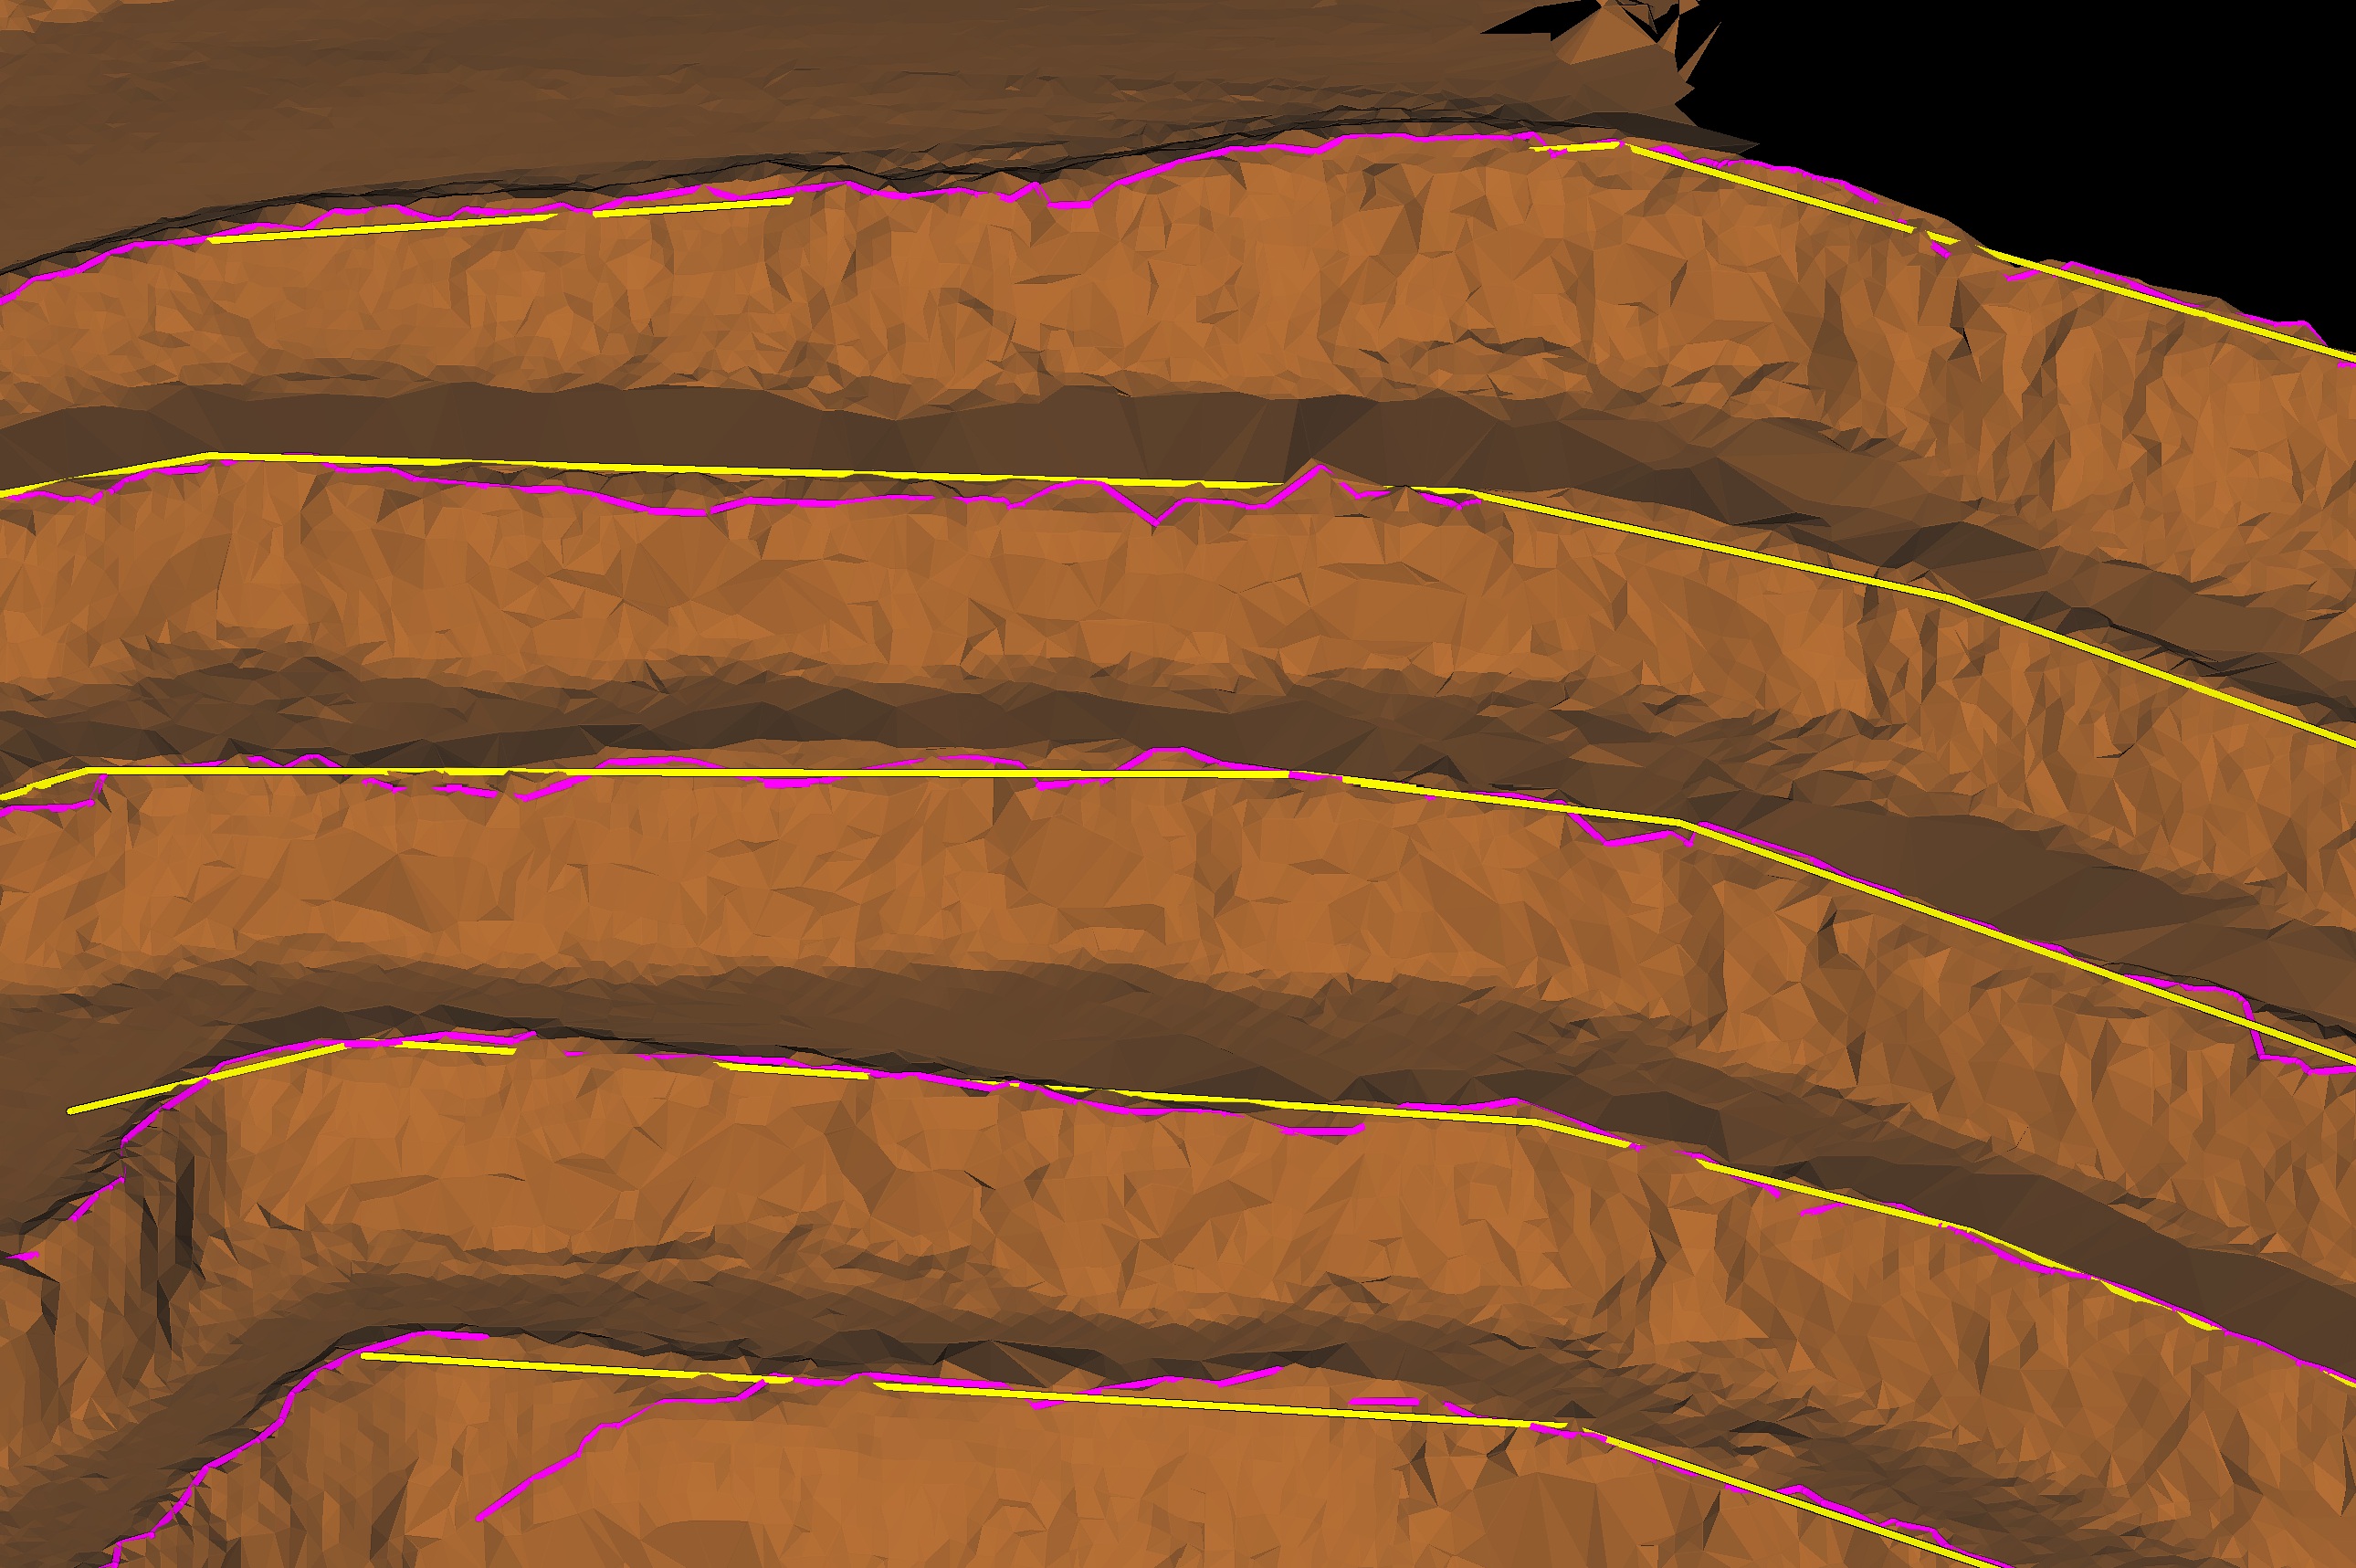
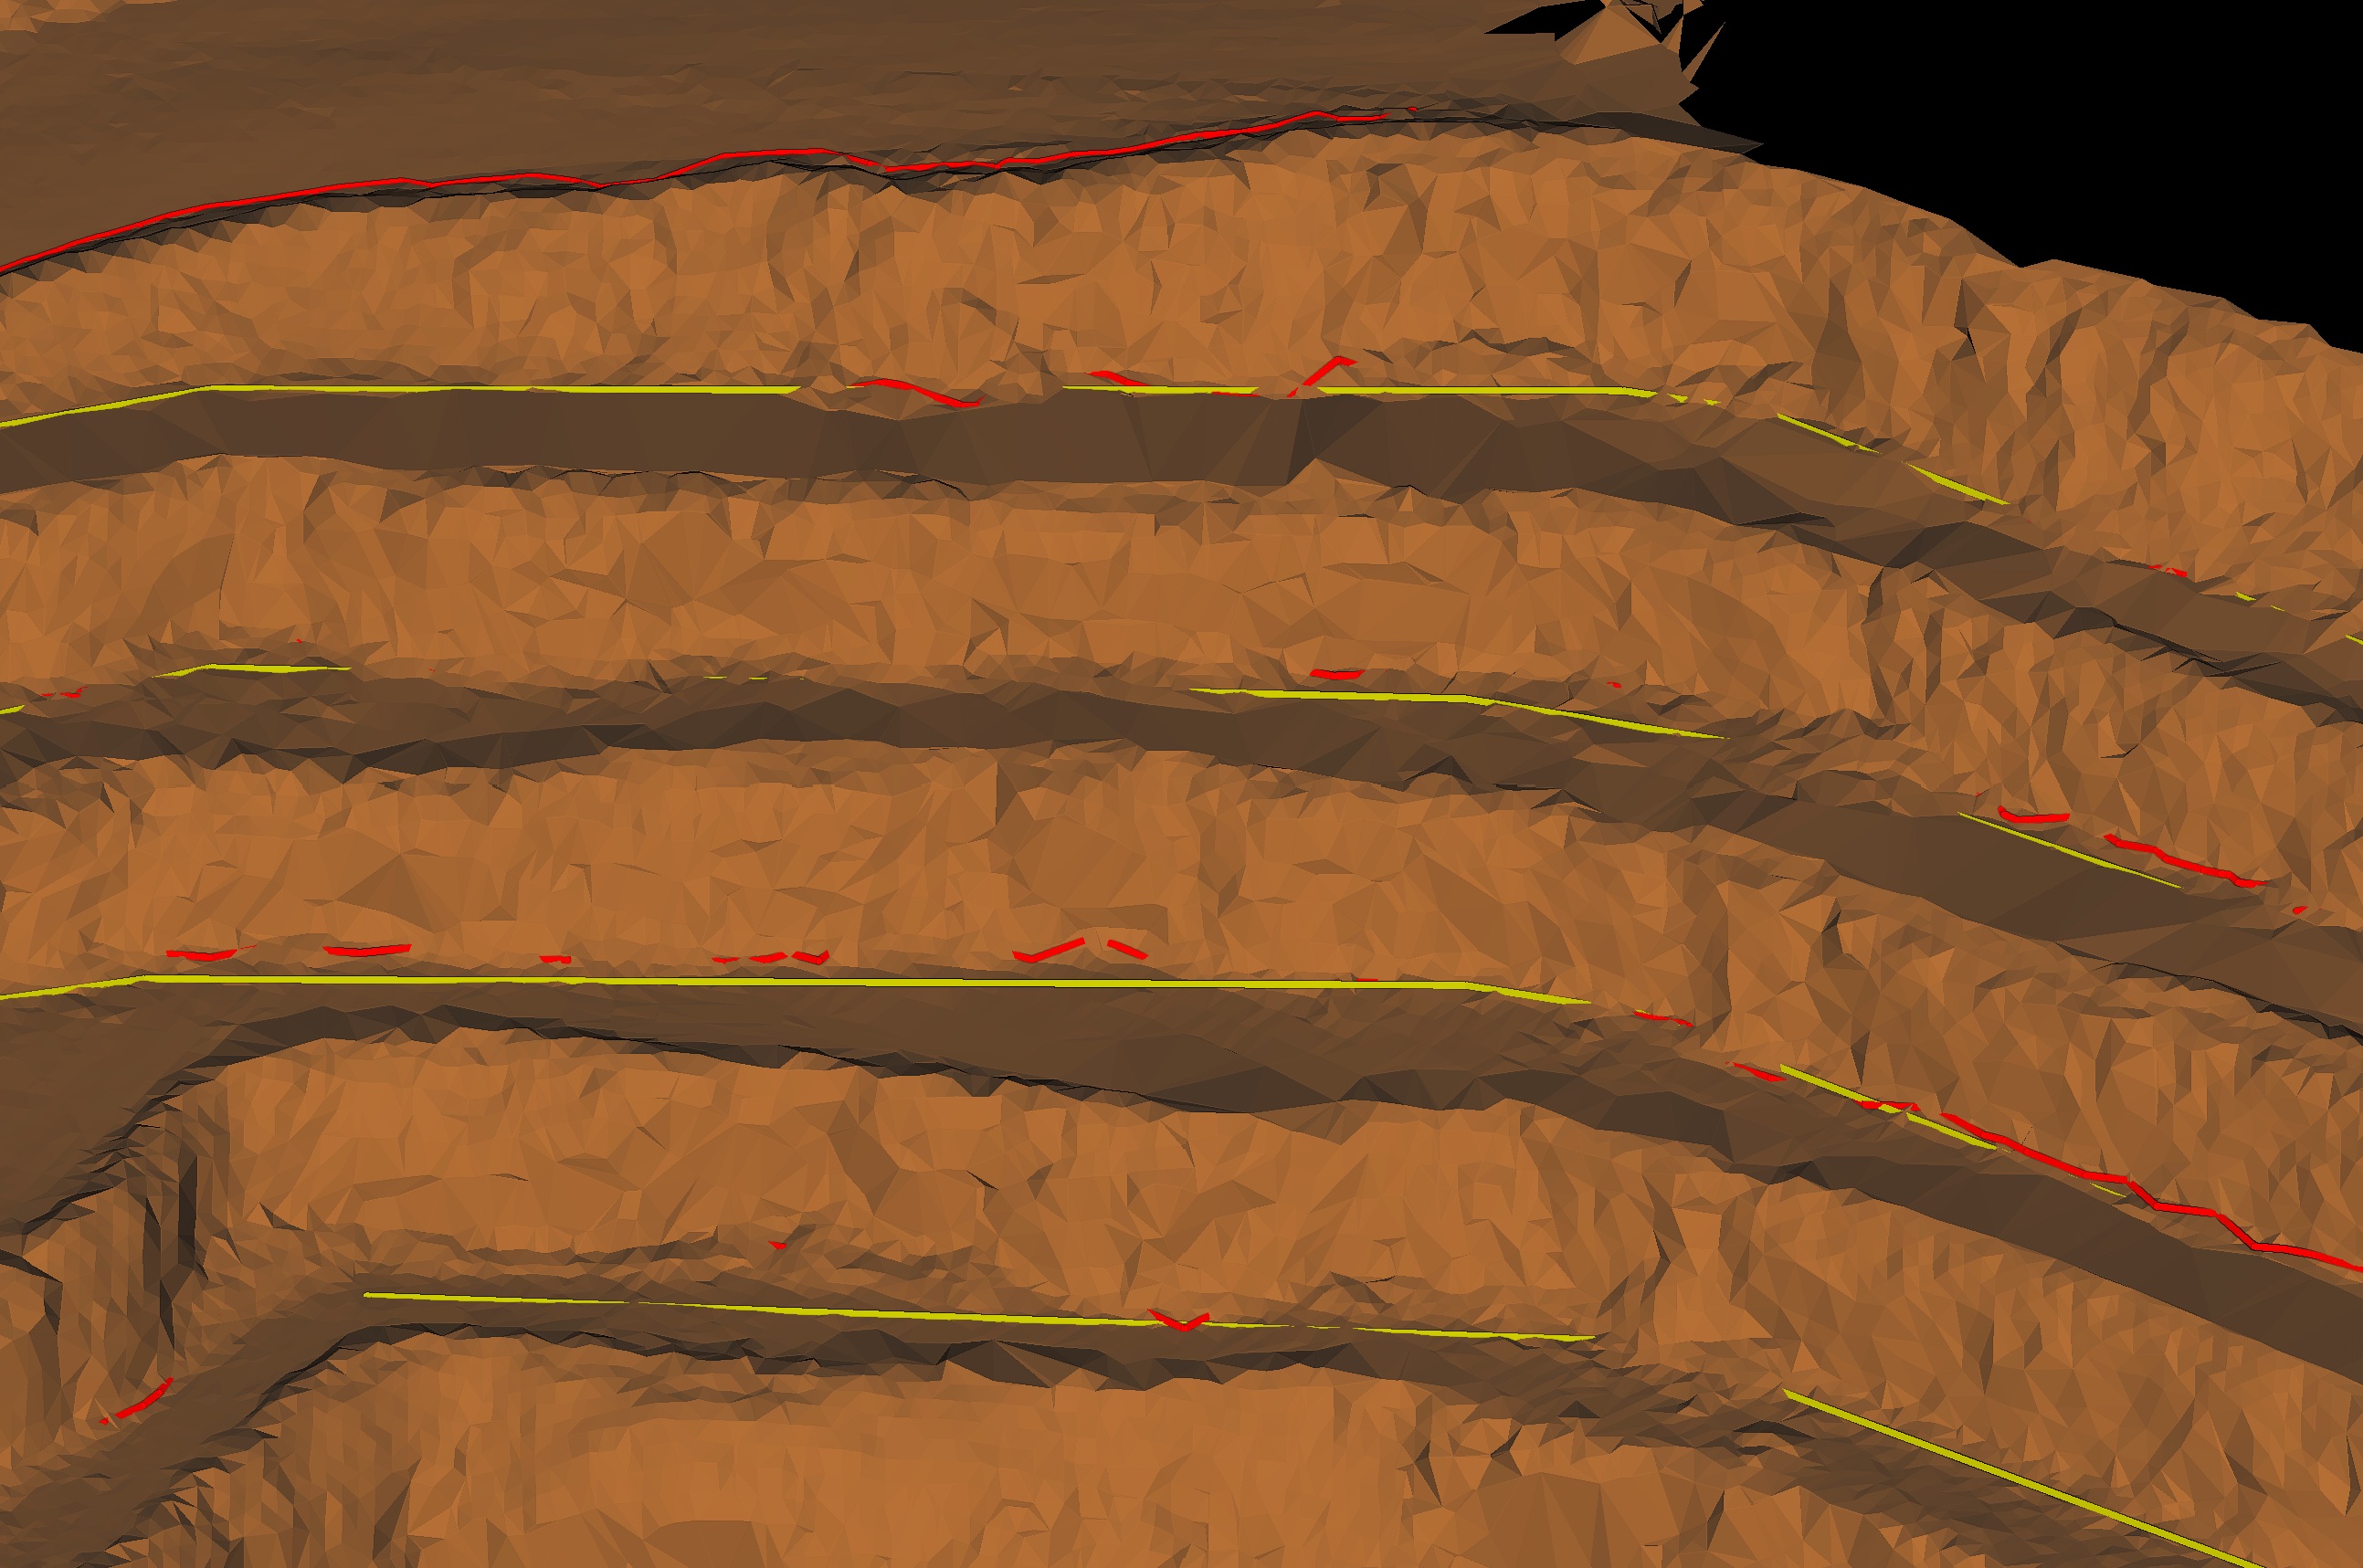
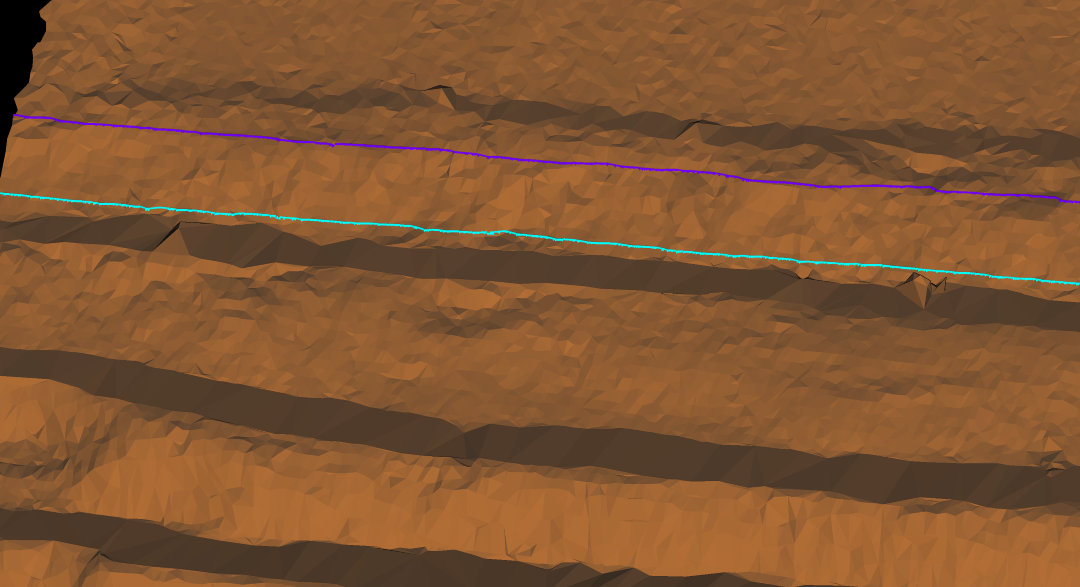
Design and as-built crest lines of the pit benches.
-
Design and as-built toe lines of the pit benches.
-
Back break lines to indicate the transition from back break to wall.
-
Division lines to separate sections of the analysis region.
Note: The report tool will not calculate a strip that spans a division line.
-
Muck top and bottom lines. If an actual toe line is obscured by a muck pile, you can specify the muck top and bottom lines.
-
Contour lines. Use these to define the bench face angle more accurately when the small lip resulting from a double-height bench would cause the crest-to-toe measurement to be inaccurate. Create contours at the top and bottom of the region across which to calculate the wall angle. Explode the contours (see Fix > Explode), then add only the relevant contour lines in the report data, excluding any superfluous lines.
Tip: Move the required contour lines into a separate container to ensure the correct lines are selected for the report.
Follow the naming convention below for the objects. When you select them with the IRC tool open on its Specify report data page, the respective fields will automatically populate.
-
Bounding polygon: include
boundary -
Segments line: include
segmentorsection -
As built surface: do not include
additionalordesign -
Additional surface: include
additionalordesign, but nottoe, andcrestoruc -
Design crest lines: include
designandcrestoruc -
Design toe lines: include
designandtoe -
As built crest lines: include
crestoruc, but notdesign -
Back break lines: include
bb,backorbreak -
As built toe lines: include
toe, but notdesign -
Division lines: include
division -
Muck top lines: include
tomortopandtoem -
Muck bottom lines: include
bottomorbom -
Contour lines: include
contour
If you also place all the objects in one container, selecting that container will automatically populate all the respective fields in the IRC tool.
When all the required lines ![]() , polygons
, polygons ![]() and surfaces
and surfaces ![]()
![]() are ready, follow these steps to generate a design conformance report:
are ready, follow these steps to generate a design conformance report:
-
On the Query tab, in the Reporting group, click
 Inter-ramp Compliance.
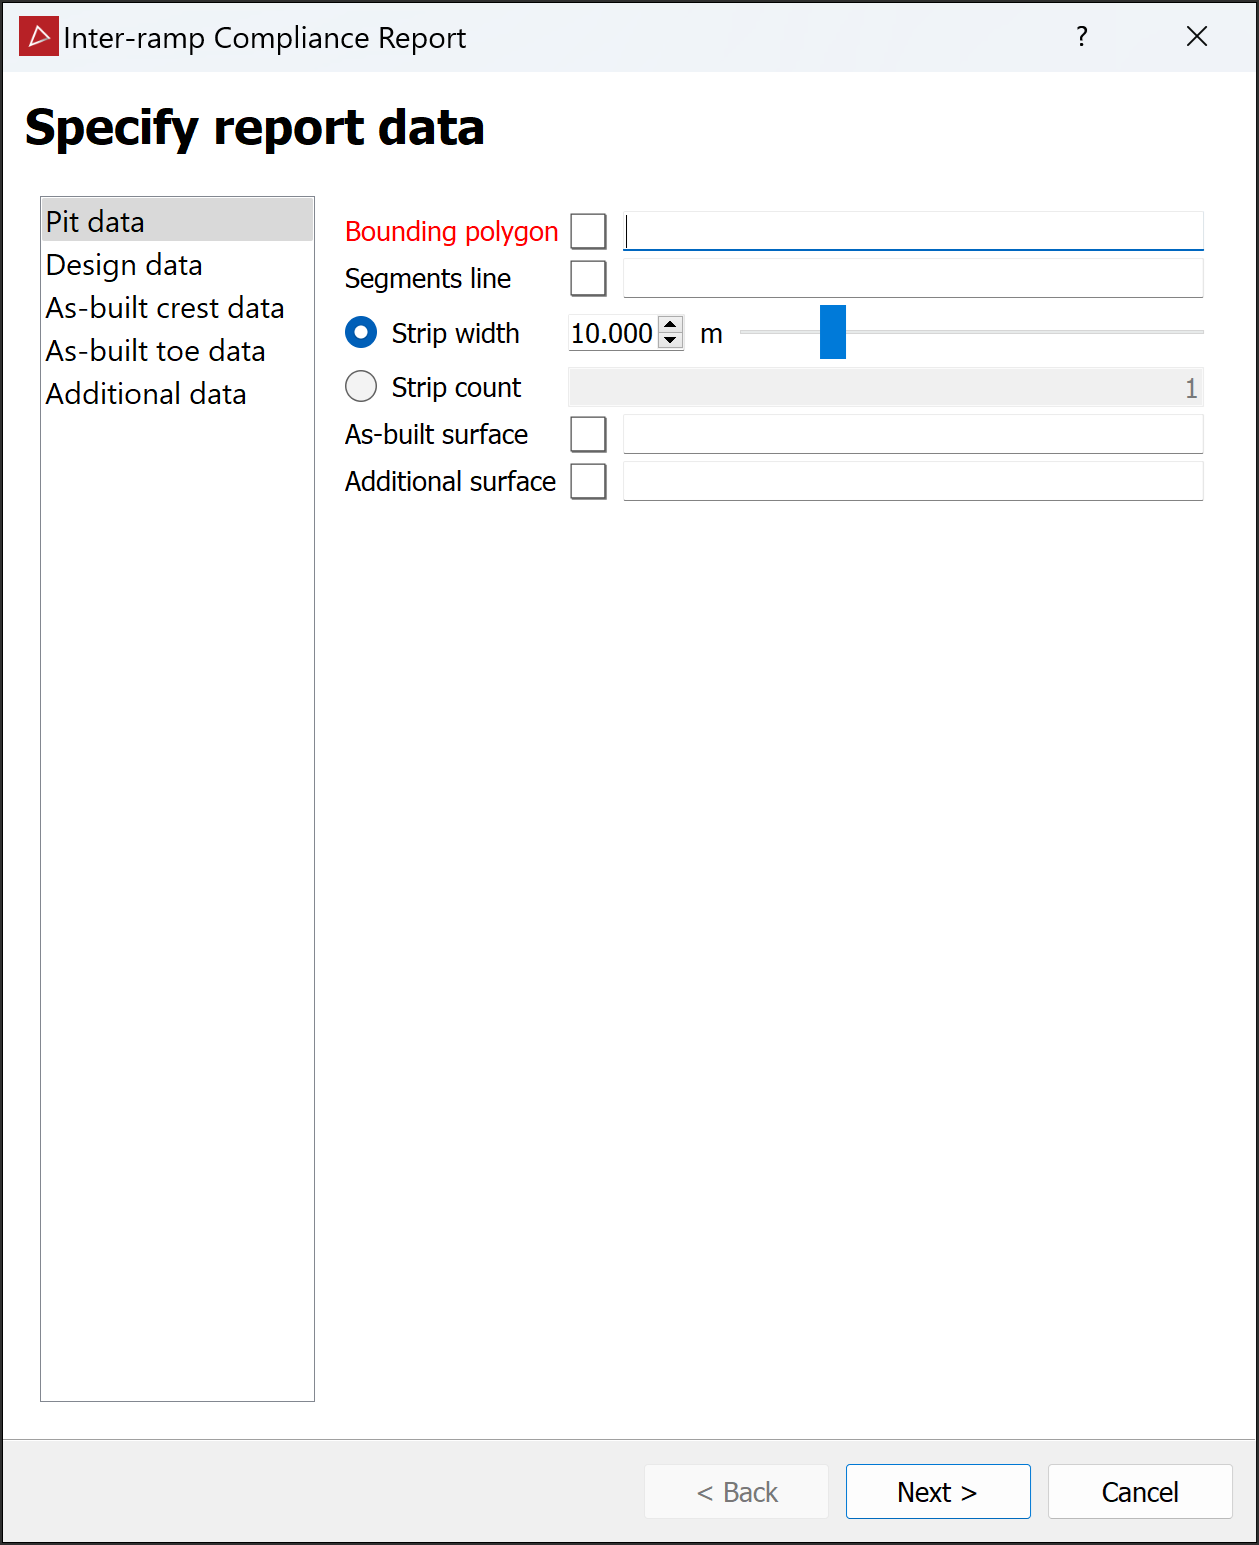
The Inter-ramp Compliance Report panel will open on its Specify report data page.
-
If you have used the recommended naming convention and placed the above objects in one container, select that container to populate the Specify report data page. Otherwise, select the objects one-by-one or drag them into their respective fields in each data tab.
Note: As soon as you add the bounding polygon and segments line, you will see a visualisation of the compliance report area and strip network in the active view window. The visualisation is placed horizontally at the highest elevation point of the bounding polygon. The visualisation is not saved as an object in the project.
-
Choose between Strip width and Strip count and enter appropriate values to specify the size or quantity of strips to be used for analysis. The visualisation will change accordingly.
Note: Strip count is the number of strips per segment of the segments line. For example, if the segments line has three segments and the strip count is five, there will be a total of 15 strips.
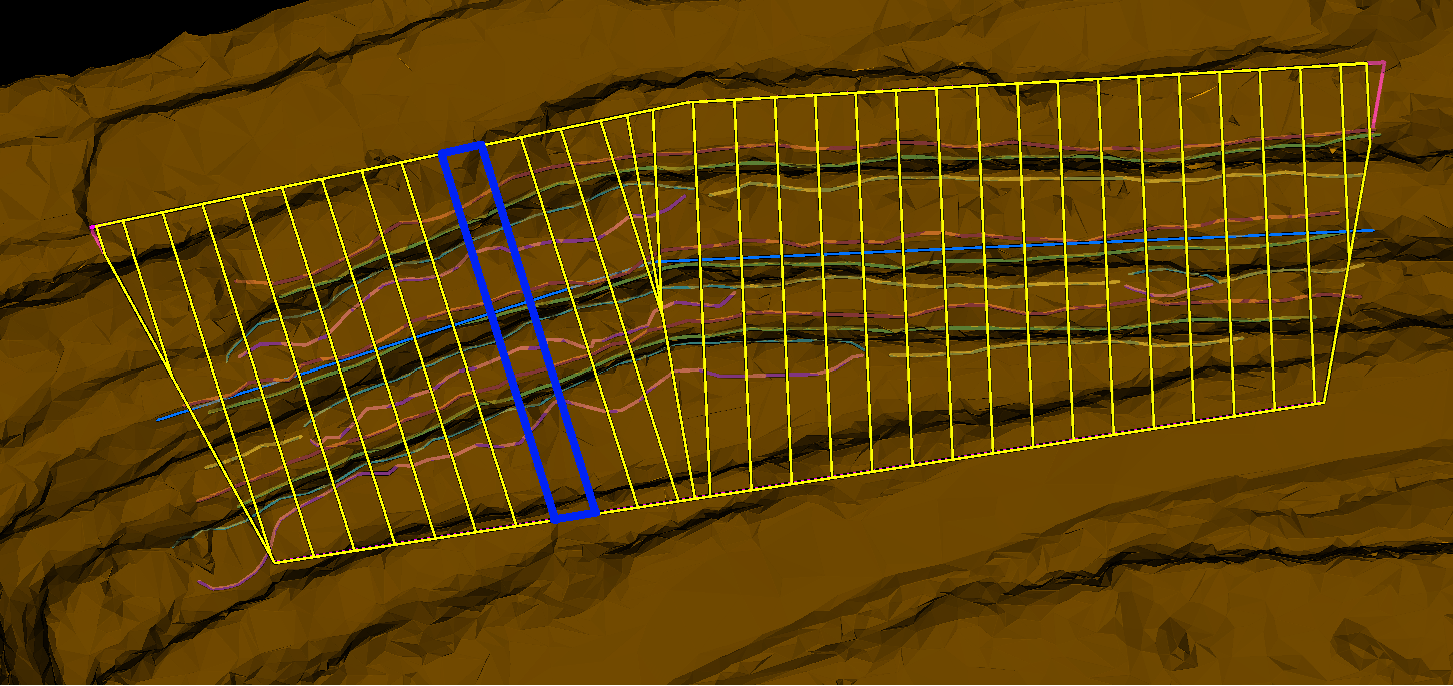
Strips defined by width, set to
10m.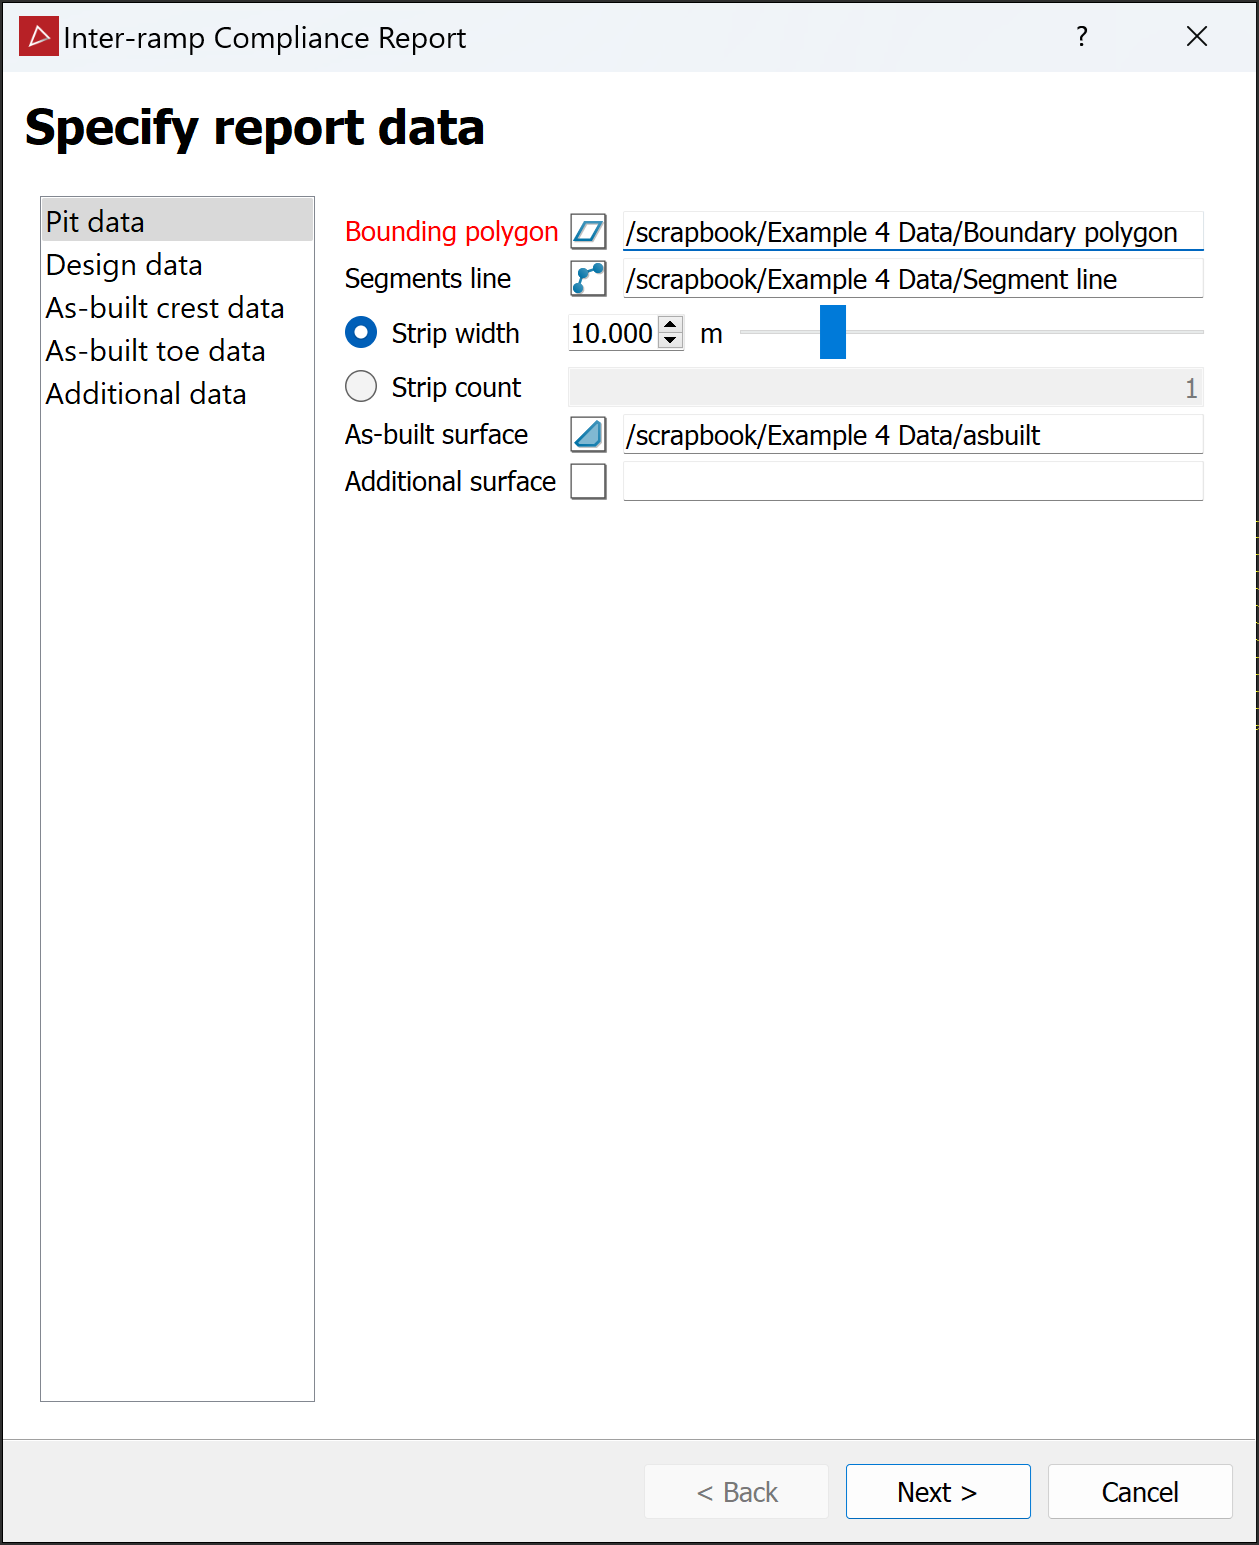
Tip: For all optional inputs: If the scan data includes muck, a lip, or back breaks, use the lines created from them, including contour lines, for a more accurate result.
-
Click Next > to open the Configure report page.
-
Adjust the look of the report and the data that will be included with the following criteria:
-
Content: Select components to include with the report.
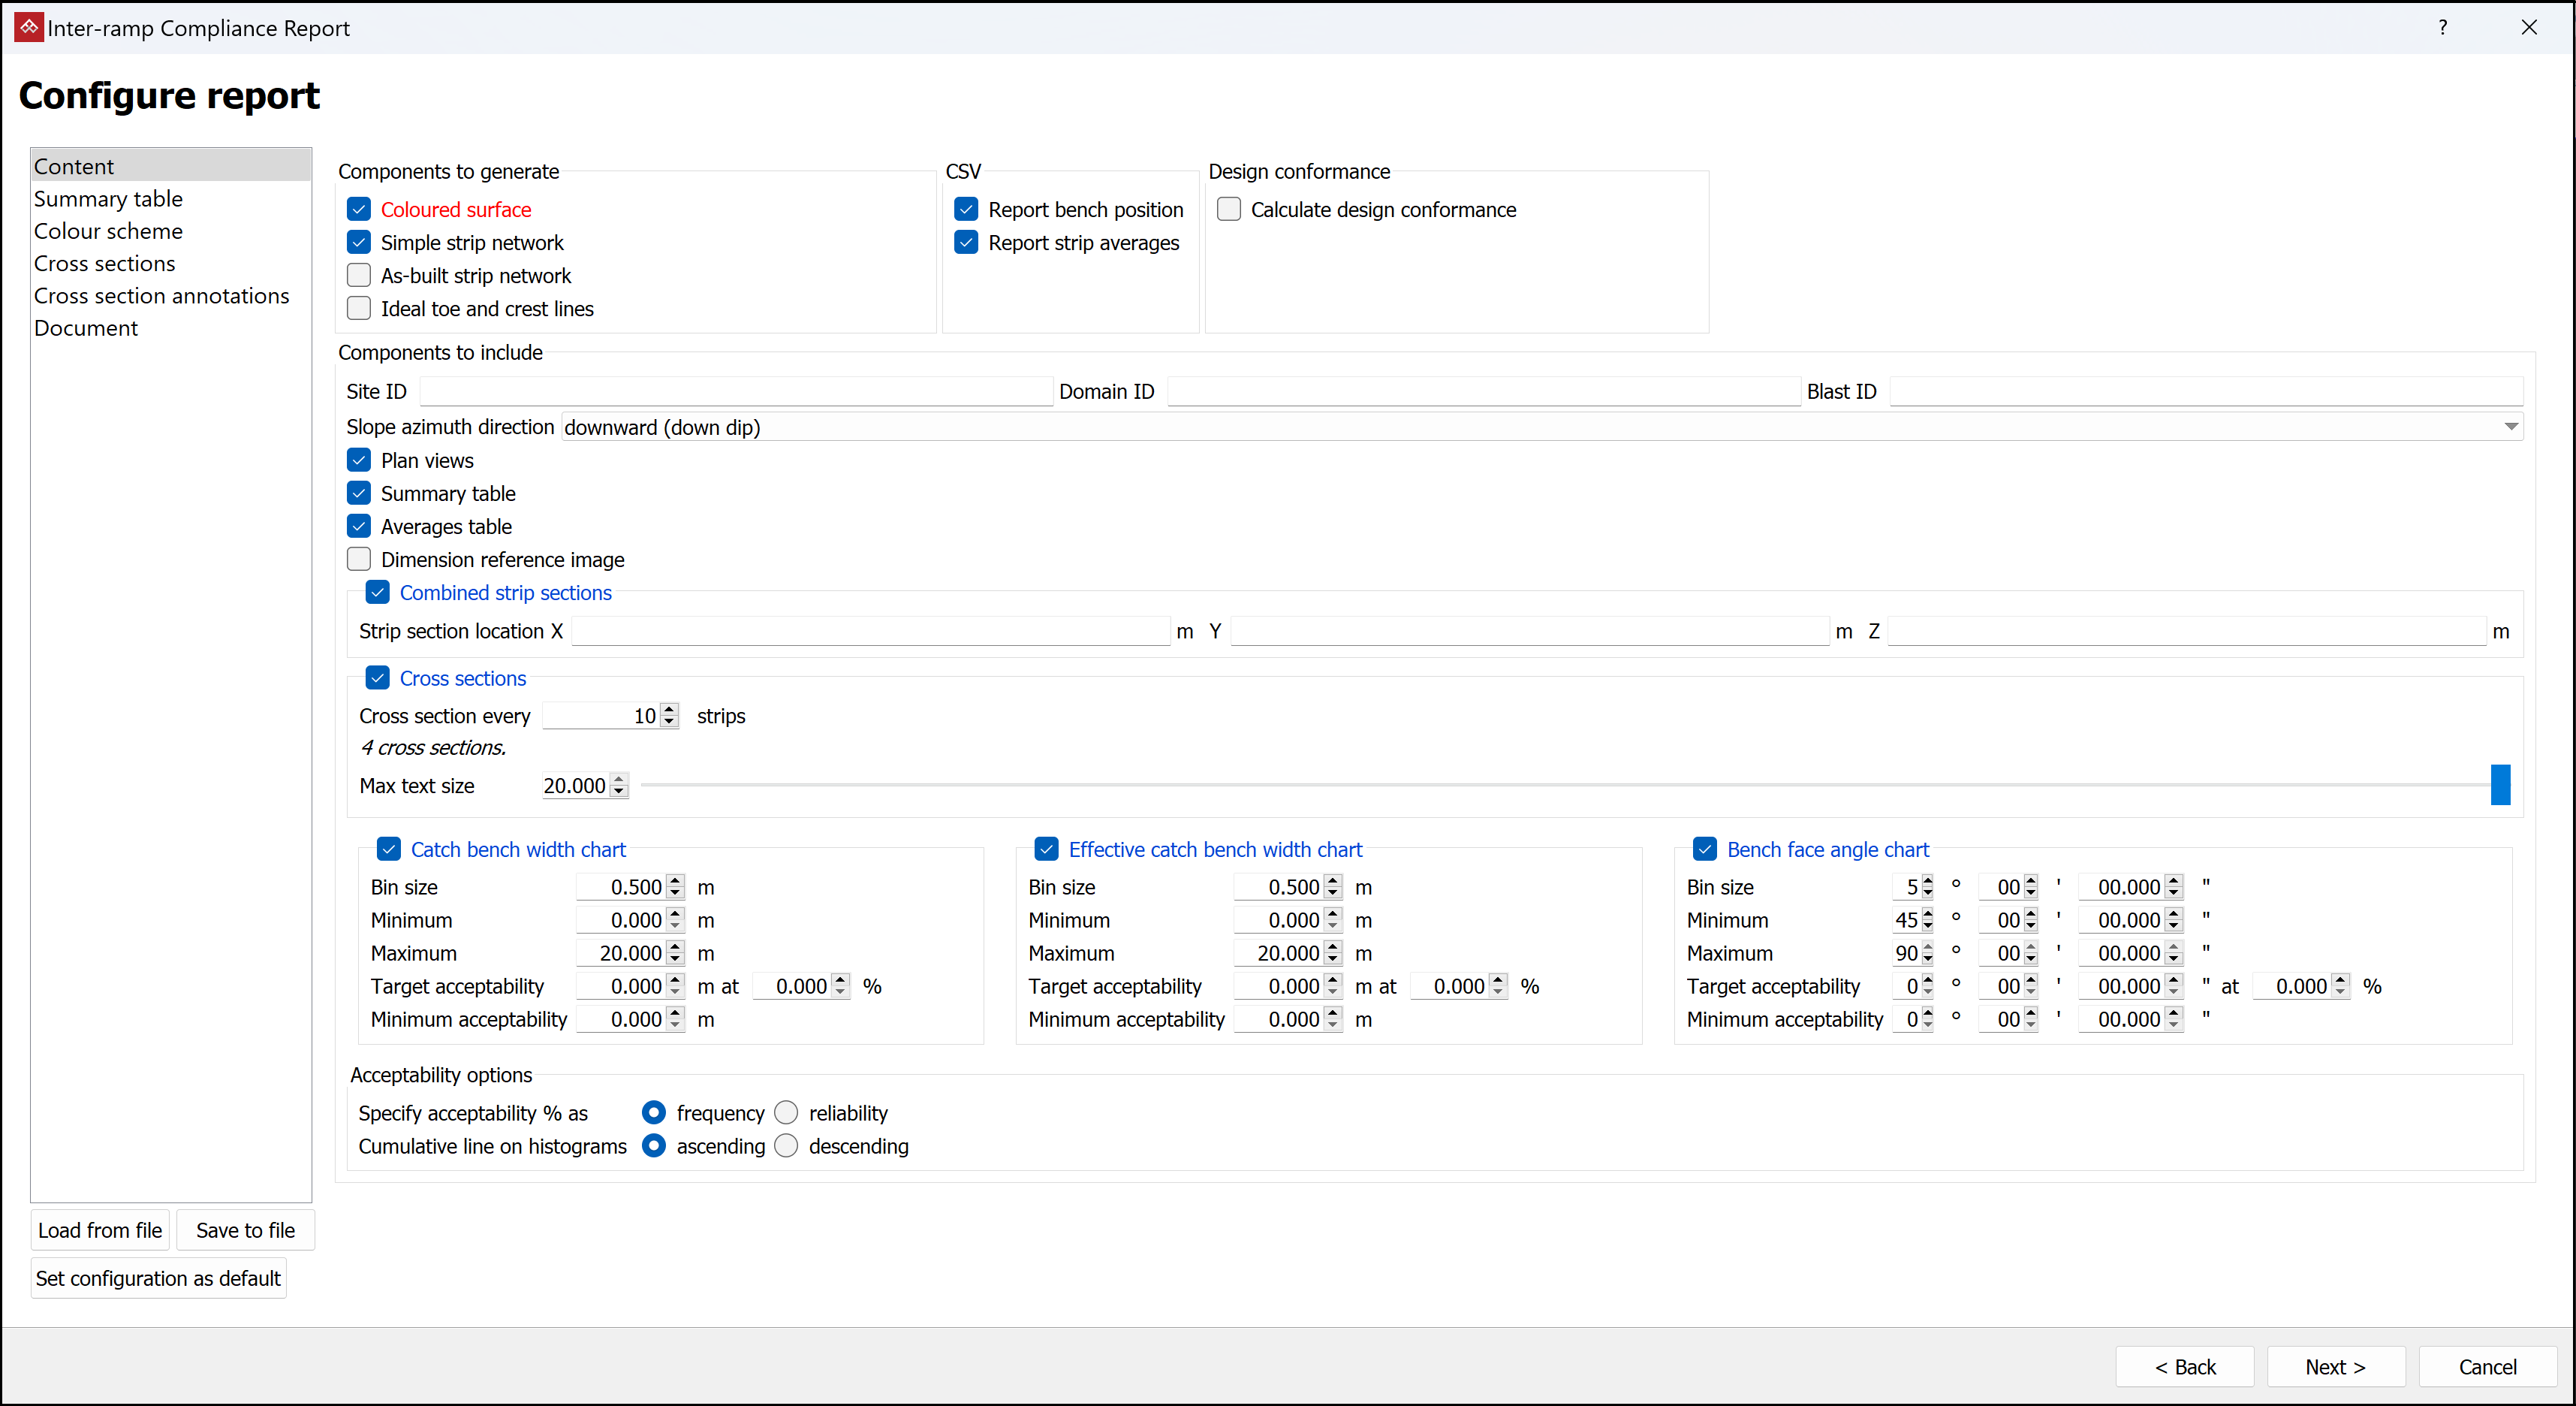

From the Components to generate group, select optional objects to be included in the output containers:
-
Coloured surface for a copy of the surface inside the bounding polygon, coloured to highlight areas of non-compliance.
-
Simple strip network for a collection of edge networks along the strip centrelines, coloured by compliance and placed in the
/scrapbook/Inter-ramp compliance resultscontainer.

-
As-built strip network for an edge network indicating the strip centrelines, placed in the
/scrapbook/IRC report of <boundary polygon name>/Inter-ramp compliance resultscontainer.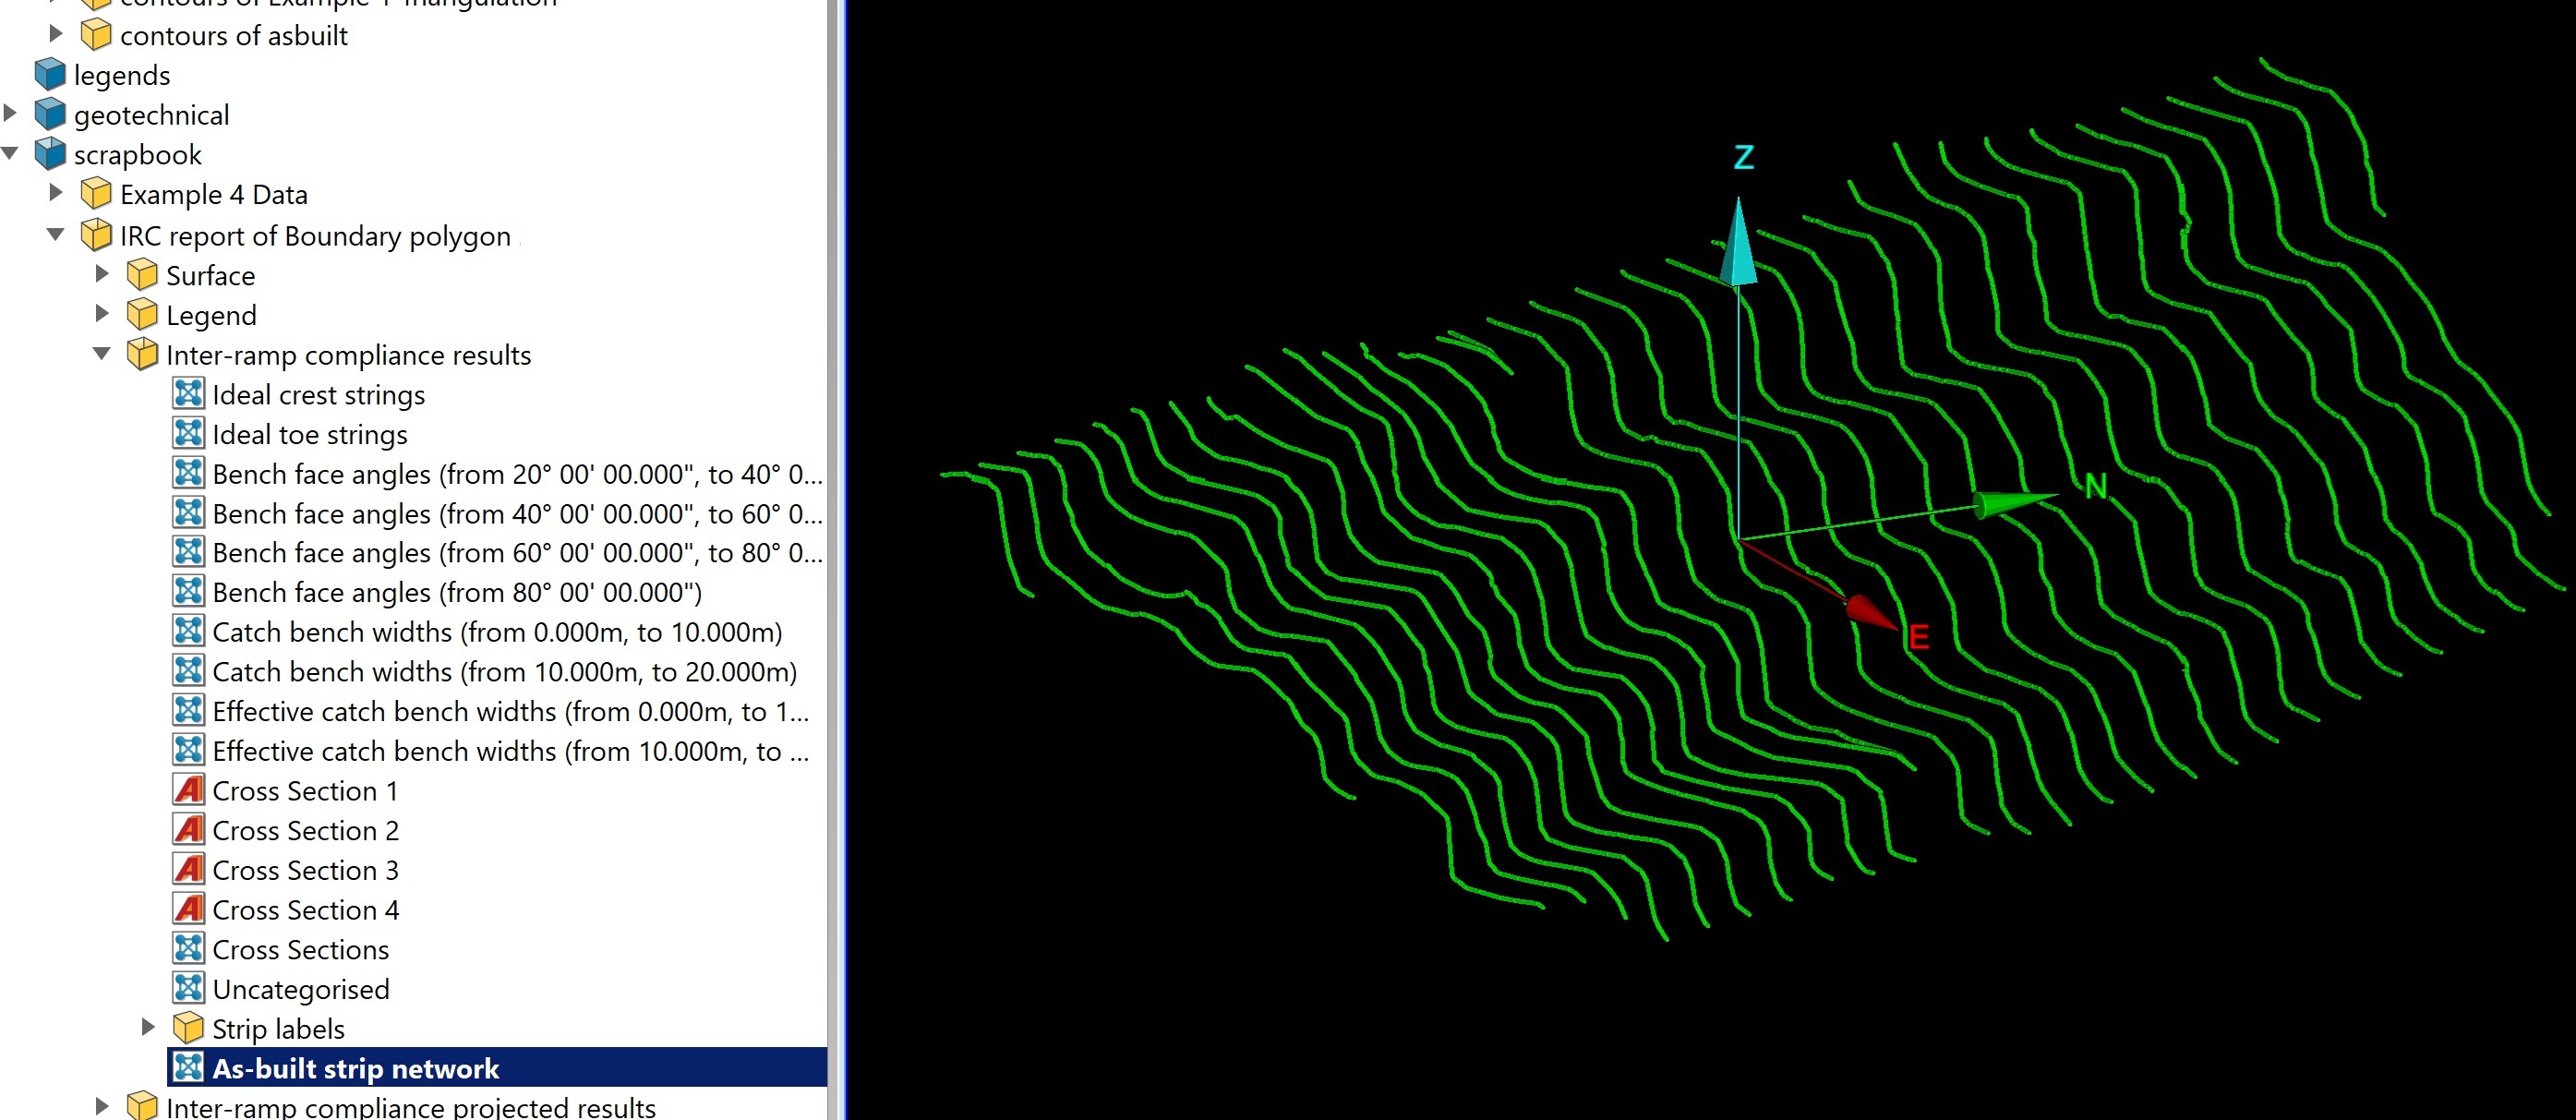
-
Ideal toe and crest lines for comparison with the drawn toe and crest lines, placed in the
/scrapbook/IRC report of <boundary polygon name>/Inter-ramp compliance resultscontainer.
From the CSV group, select the optional data to include in
.csvor.txtoutput files:-
Report bench position to save bench coordinates. Upper and lower bench points are the toe and crest lines that define where the bench starts and ends.
-
Report strip averages to calculate and save average data for each strip.
If you have provided design lines, Calculate design conformance will be available. Select this if you need design conformance to be reported.
From the Components to include group, select items required in the PDF report, and clear those not required:
-
Site ID to identify the site under analysis.
-
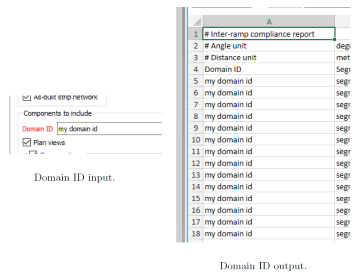
Domain ID to identify the analysis area.
-
Blast ID to identify the analysis blast zone.
Note: These IDs are defined by the user and included in the CSV output.
-
Slope azimuth direction to report strip azimuths in CSV files as either up or down the slope.
-
Plan views for coloured views from above the region of interest.
-
Summary table to present data on each strip.
-
Averages table to present statistics over all strips.
-
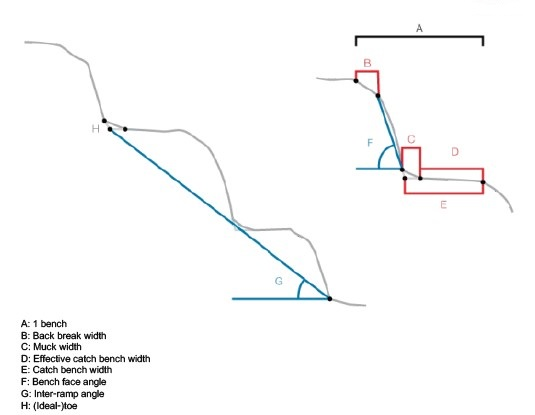
Dimension reference image to include the dimension reference drawing at the end of the report.
-
Combined strip sections to include a chart with all strip cross sections combined.
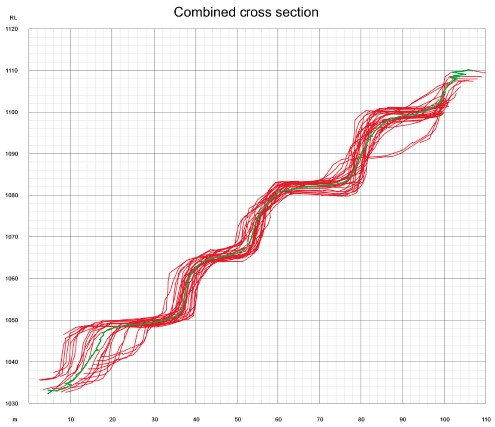
A corresponding edge network called Combined as‑built cross sections network will be placed in the
Inter-ramp compliance projected resultsoutput container. By default, it is displayed at the first point of the segments line. Set an alternative location using the Strip section location fields or selecting a point in the active view window. -
Cross sections to include cross sections in the output. Enter the cross section frequency in Cross section every
<number>strips. Cross section locations will appear on the strip network visualisation. -
Charts to include from Catch bench width chart, Effective catch bench width chart, and Bench face angle chart. Set their parameters as required.
-
Acceptability options to apply to the report histograms.
-
-
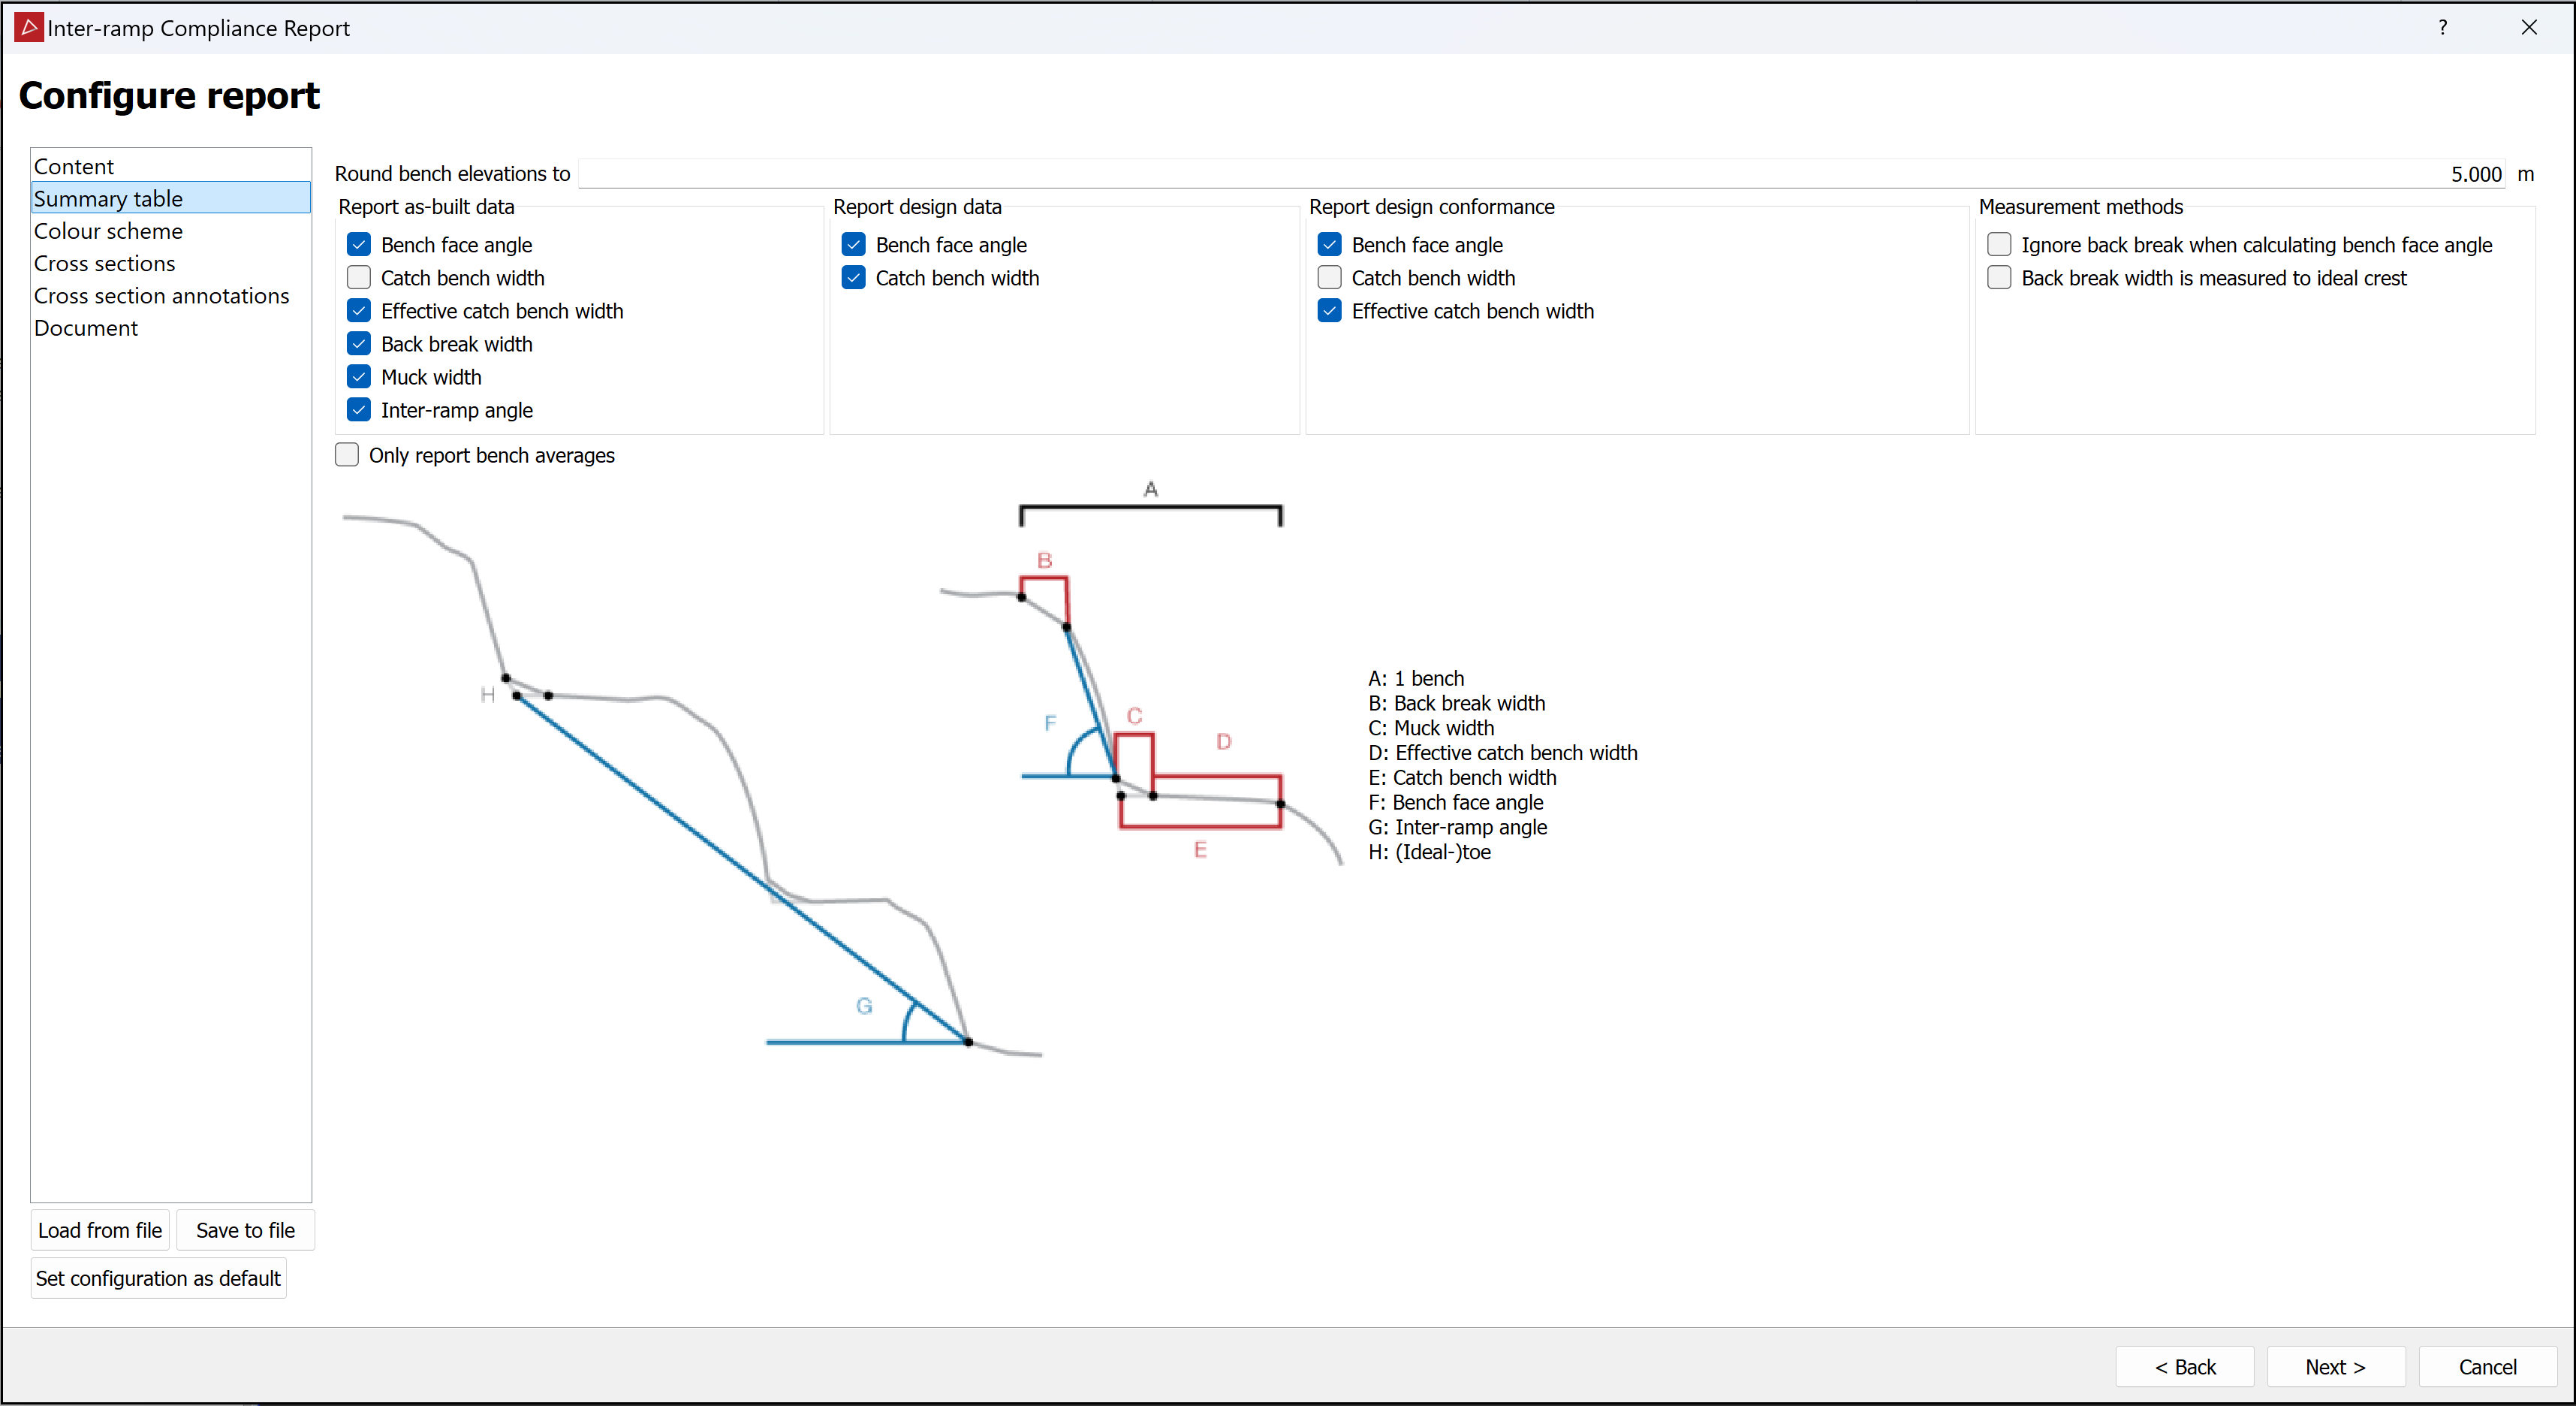
Summary table: Select the information to summarise.
-
Enter a value for Round bench elevations to specify the rounding increments used in the CSV output.
-
From the Report as-built data group, select the required items and clear the rest.
-
If you have provided design lines, the Report design data and Report design conformance groups will be available. Select the options to be reported.
-
Select required Measurement methods to specify how back breaks are handled.
-
Select Only report bench averages to reduce the size of the summary table by only including the average data for each strip.
-
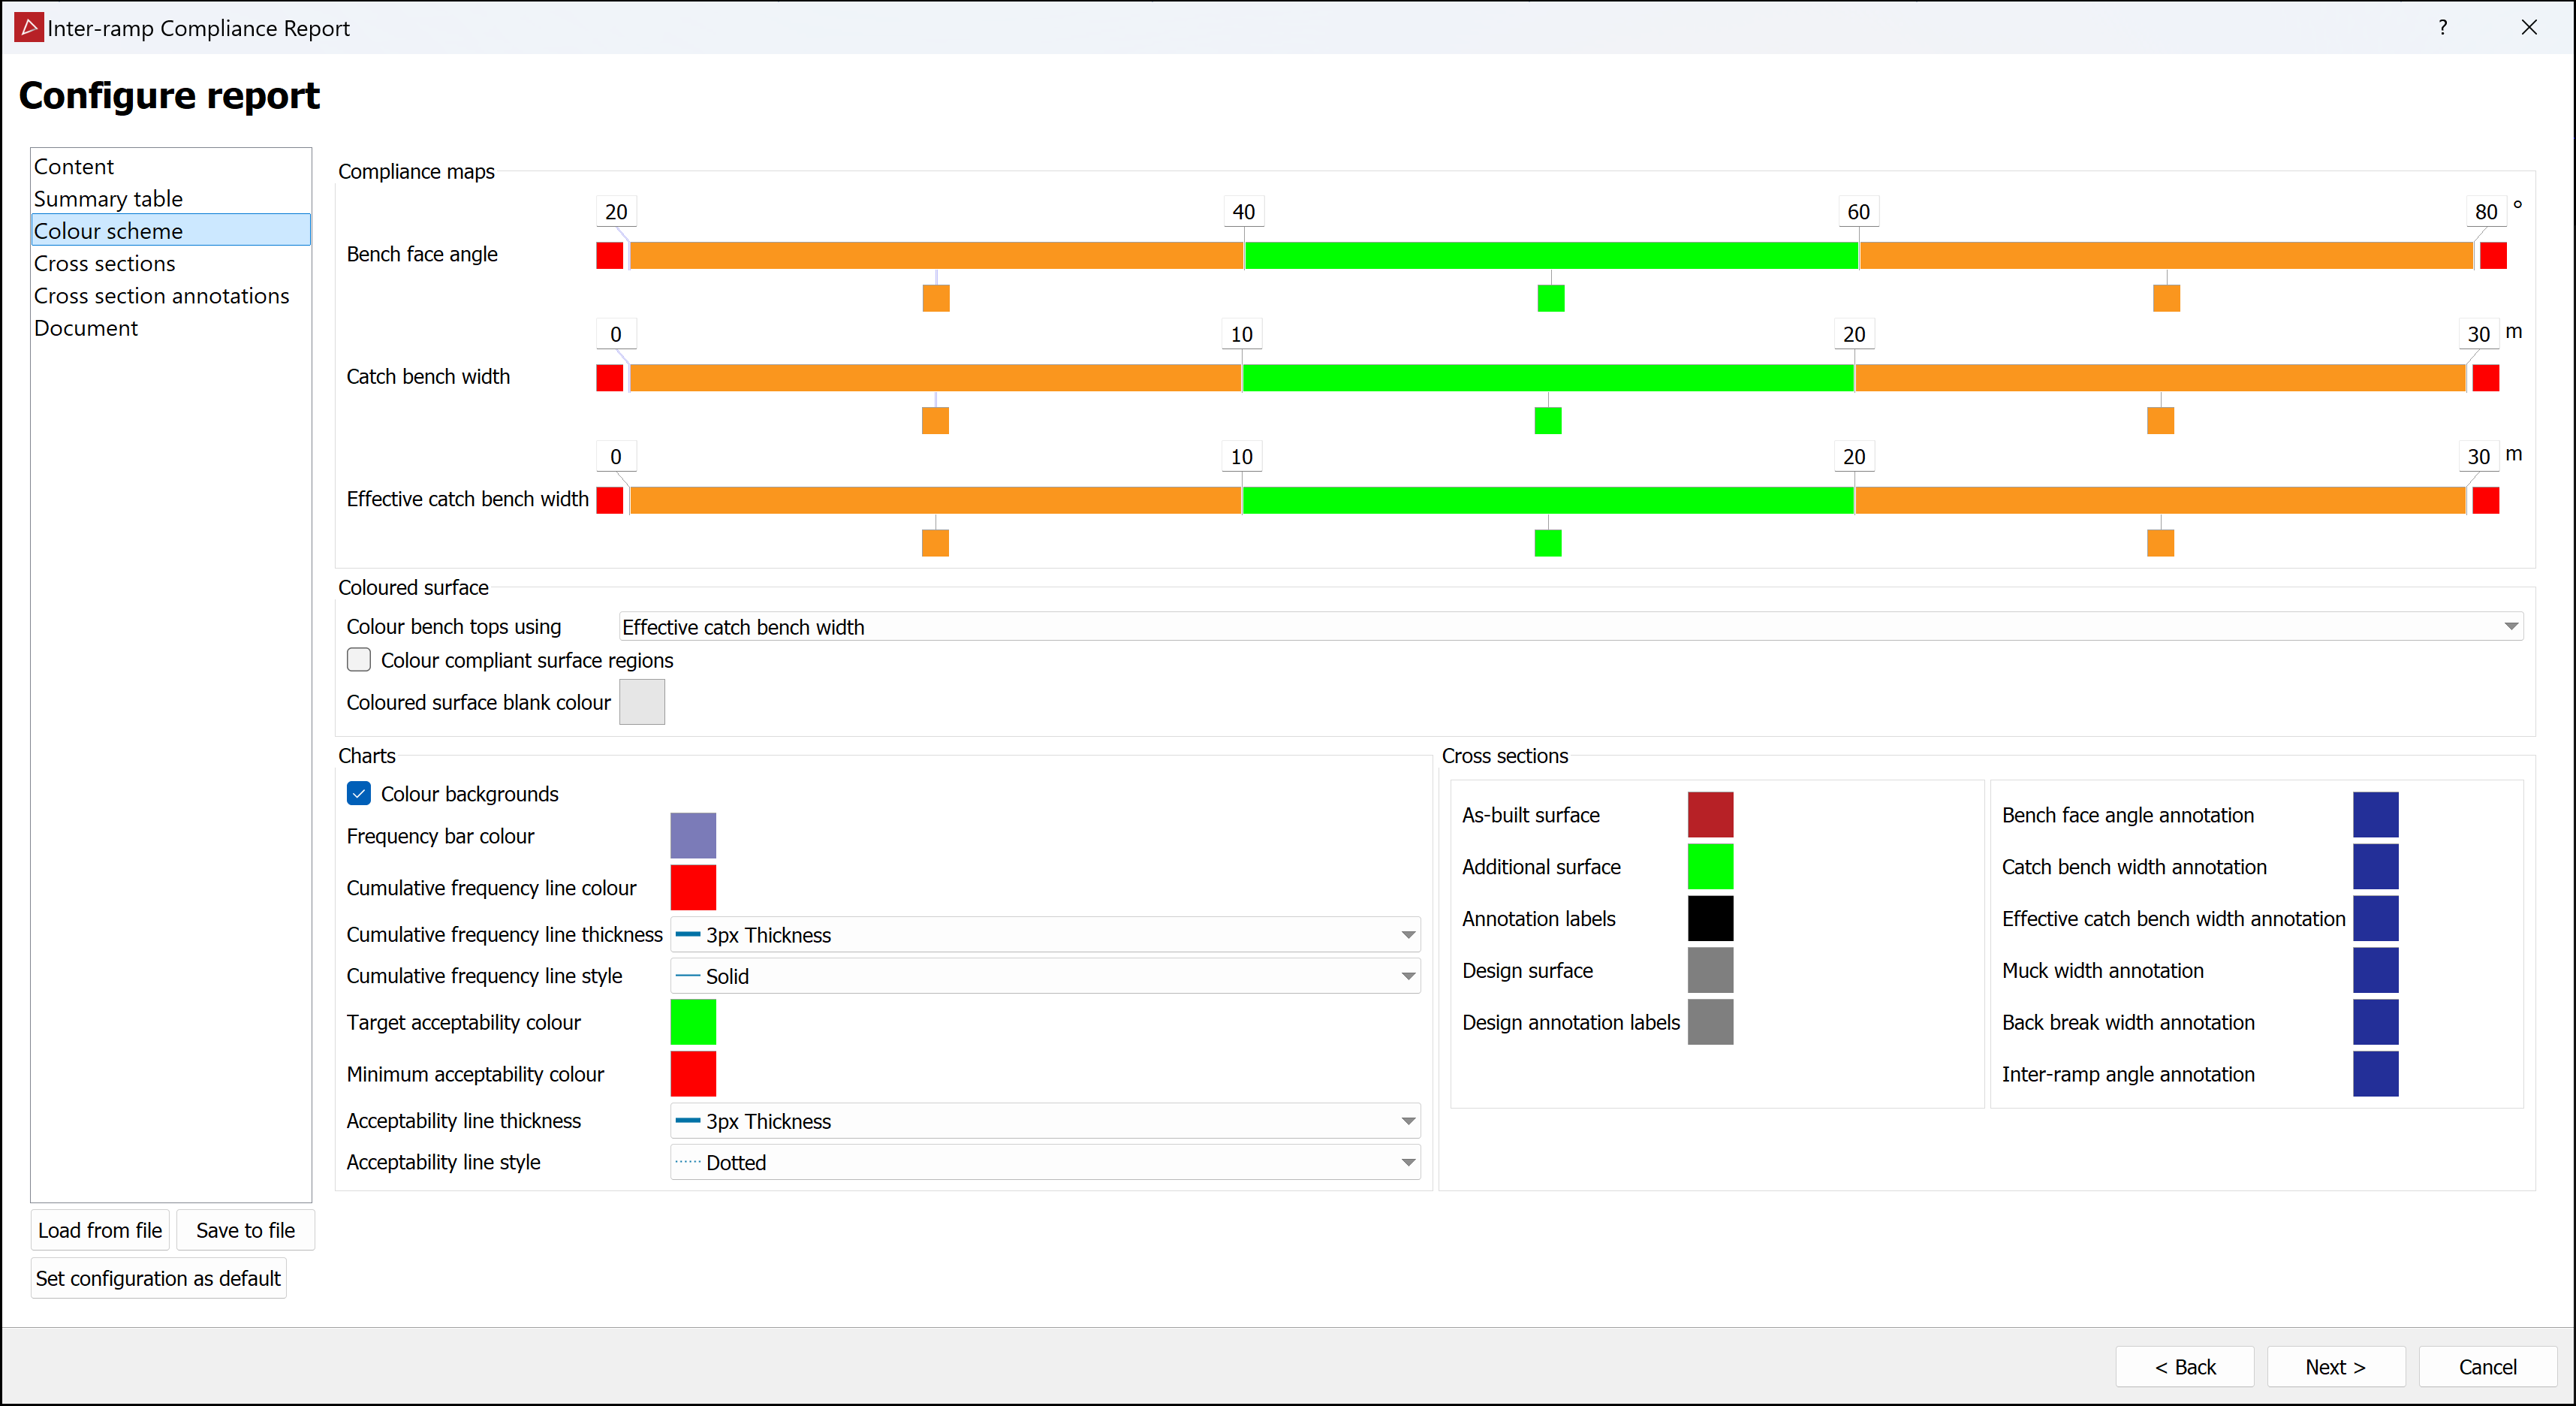
Colour scheme: Set up the colour schemes to be used for the output objects and report.
-
Configure the Compliance maps colours and tolerance thresholds. See Modifying a Colour Scale for detailed instructions.
-
Select the Coloured surface options to configure how the compliance report surface is coloured. If you do not select Colour compliant surface regions, compliant areas will be coloured the using the Coloured surface blank colour.
-
In the Charts group, select colours and line styles to configure the report histogram appearances.
-
In the Cross sections group, set up the colours to be used in the cross section charts.
-
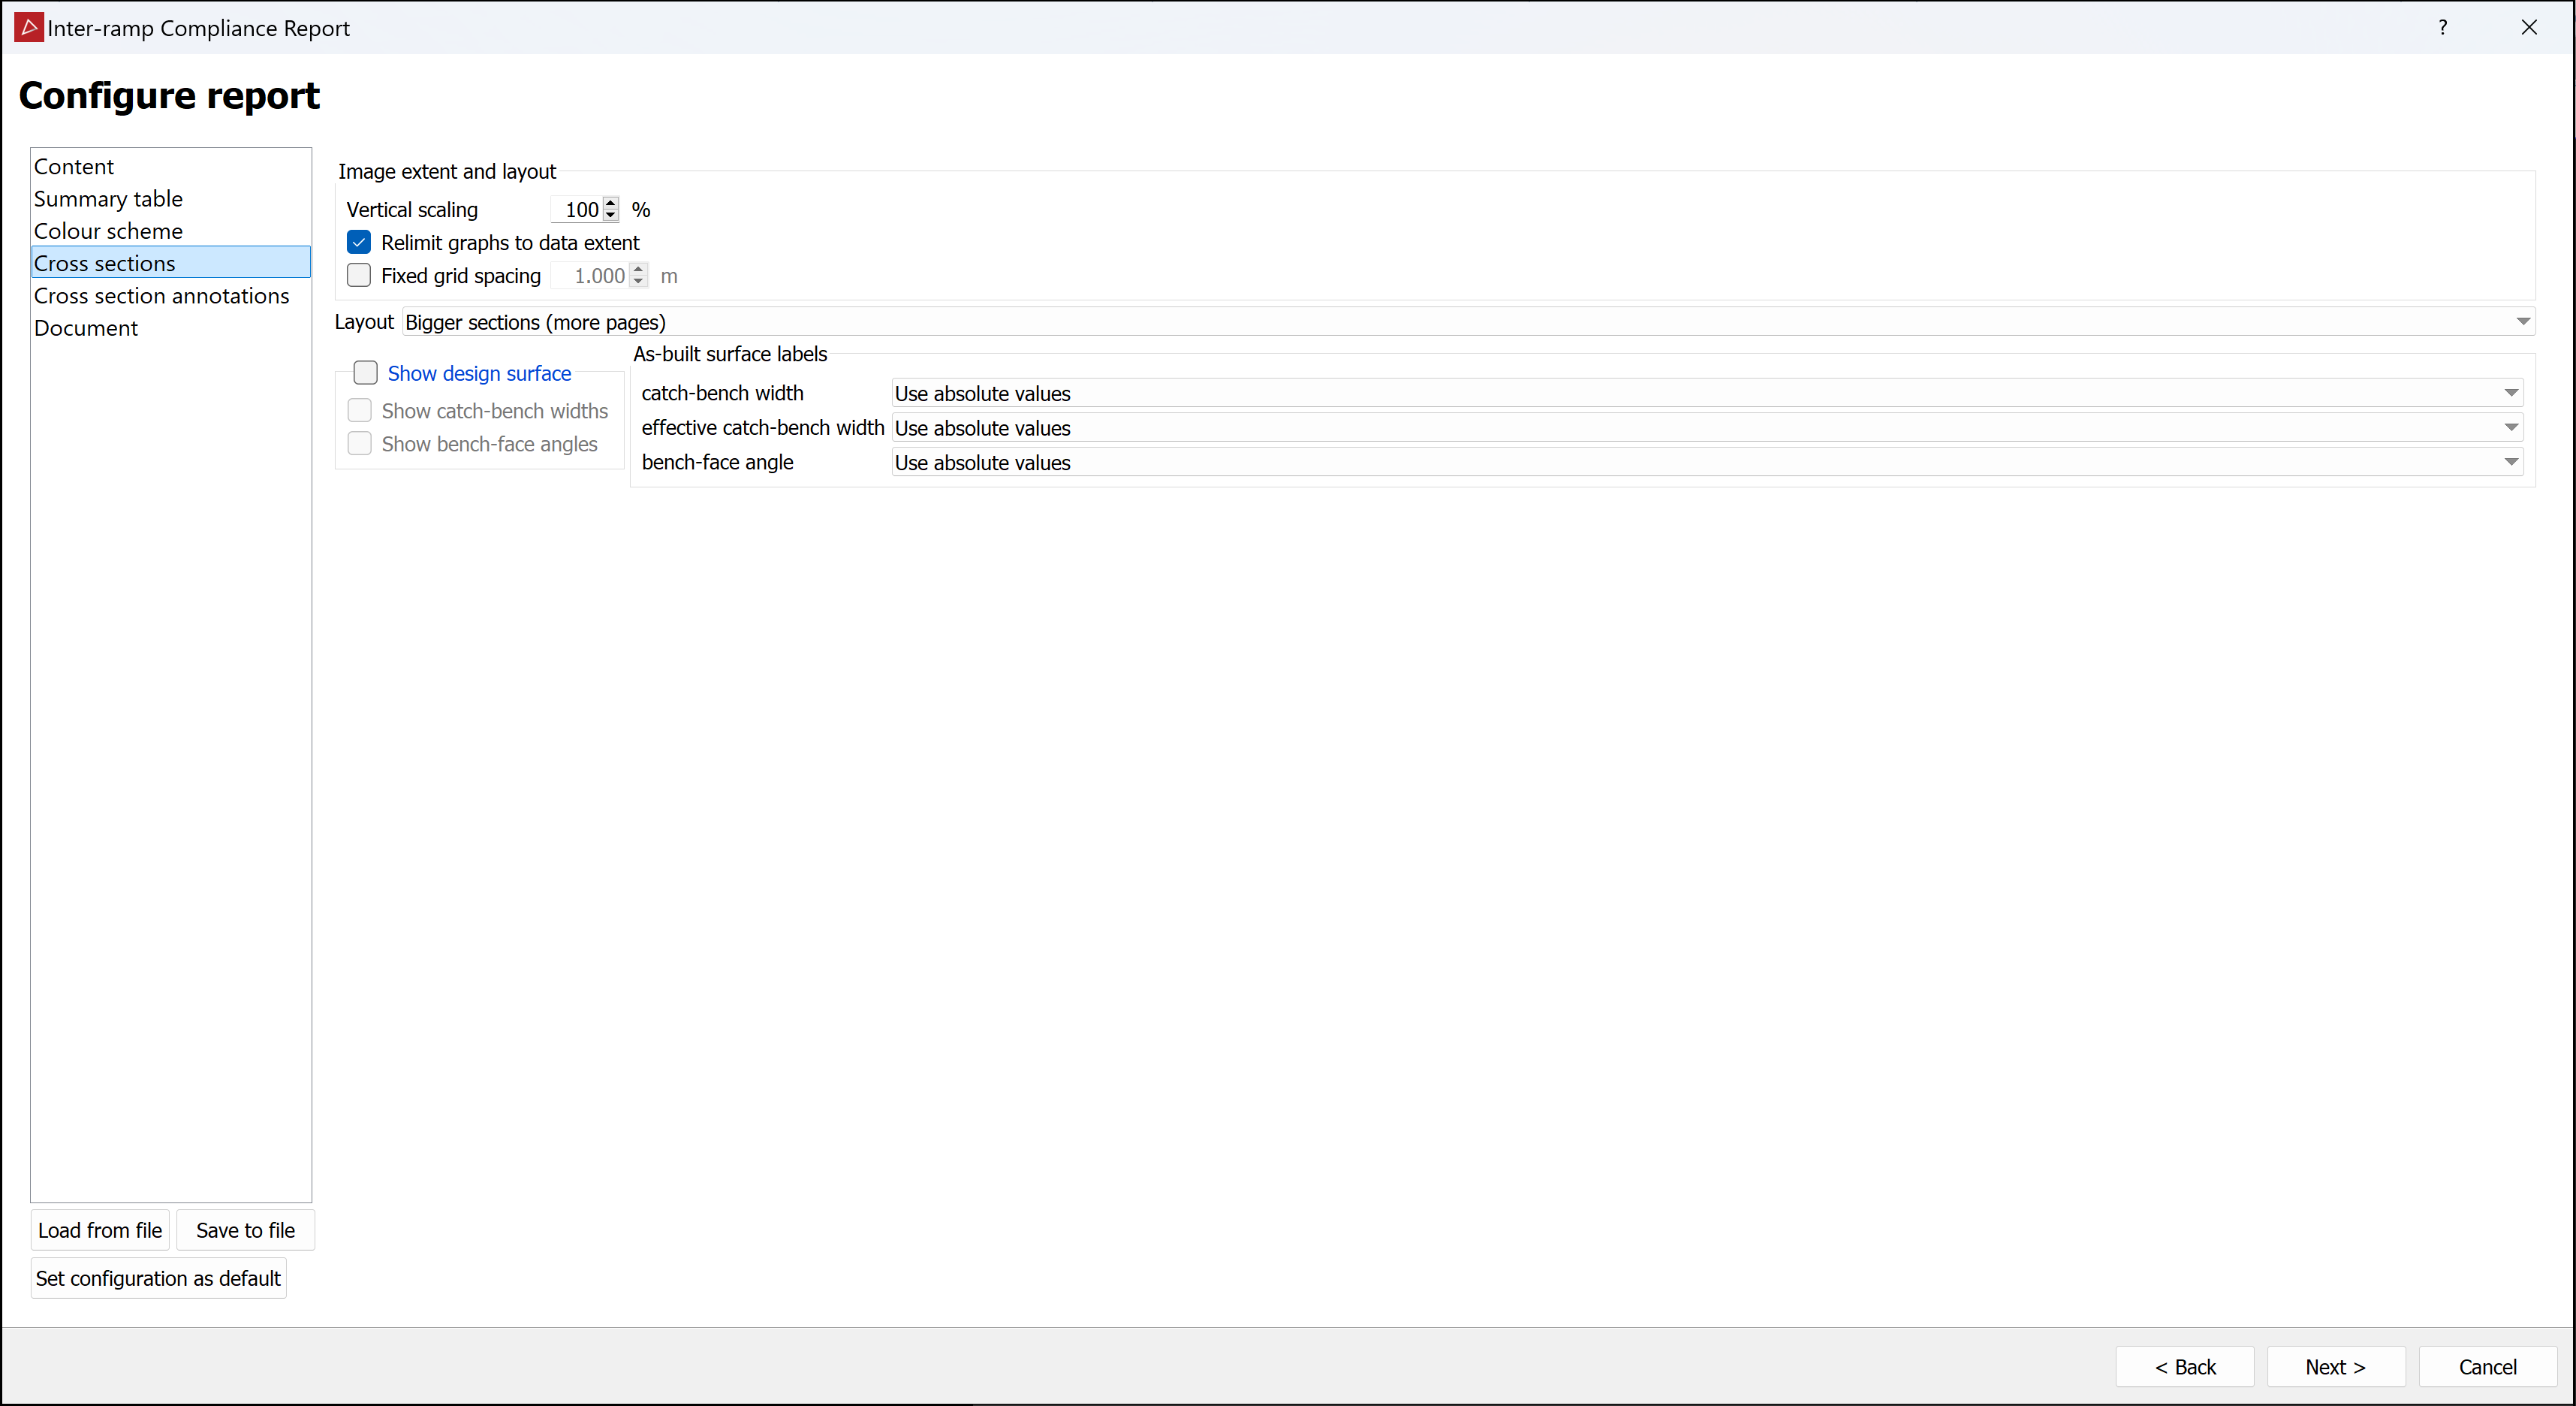
Cross sections: Set up cross section criteria, including vertical scaling and regular fixed grid spacing.
-
Set a suitable Vertical scaling for the cross section charts.
Tip: Start with 100%. If they are too tall in the draft report, return to this page and set a smaller value.
-
Select Relimit graphs to data extent to fit the cross section graphs to the data extents.
-
Select Fixed grid spacing and enter a value to specify cross section chart grid line spacing different from the default.
-
Select a suitable Layout. For bigger cross section images, choose Bigger sections. For a more compact report, choose Smaller sections.
-
If you have provided design lines, the Show design surface and As-built surface labels groups will be available. Select the required options for your report.
-
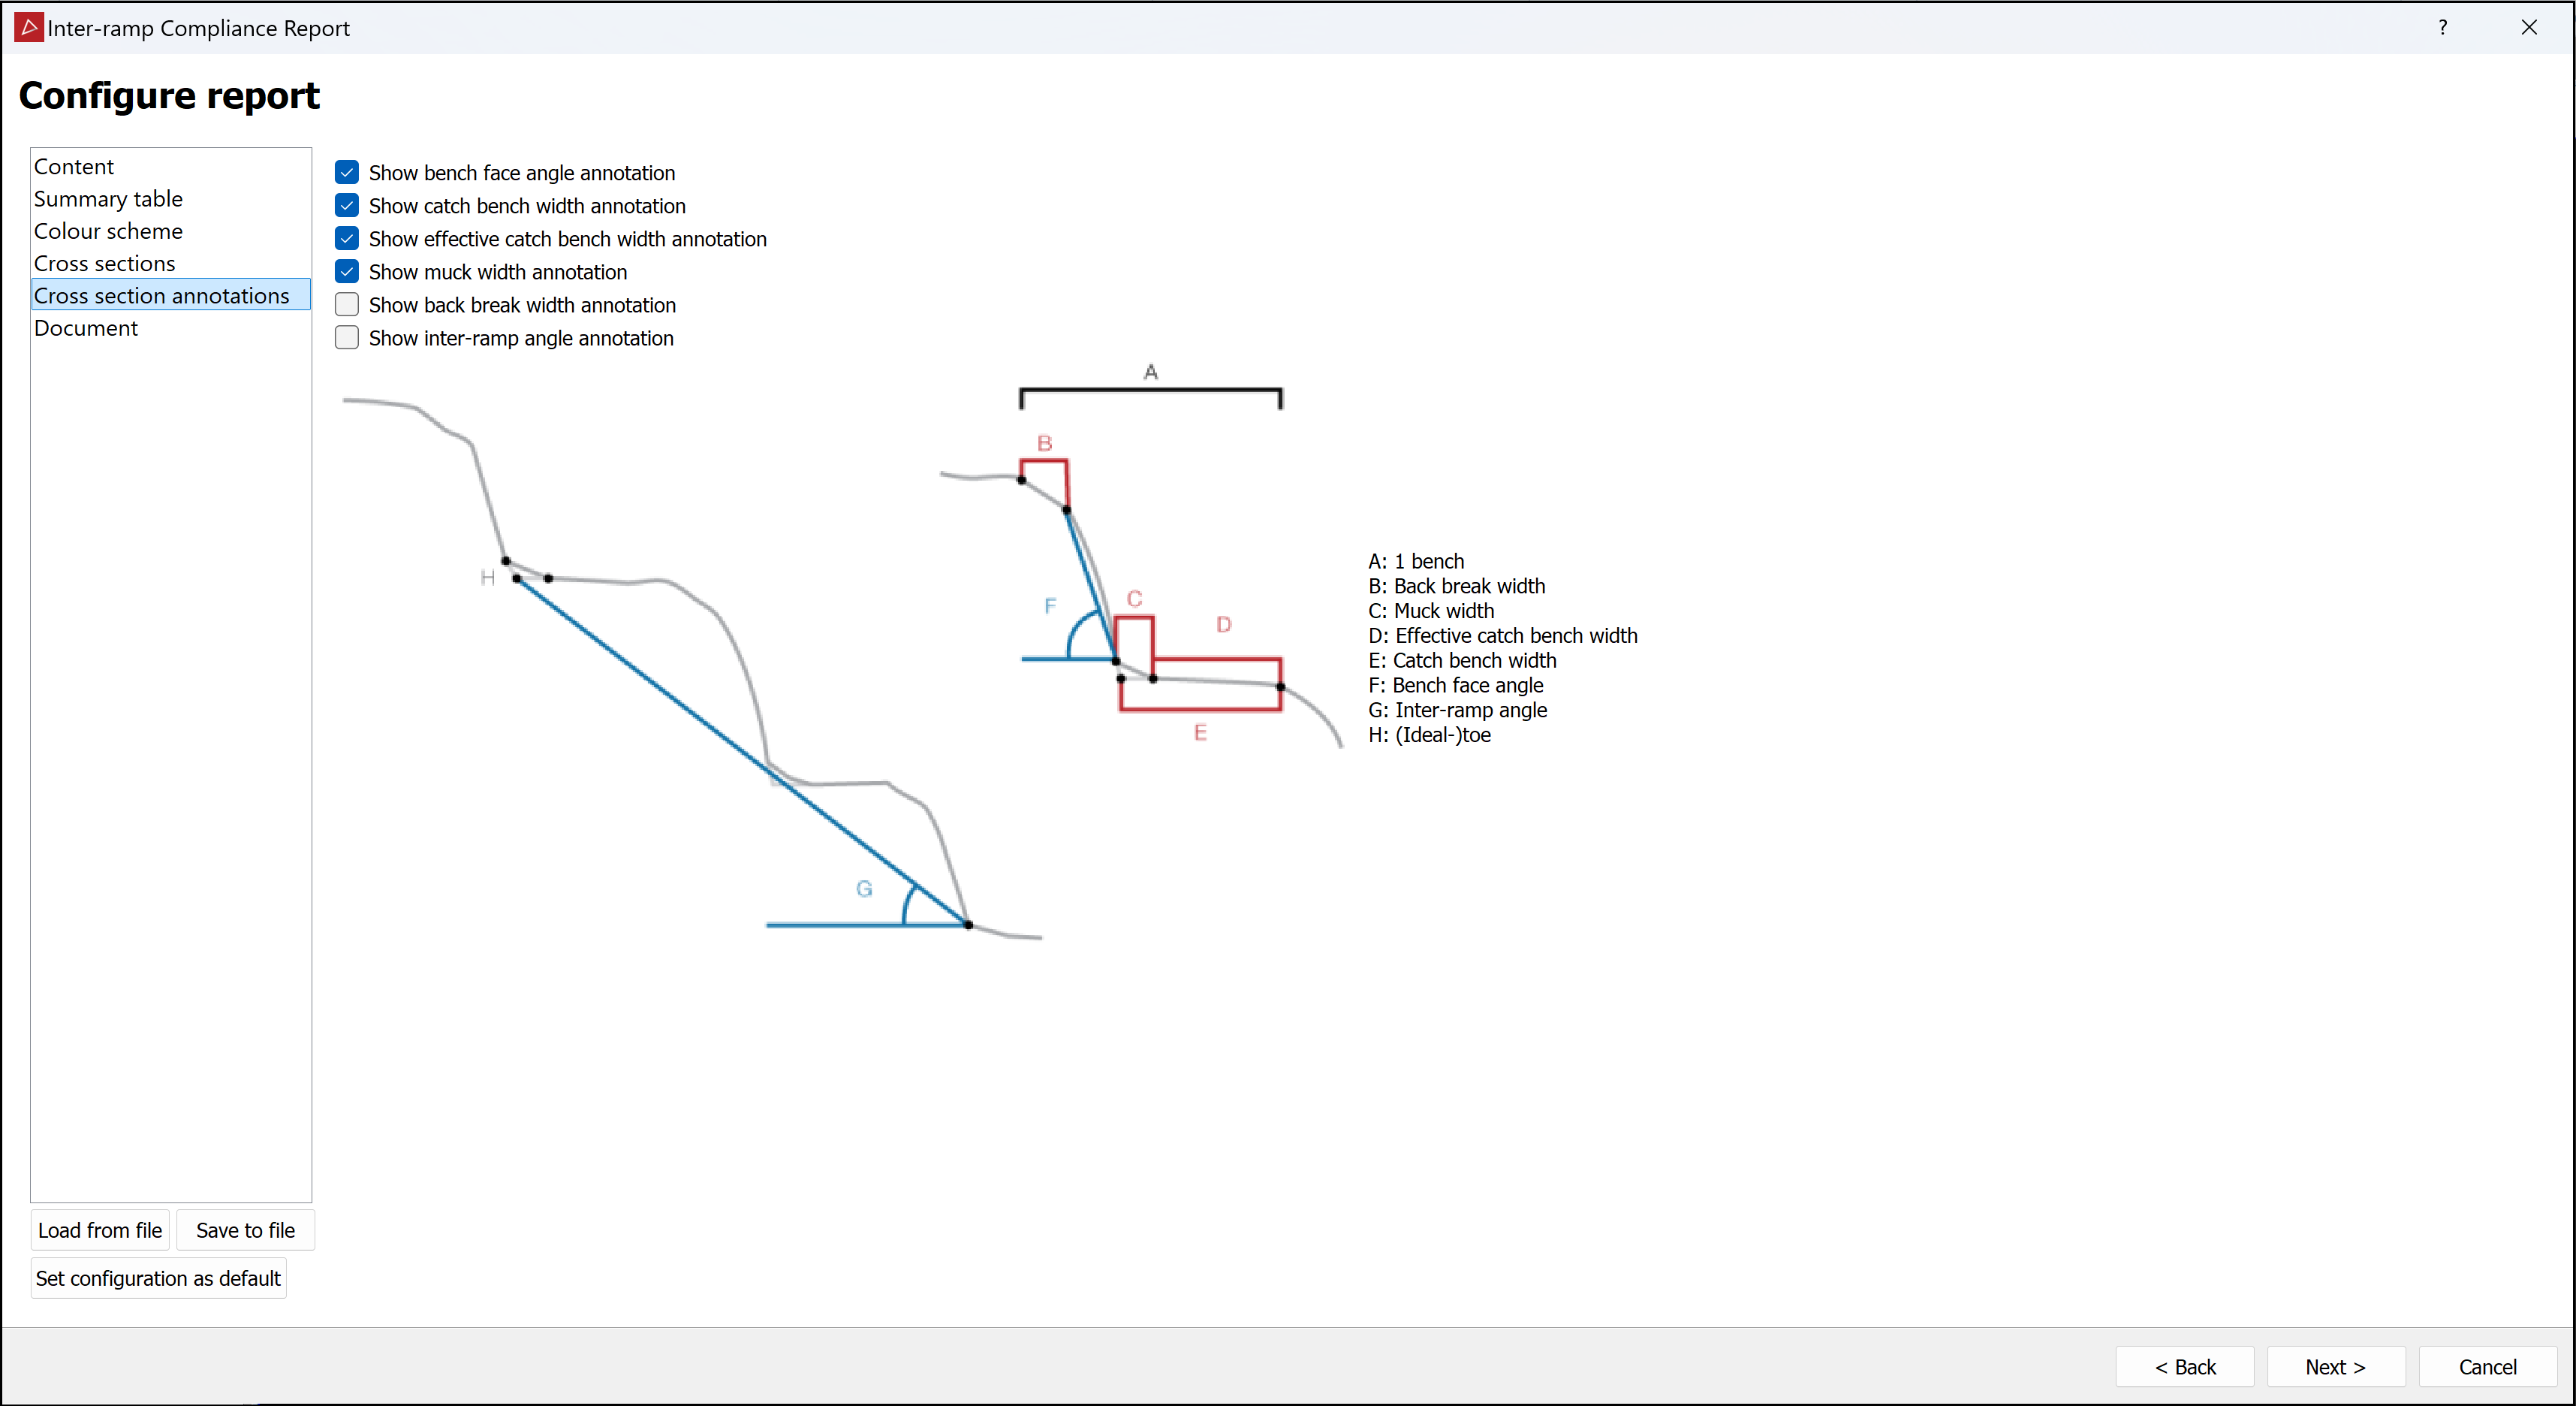
Cross section annotations: Select the cross section annotations required for the report and clear those not required.
-
Document: Enter metadata to include (report title and subtitle, author name, and logo) and a page layout. if necessary, change the date.
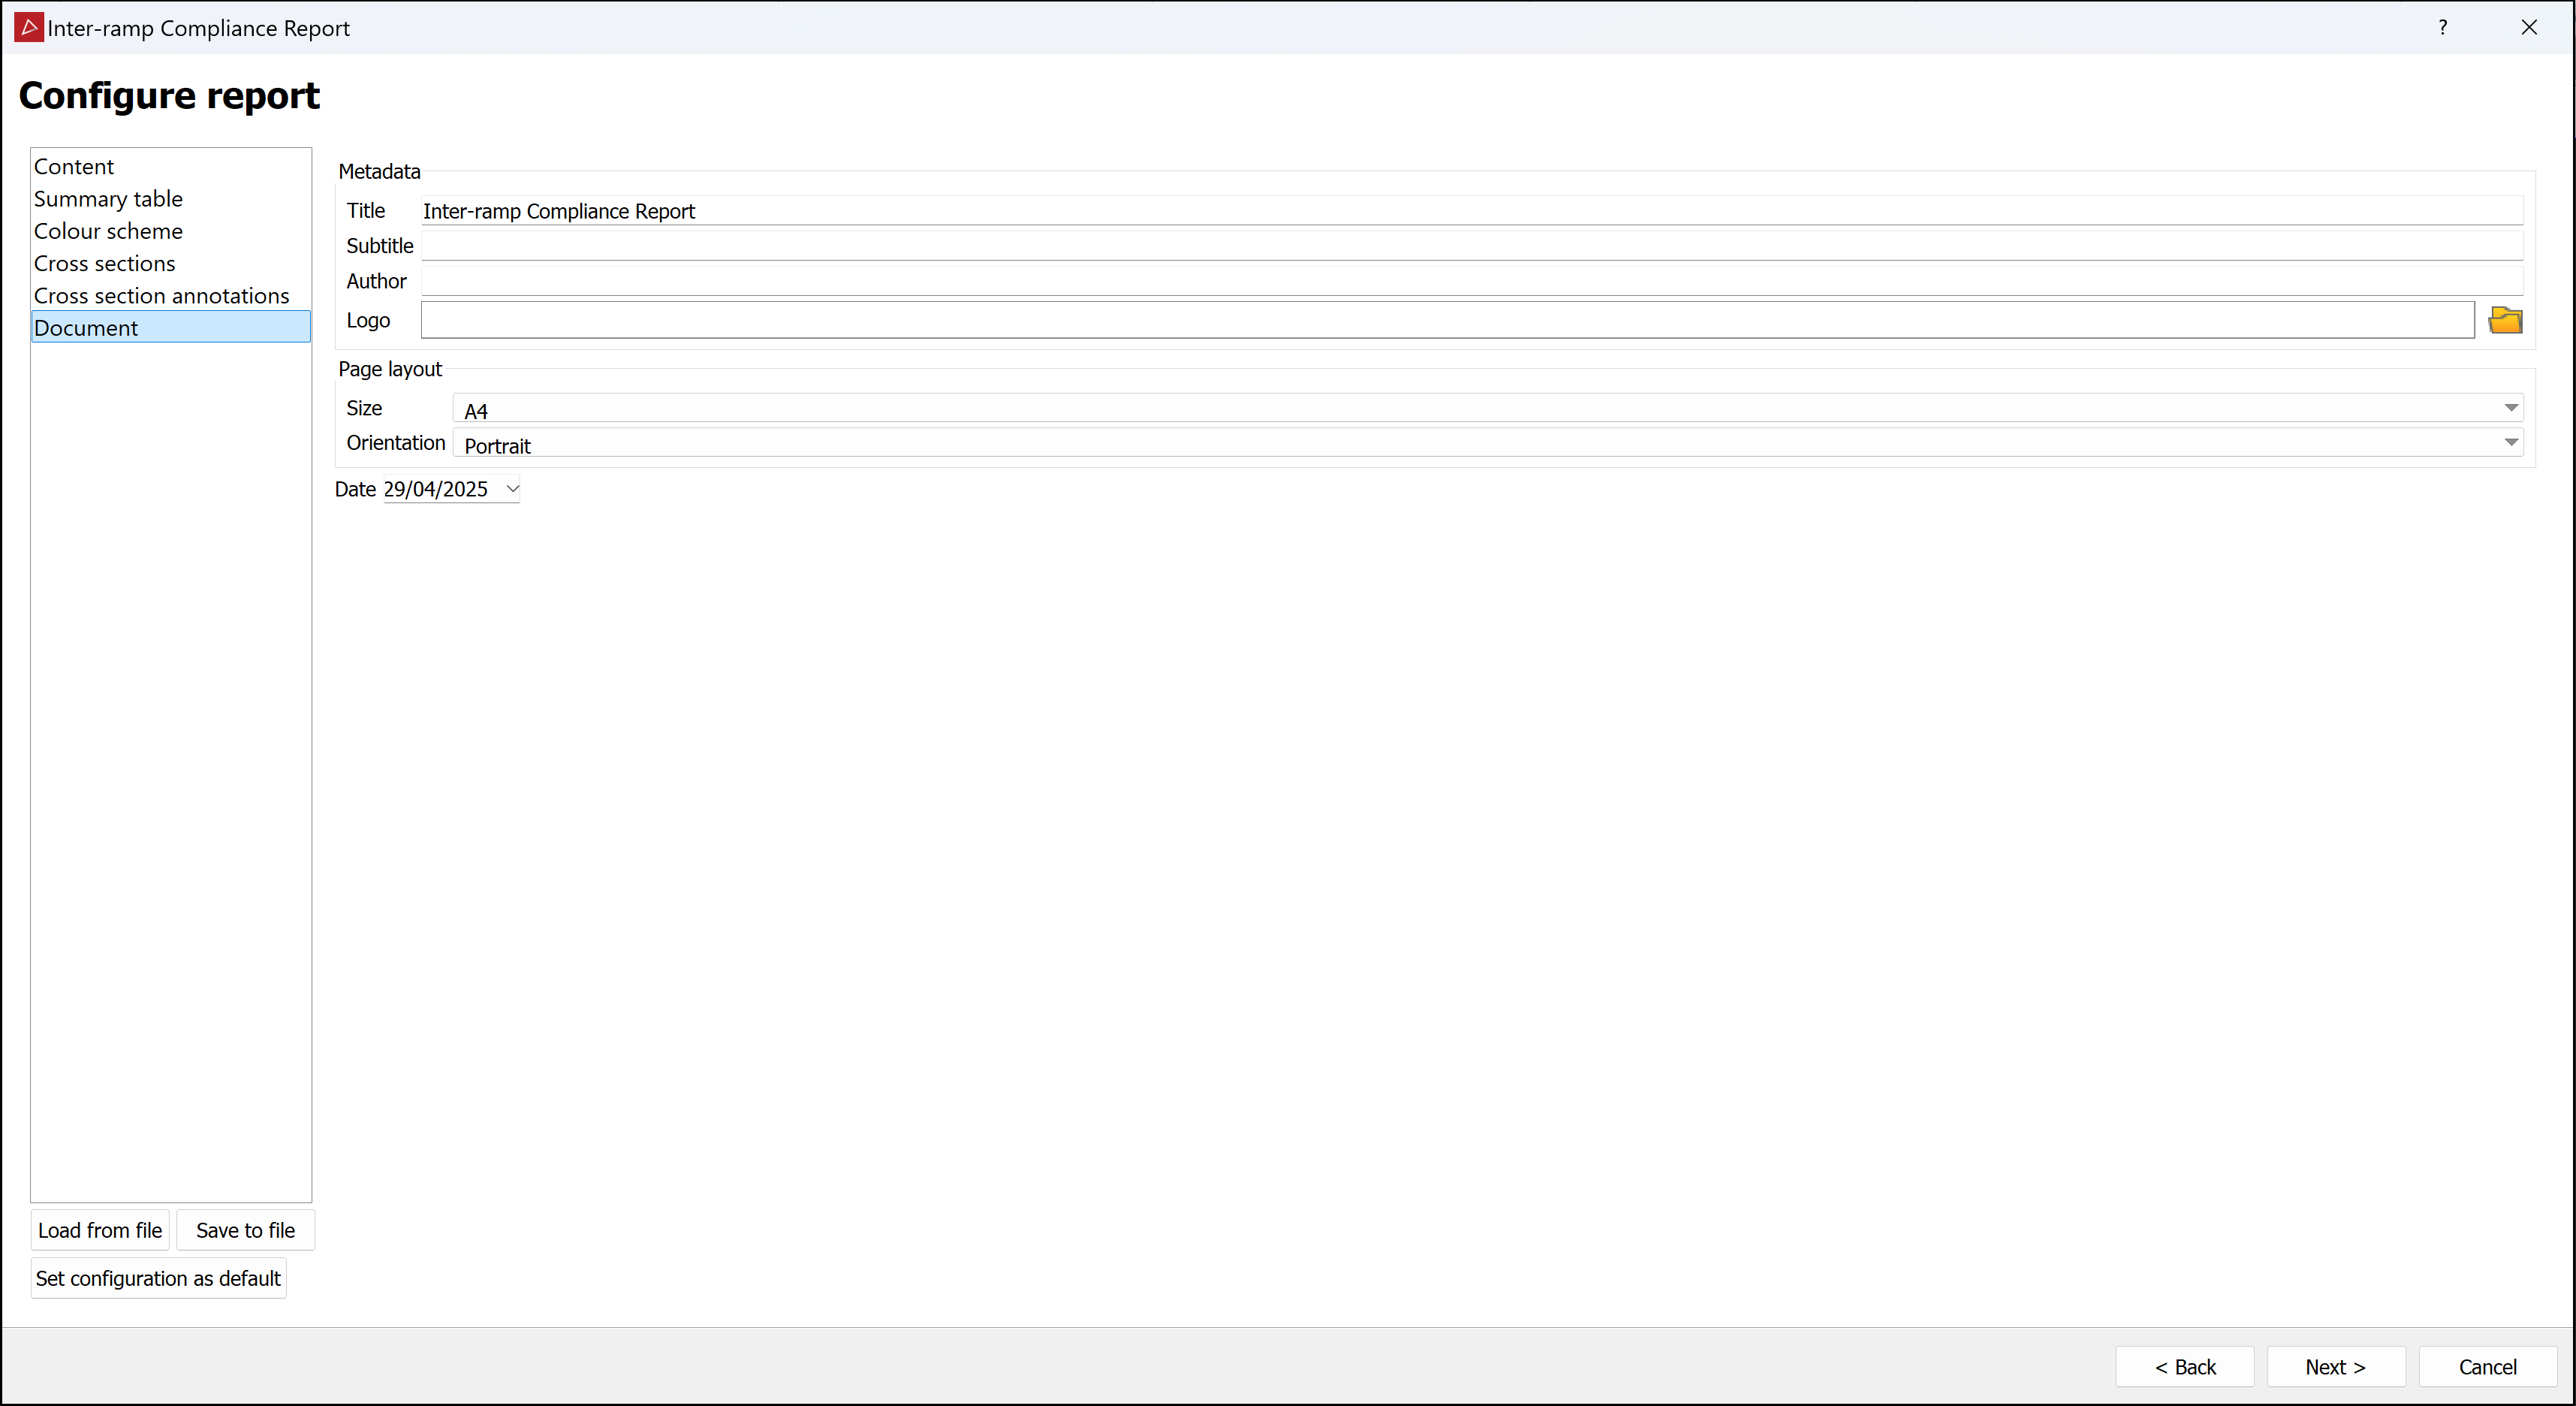
Expand for details.
Expand for details.
-
-
Click Next > to proceed to the Review report images page.
-
Review the report images.
-
Select the images in turn from the Image drop-down and inspect them.
-
Click Edit image to open the active image in the default Windows image editor. Make changes as required.
-
To exclude a cross section image from the report, clear Include this cross section in report.
-
Modify the appearance of a cross section with the Vertical scaling, Grid spacing, and Flip viewing direction options.
-
-
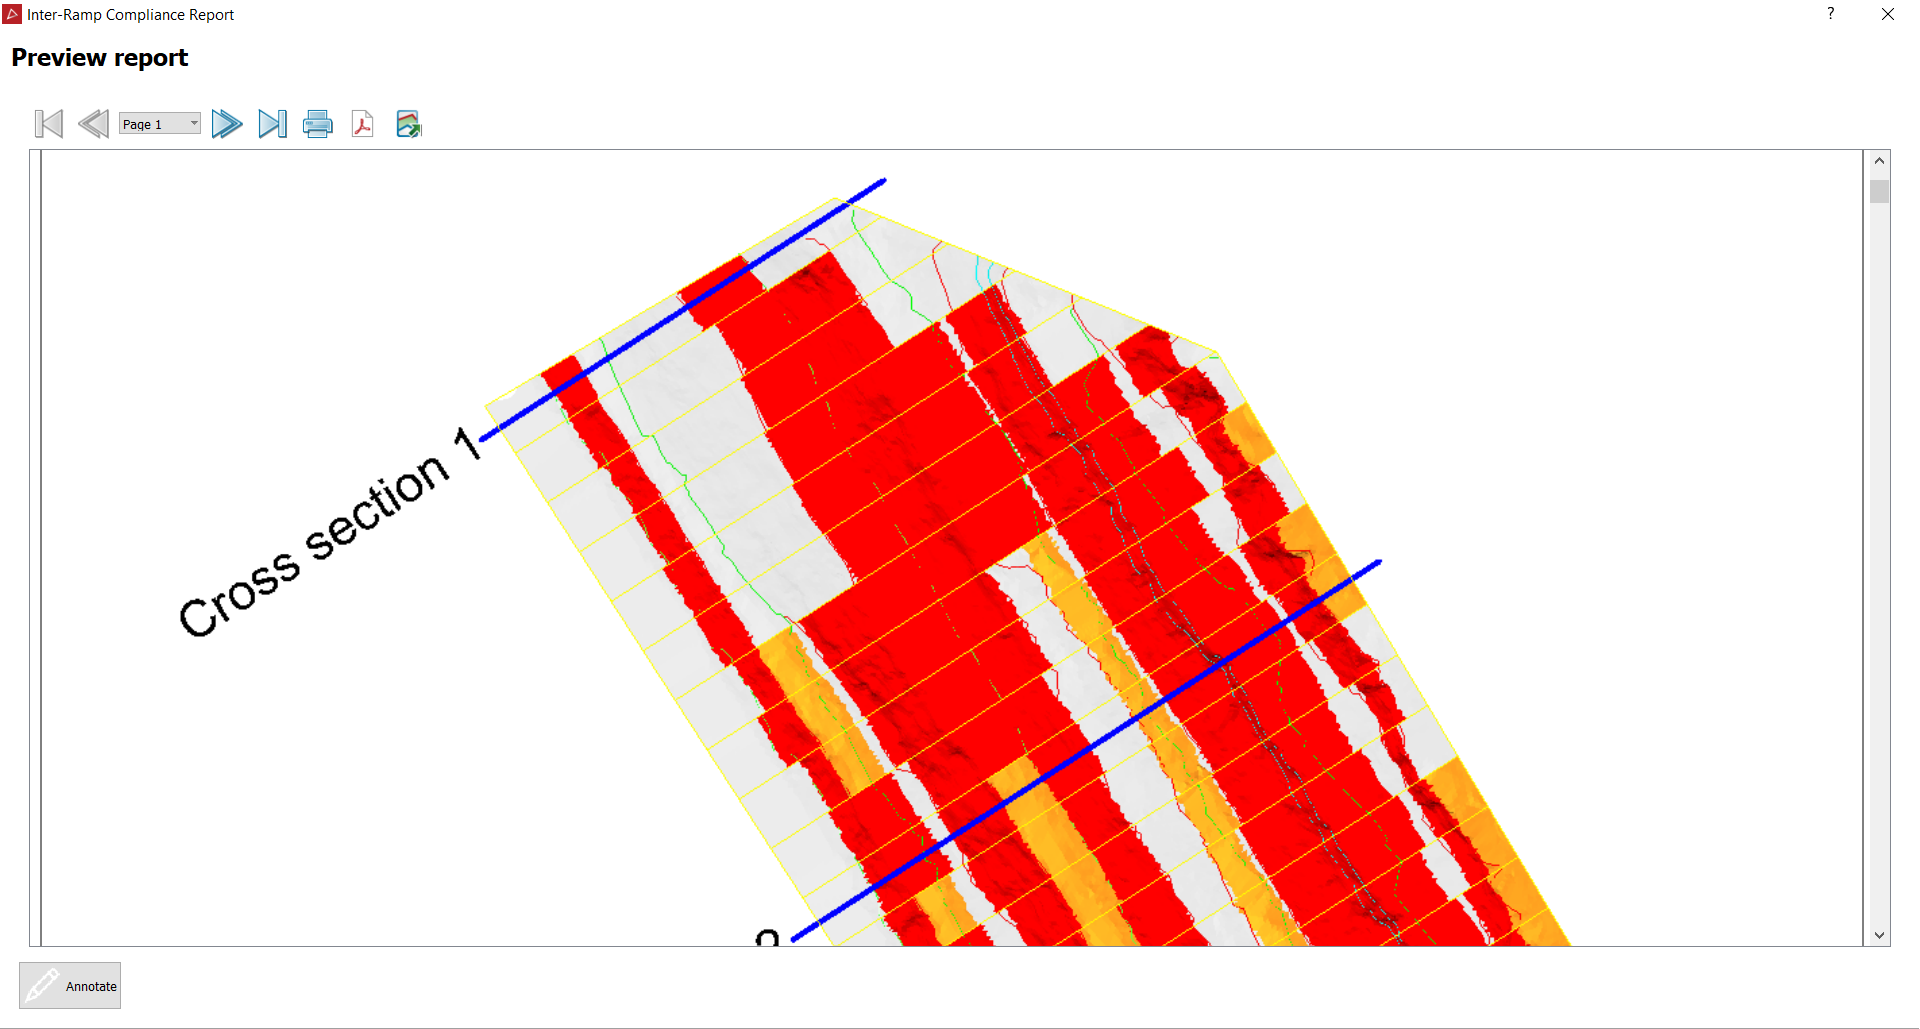
When the preview is satisfactory, click Next > to open the Preview report page. A draft report including all the selected content will be displayed, which you can evaluate.
-
Click < Back to make any further changes.
-
Click Annotate to add comments to each section of the report before publishing.
-
Click the
 button to print the report.
 -
Click the
 button to save the report as a PDF.
 -
Click the
 button to save the report as a CSV or text file.
-
