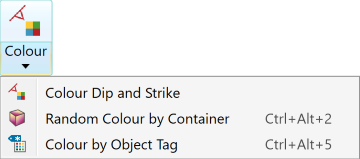
Colour
The Colour group tools on the Geotechnical tab enable you to colour discontinuities for easier analysis.

|
|
Colour facet networks based on the dip or strike values of the individual facets. |
|
|
Random Colour by Container (Ctrl+Alt+2) Automatically apply random colours to selected objects, according to the containers in which they are stored. |
|
|
Colour by Object Tag (Ctrl+Alt+5) Colours discontinuity objects based on values of particular tags. |
Colour by Dip and Strike
The Colour by Dip and Strike tool colours discontinuities ![]() and facet networks
and facet networks ![]() based on the dip or strike values
of the individual facets. This helps to highlight discontinuities and
planar areas, making it easier to see fractures.
based on the dip or strike values
of the individual facets. This helps to highlight discontinuities and
planar areas, making it easier to see fractures.
This tool is a preliminary way of marking exposed discontinuities. You can use the resulting information for further analysis with the geotechnical tools.
Note: For accurate colouring of dip and strike, use only spherical, scan, or fusion surfaces. Topographic surfaces are not suitable for geotechnical analysis as they are
created in a top-down manner that does not provide sufficient detail on
rock slopes.
-
Select the object to be coloured.
Note: While Colour by Dip and Strike will work with a wide range of object types, it is only useful with surfaces

 .
. -
On the Geotechnical tab, in the Colour group, click
 Colour Dip and Strike from the Colour drop-down.
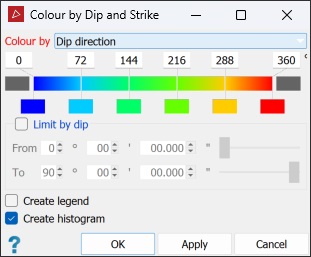
-
From the Colour by drop-down, select one of Dip, Strike or Dip direction as the basis for colouring.
-
(Optional) Adjust the colour scale as required. See Modifying a Colour Scale for detailed instructions.
-
(Optional) Select Limit by dip or Limit by bearing to restrict colouring to a particular set. This highlights the fractures that are part of the same set.
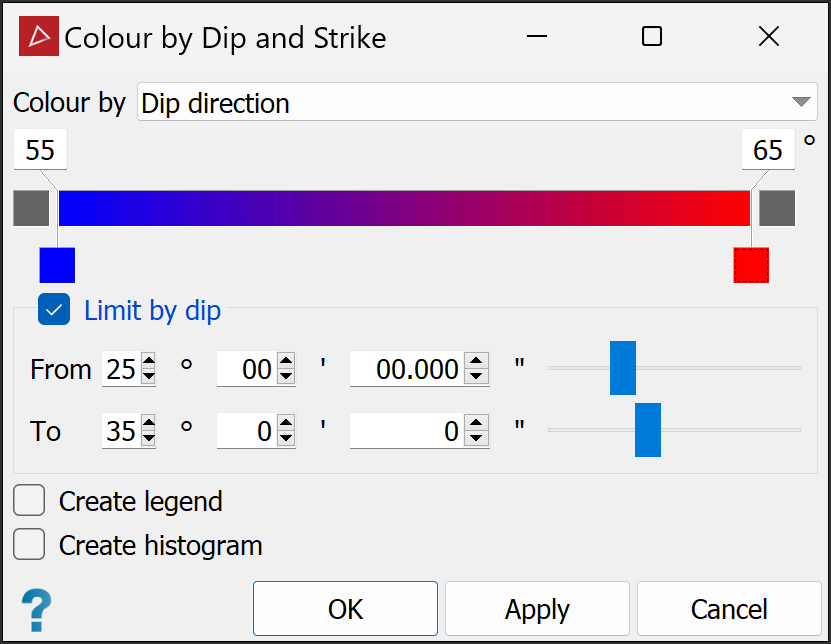
ExampleTo find areas that may have structures with an average dip direction of 60° and a dip of 30°, configure the Colour by Dip and Strike tool as shown.
-
(Optional) Select Create legend to make a legend indicating the colour scale. Double-click on the legend in the project explorer to view it.
-
(Optional) Select Create histogram to make a graph displaying the distribution of data in front of and behind the surface.
The chart will be placed in a secondary container
 called
 colour by distance from objects legend. Double-click on the container to view the chart. -
Click OK or Apply.
|
|
|
|
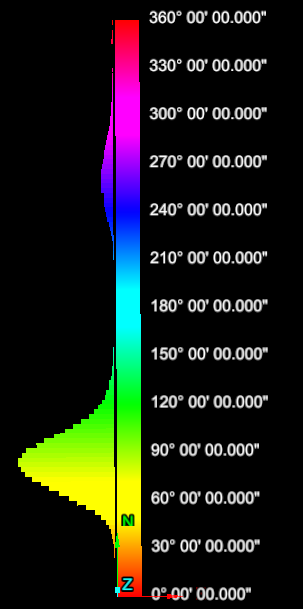
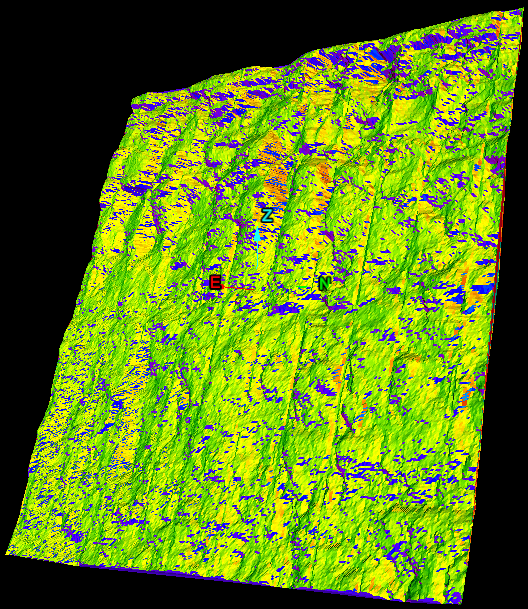
The histogram (left) shows the distribution of dip and strike values. |
The above image displays the dips and strikes coloured according to their angle trends, corresponding to the histogram. |
Random Colour by Container
The Random Colour by Container tool (Ctrl+Alt+2) automatically applies random colours to selected objects, according to the containers in which they are stored.
Select the objects to colour then click ![]() Random Colour by Container from the Colour drop-down. PointStudio automatically applies colours.
Random Colour by Container from the Colour drop-down. PointStudio automatically applies colours.
Note: Random Colour by Container also resides on the Home ribbon, in the Colour Scheme drop-down.
Colour by Object Tag
The Colour by Object Tag tool (Ctrl+Alt+5) colours discontinuity objects based on values of particular tags.
Proceed as follows:
-
Select
 Colour by Object Tag from the Colour drop-down.
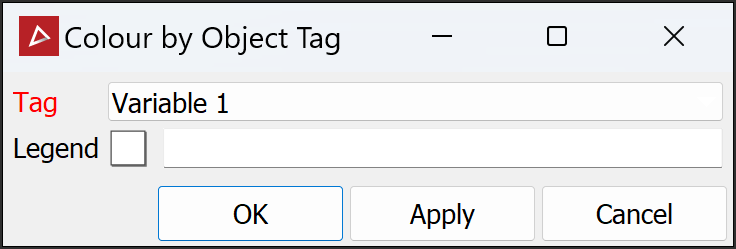
-
Drag a legend with the colour scheme to be used into the Legend field.
-
Select the objects to be coloured.
-
Select the appropriate tag from the Tag drop-down.
-
Click OK or Apply.
