Specify Direction Grid
Selecting this option lets you choose more than one search orientation, producing more than one variogram.
Click the  button to open the Variogram Directions window.
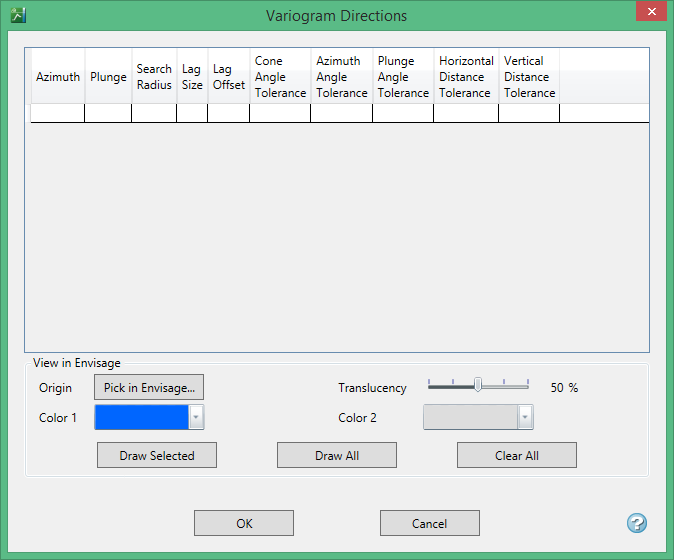
The Variogram Directions window has two parts: Variogram parameters and View in Vulcan.
Variogram parameters
The table at the top is where the variogram parameters are entered. Entering information into the cells and then pressing ENTER generates another row. Highlighting one or more rows and pressing DELETE will delete the row(s). If you do not wish to view the cones in Vulcan, click OK to accept and close the window.
Search Radius
The search radius should correspond to your data spacing. When doing down hole variograms the search radius will not exceed the depth of the drillhole.
Lag Size
Set a lag size that coincides with your data spacing. If you have to err, do so on the side of too small.
Lag Offset
Lag offset indicates how far from the collar the search is to begin. A lag of 0 indicates that the search will start at the collar. A lag of 10 indicates that the search will start 10 units down hole from the collar, (units being whatever system of measurement you are using. If US, then feet. If International, then metres.)
Azimuth
Enter the azimuth. This parameter controls the azimuth direction in which variography is evaluated.
Plunge
Enter the plunge. This parameter controls the plunge direction in which variography is evaluated.
Cone tolerance
Enter the limit on the angle between two samples and the centre line (range axis) of a variogram cone. See the graphical representation in Figure 1. Any two samples whose angle is larger than this value are ignored. To disable this limit, set it to 90 degrees.
Azimuth tolerance
Enter the limit on the angle between two samples as measured in the plane of the plunge of the variogram.
Plunge tolerance
Enter the limit on the angle between two samples as measured in a vertical plane in the direction of the azimuth.
Note: A combination of cone, azimuth and plunge tolerances is used if the azimuth angle tolerance and plunge angle tolerance are set to less than the cone angle tolerance.
|
|
|
Figure 1: Cones of tolerance |
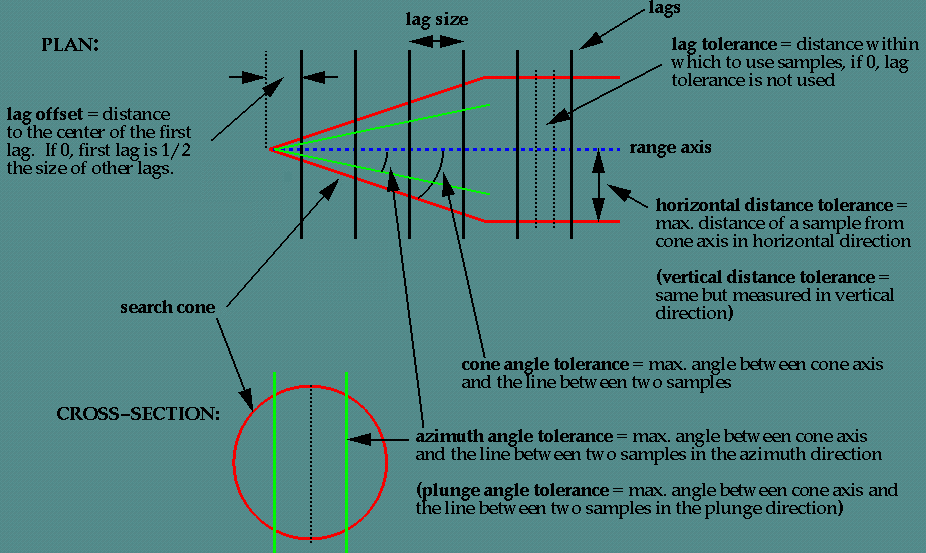
Horizontal tolerance
Enter the horizontal distance limit on sample pairs. Any acceptable sample must be within this horizontal distance of the centre of the variogram cone.
Tip: Set this value to a typical spacing (or larger) between your data, for example, if your data is on a 100 × 100 × 10 grid, set a horizontal distance of 100 and a vertical tolerance of 10. If you receive too few sample pairs, try increasing the tolerances to capture more data otherwise artifacts such as "hole effects" may occur.
Vertical tolerance
Enter the vertical distance limit on sample pairs. Any acceptable sample must be within this vertical distance from the centre of the variogram cone. The vertical distance is measured from the plane of the plunge of the variogram cone.
Using too large a "cone" can result in excessive mixing of samples from different directions. This can cause the apparent anisotropy to appear smaller than the true anisotropy. Using too small a cone can result in rough variograms that are hard to interpret. The sample cone may be too small if the number of sample pairs for most lags is small compared to the number of sample points.
For an omnidirectional variogram, use 90 for the azimuth tolerance and 90 for the cone angle tolerance.
Note: At a great enough distance, the horizontal distance tolerance and vertical distance tolerance will clip the sides of the search cone.
View in Vulcan
You can view any of the cones that have been defined in the parameters table by highlighting the row, then clicking the Pick in Vulcan button. In Vulcan, click where you want the search origin to begin, then click the Draw Selected button. It does not matter which button you click first. You can click the two buttons in the opposite order and the results will be the same.
To draw all the cones in Vulcan, click the Pick in Vulcan button to select where you want the search origin to begin, then click the Draw All button.
The cones are displayed using two colours. They can be adjusted by using the two colour charts. Translucency can be adjusted by using the slider control.
To delete the cone(s) from the screen, click the Clear All button.
Note: Vulcan stores the last origin location selected. Therefore, when loading additional cones it is not necessary to click the Pick in Vulcan button again unless a different location is desired. Simply click Draw Selected or Draw All to display the cone.
