Correlation Matrix
Use this option to see the correlation between multiple variables. It allows for Pearson and Spearman correlation, and also allows for covariance analysis.
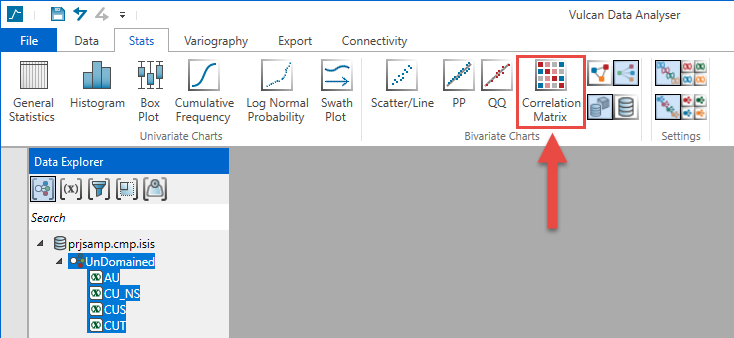
Instructions
Select the variables you want to analyse, then click Correlation Matrix on the Stats tab. A chart will be created and displayed in the Chart Window.
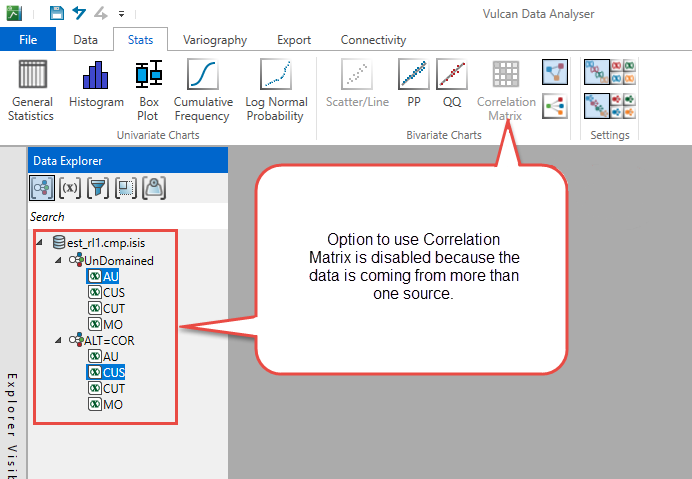
To create this chart you will need to select numeric variables. The variables must have:
- Same data source
- Same domain
- Same filter
- Same weight
The results can be viewed in two ways:
-
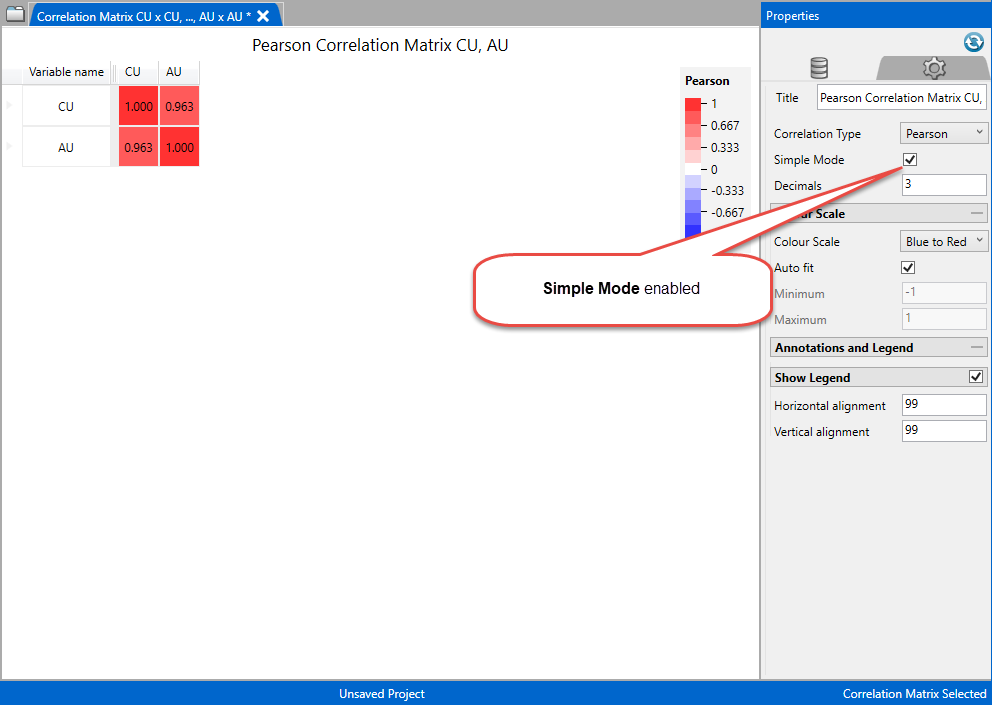
As a symmetric matrix that has the value for the correlation/covariance for the variables indicated to the left and top of each cell.
Customise the Matrix Grid
Title - Modifying the chart title will affect the specific correlation type title but not the others.
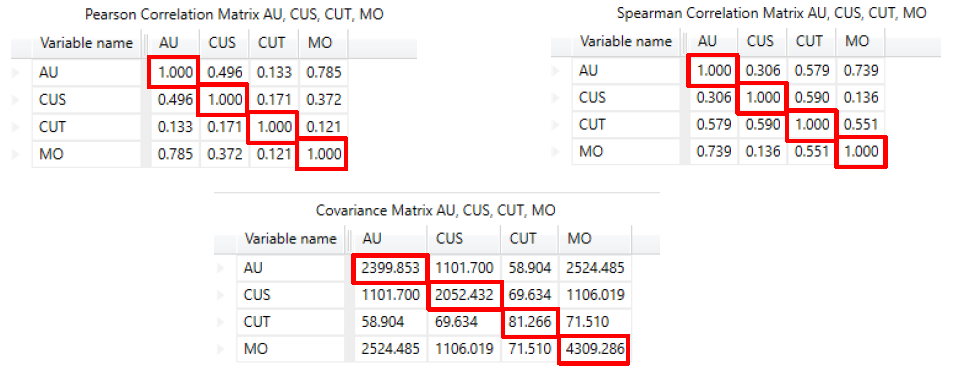
Correlation Type - The correlation types are the following:
- Pearson
- Spearman
- Covariance
Pearson and Spearman values for a variable with itself correlation is 1.
Covariance values for the same variable with itself will be the variance of the variable.
Simple Mode - Enable this to view data as correlation matrix.
Decimals - You can modify the number of decimals and the Correlation Type of the chart.
Colour scale - Select the colour scheme that will be used to display the chart.
- Blue to Red
- Divergent Colour Blind
- Absolute Greyscale
- Absolute Rainbow
Auto fit - Use this to allow VDA to automatically adjust the colour scale to fit the data. You can also choose to create your own scale by entering the parameters into the minimum and maximum values.
Minimum/Maximum - Set the minimum and maximum extents of the scale.
Show Legend - Use the mouse to drag the legend to the desired position, or enter the grid coordinates for the horizontal and vertical alignment position.
-
As a chart showing histograms and scatterplots.
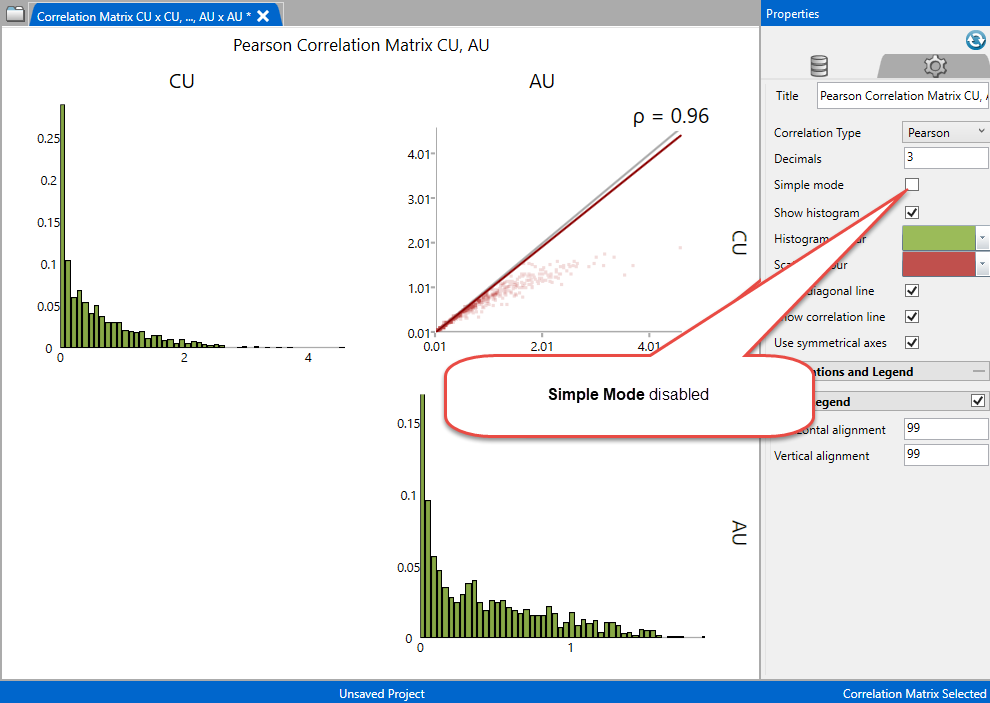
Customising the Charts
Title - Modifying the chart title will affect the specific correlation type title but not the others.
Decimals - You can modify the number of decimals and the Correlation Type of the chart.
Correlation Type - The correlation types are the following:
-
Pearson
-
Spearman
-
Covariance
Simple Mode - Disable this to view charts.
Chart Colours - Select the desired colours for the histogram and the scatterplot by clicking on the colour palette.
Show Legend - Use the mouse to drag the legend to the desired position, or enter the grid coordinates for the horizontal and vertical alignment postilion.
-
