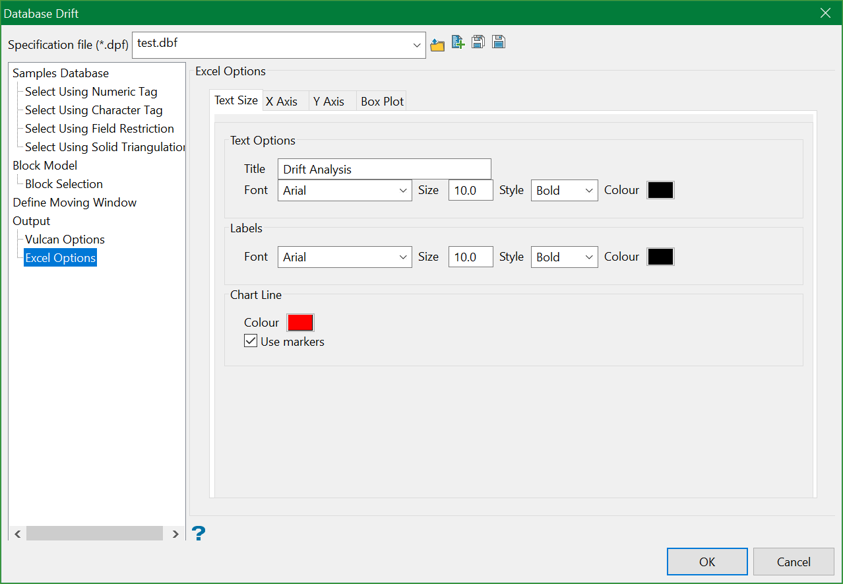
Database Drift Analyser - Excel Options
This panel is separated into the following tabbed sections:
- Text Size
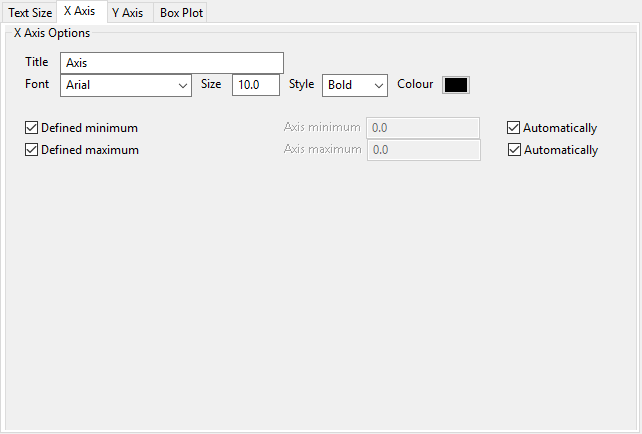
- X-axis
- Y-axis
- Box plot
Text Size tab
X-axis tab
Y-axis tab
The options displayed under this tab are similar to the ones displayed through the X-axis tab.
Box plot tab
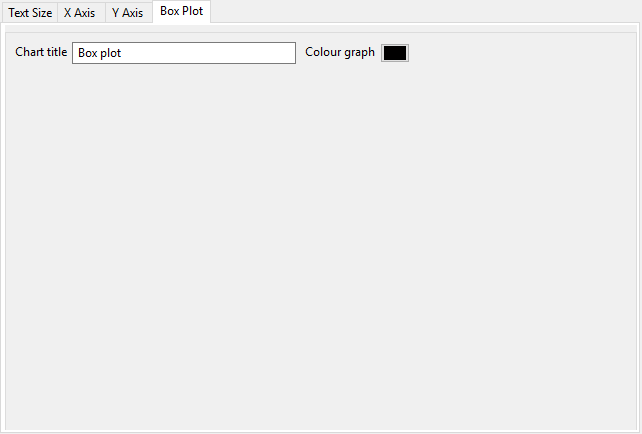
This section allows you to specify a title for the resulting graph, as well as the colour.
Was this page helpful?
