Pie Chart
Create a pie chart.
Click for tutorial: Chart Viewing and Exporting
Instructions
Follow these steps:
-
On the Data ribbon, click Source Data to import your data into VDA.
-
In the Explorer Visibility pane, select the variable to use.
-
In the Data Explorer pane, select the dataset.
-
On the ribbon, go to the Stats tab, then click Pie Chart. A pie chart will be created automatically using default settings that can be edited after it has been created.
Note: The icon will be disabled if the data selected is invalid for some reason.
-
Use the options in the Properties column to customise your chart.
To refresh the chart, click the
 icon in the upper right corner.
The Properties column lets you edit the title, colours, and type of information that is displayed.
Data
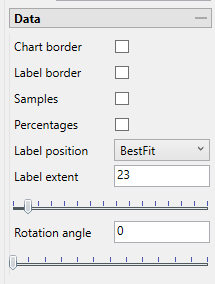
Option Result Chart border Add a line border around the outside border and around each bin. Label border Add a background behind each label. Samples List the number of samples used for each bin in the labels. Percentages Show the overall percentage for each bin in the labels. Label position Use the drop-down list to position the labels. Label extent Use the slider to increase or decrease the length of the tag line for each label. This is only available when using the OutsideEnd label position. Rotation angle Use the slider to adjust the orientation of the pie chart. Annotations and Legend
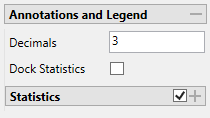
Option Result Decimals Set the number of decimal places used in the labels. Dock Statistics Enable to position the statistics table below the chart. Statistics Enable to display the statistics table. Color slices
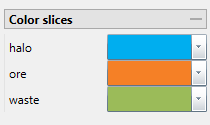
To change the colour of the pie bins, select a colour from the colour chart corresponding to its label. Each section label will be displayed.
Additional Customisations
Move the location of the statistics panels by clicking and dragging them to the desired location.
Adjust the font style and size by clicking the Visualisation tab at the top of the Vulcan Data Analyser panel, then clicking Font Styles.

