Contact Profile Analyser - Excel options
Text Size tab
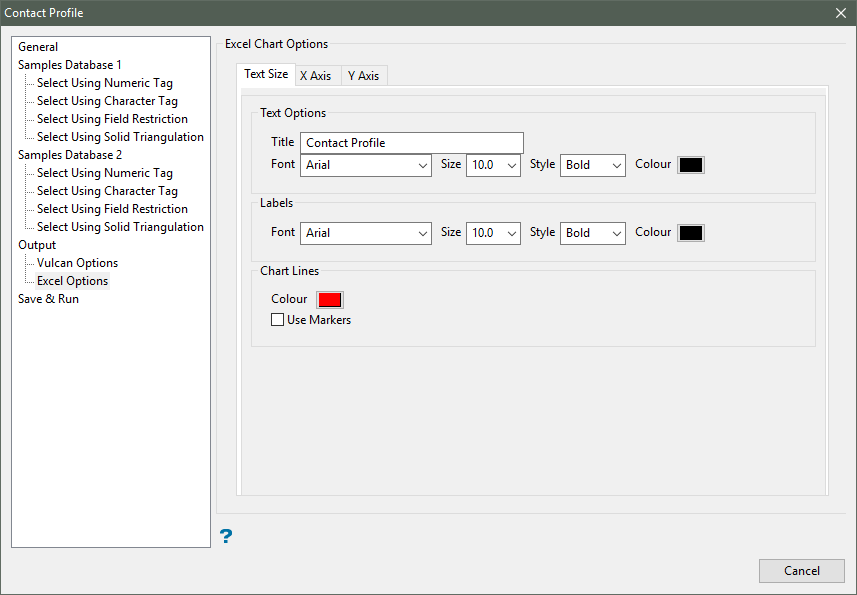
Text Options
This section to specify a title for the resulting Excel chart, as well as configure the font settings for the title text, that is, the font type, font size, font style (normal, bold, italics, or bold italics) and font colour.
Labels
This section to configure the font settings for the graph label text, that is, the font type, font size, font style and font colour.
Chart line
Select a colour for the available chart lines (performance, width and length).
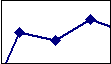
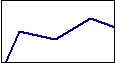
Use markers
Select this checkbox to use markers to highlight points in the resulting graph. The marker style, that is, the marker shape and colour, are defined through the Excel application.
|
|
|
Figure 1: Use Markers checkbox enabled |
|
|
|
Figure 2: Use Markers checkbox disabled |
X / Y-axis tabs
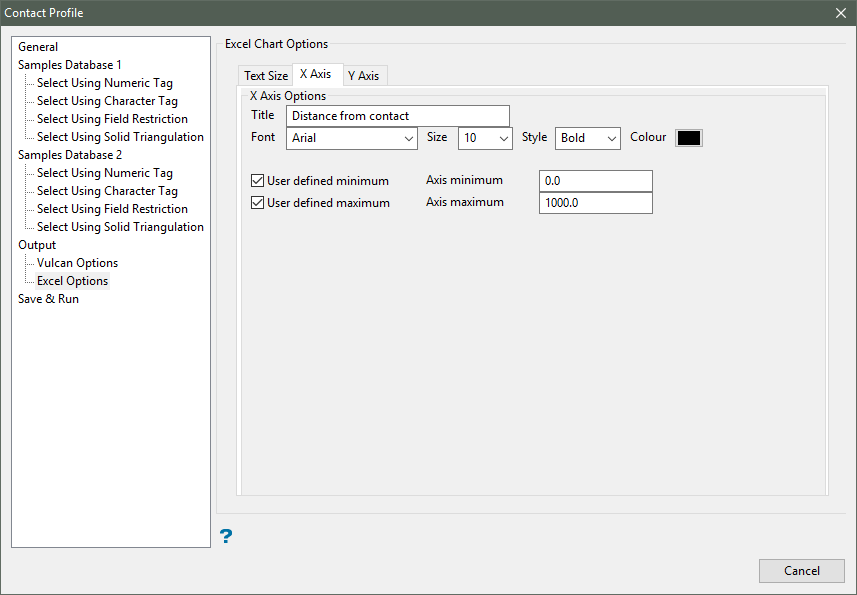
X / Y-axis options
This section allows you to specify a title for X-axis within the resulting Microsoft Excel chart, as well as configure the font settings for the axis title text, i.e. the font type, font size, font style (normal, bold, italics, or bold italics) and font colour.
User defined minimum/maximum
This section allows you to manually define the range of the axis. If these fields are left blank, then Vulcan will find the minimum and maximum from the data.
