Filter
Filter Monitor Data History
Use the Filter option to smooth monitor data using a time series filter. Certain monitoring data is inherently 'noisy', and the Filter option attempts to reduce the effect of this 'noise'.
The Filter option works on the currently loaded database by taking a value from one field, applying the filter based on that value and all previous values, and writing the result back to another field. For example, a prism dataset can contain a field with the slope angle field ANGLE. In the datasheet definition, add another field on the same record to store the filtered angle, FANGLE. You then run the Filter option, from field ANGLE to field FANGLE.
You could also filter the point position. For example, add extra fields FX, FY, and FZ to the monitor datasheet. Use the Filter option to fill these fields from their respective X, Y and Z fields. Then create a new Data Mapping , based on the FX, FY and FZ fields, thus enabling you to view the filtered data.
See below for information on the filtering algorithm .
Instructions
On the Open Pit menu, point to Monitoring, and then click Filter to display the Filter panel.
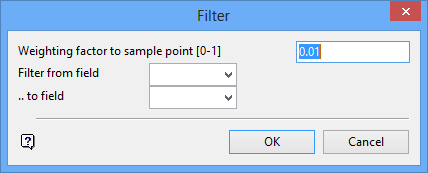
Weighting factor to sample point
Enter the weighting factor, which is a number between 0 and 1. The weight applies to the current point in the filter. Higher weightings give more emphasis to the current point, and lower weighting give emphasis to the time history. Comparing the filtered and unfiltered data on charts will illustrate this weighting.
Filter from fieldThis refers to the field to be filtered. You can select the required field from the drop-down list.
... to field
This refers to the field that will store the filtered field. You can select the required field from the drop-down list.
Click OK.
The database will then receive the filtered data.
Use the Identify option, with the Identify all base and derived parameters check box checked, to view the results.
Filtering Method:
The filter maintains a running average on the first time derivative (velocity) of the data. This gives better results than a simple weighted running average of the data, especially when time intervals are irregular.
The filter algorithm is as follows:
Given: a series of timed parameters (x i , t i ) where i = 1,..,n and t i > t i-1 ; w = weighting factor; y i = filtered result.
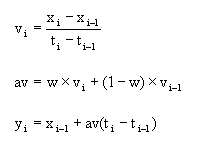
where av = average velocity.
