Charts
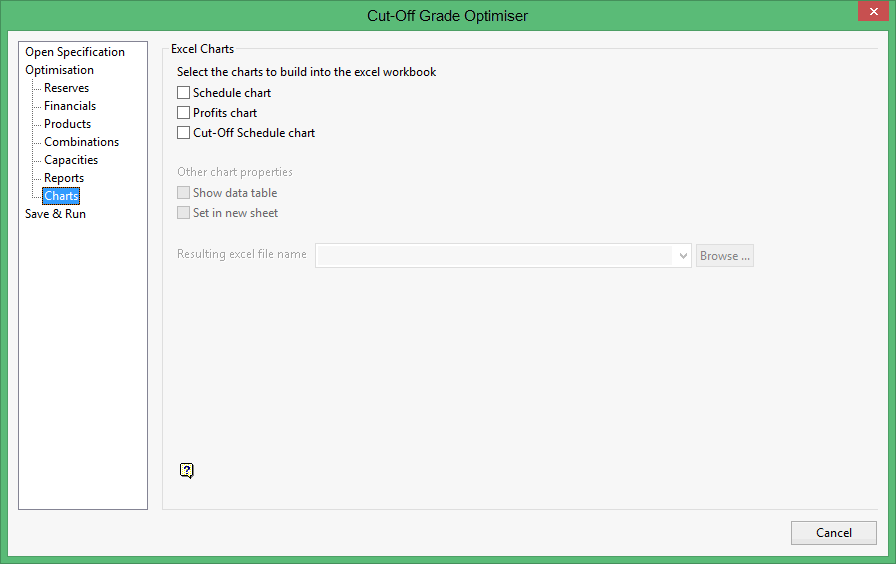
The Charts section to export the outputs as a chart in a Microsoft Excel spreadsheet. The following chart types are available:
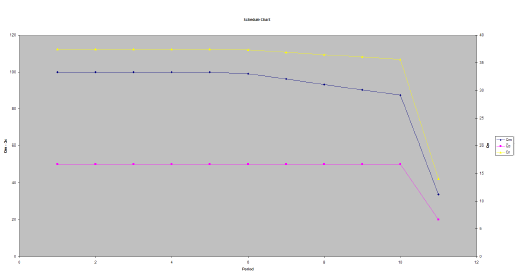
Schedule chart
This type of chart will allow you to display the QM-QC and QR quantities for each period in the scheduling.
|
|
|
Schedule Chart |
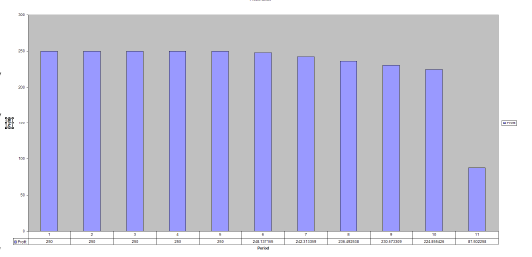
Profits chart
This type of chart will allow you to display the cash flow for each period in the scheduling.
|
|
|
Profits Chart |
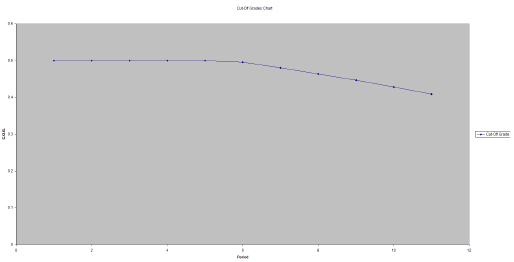
Cut-Off Schedule chart
This type of chart will allow you to display the cutoff for each period in the scheduling.
|
|
|
Cut-Off Schedule Chart |
The following options are only available when one or more chart types have been selected. If a chart type has not been chosen, then these options will be unavailable.
Show data table
Select this checkbox to display each value in the graph.
Set in new sheet
Select this checkbox if you want the resulting chart to be created in a separate worksheet. If this checkbox is not checked, then the resulting chart and report displays in the same worksheet.
Resulting Excel file name
Enter the name of the Microsoft Excel file (.xls) that will be used to store the resulting chart. The drop-down list displays all .xls files found in the current working directory. Click Browse to select a file from another location.
To create a new file, enter the file name and file extension.
