Display
Display a Statistics Results file
Use the Display option to display calculated statistics/graphs from a previously created Statistics Results file (.srf).
Instructions
On the Analyse menu, point to Statistics, and then click Display to display the Display panel.
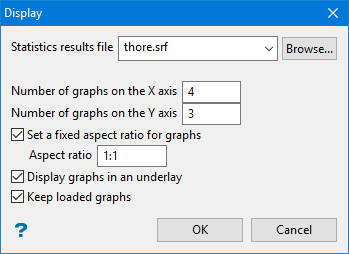
On this panel specify the name of the statistics results file, the number of graphs in the X and Y directions you want to display, whether to display them as underlays or layers and whether or not to retain any graphs that are currently displayed in the Graph window.
Statistics results file
Enter, or select from the drop-down list, the name of the Statistics results file (.srf), or click Browse to select a file from another location. The format of the default file name is:
<specification_name>_<graphic>_<dataid>.srf
If the system encounters any problems while running the statistics, the problem areas will be placed in a file with the same name as the results file and suffixed with an extension of .err.
Number of graph on X/Y axis
Enter the number of graphs/statistics (in the X and Y direction) that you want displayed in the Graphs window. Each graph displays in its own window in the main Graph window.
If you enter '4' as the number of sub-windows for the X axis, and '3' as the number of sub-windows for the Y axis, you will get 12 sub-windows. If there are more graphs/statistics than the specified number of sub-windows, you will be able to scroll (by page or by graph).
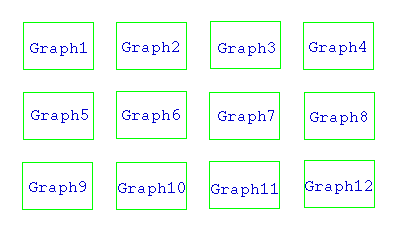
Figure 1: Sub-windows
Set fixed aspect ratio for graphs
This will set the ratio aspects between the X and Y axes.
An aspect ratio of 1:1 will produce a graph in which the X and Y axes are the same size.
Display graphs in an underlay
Select this check box to display the graphs as underlays. If this check box is not selected, then the resulting graphs displays as layers. These layers are named VSTGR<n> where <n> = the number of the display layer.
Graph1 would be displayed as layer VSTGR1, Graph2 as layer VSTGR2 etc.
Retain current graphs
Select this check box to keep the display of the current graphs/statistics.
Click OK.
