Product Graph Settings
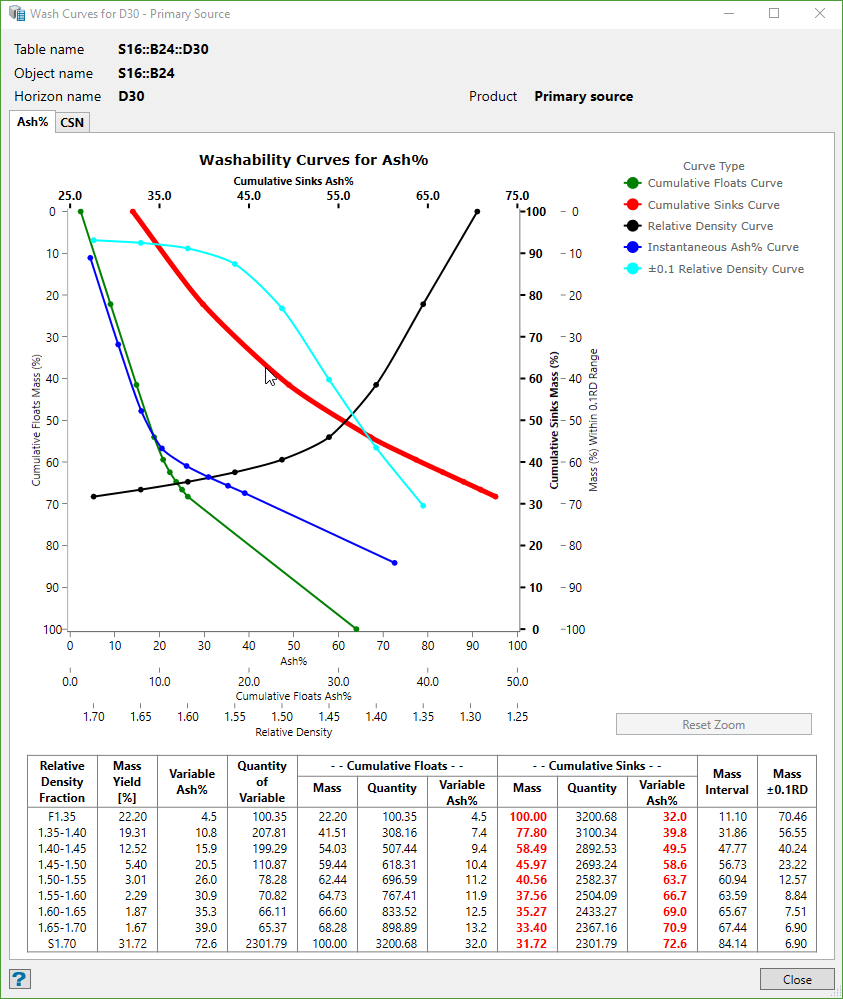
The system draws product graphs based on Maptek Chart system. Use this option to configure the settings of how those graphs are to be displayed on the screen. The product graphs can be seen from Product Graphs option in the Report from Washability Tablemenu.
Instructions
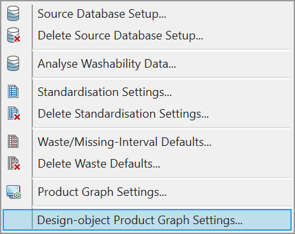
On the Washability menu, point to Setup, and then click Product Graph Settings to display the following panel.
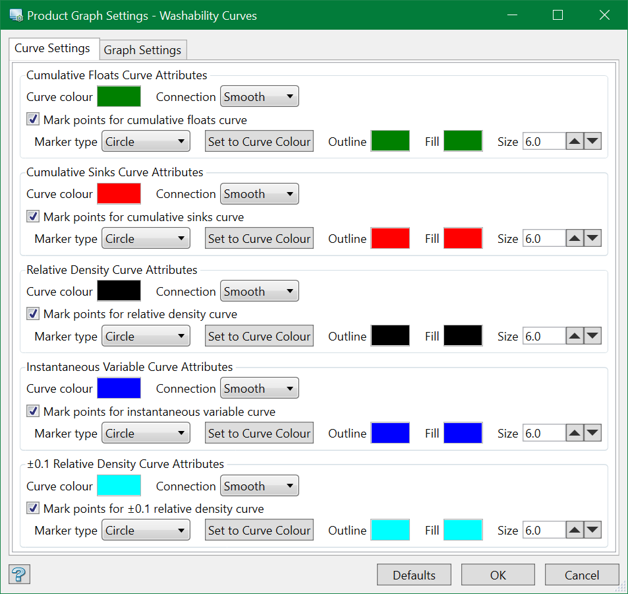
Curve Settings
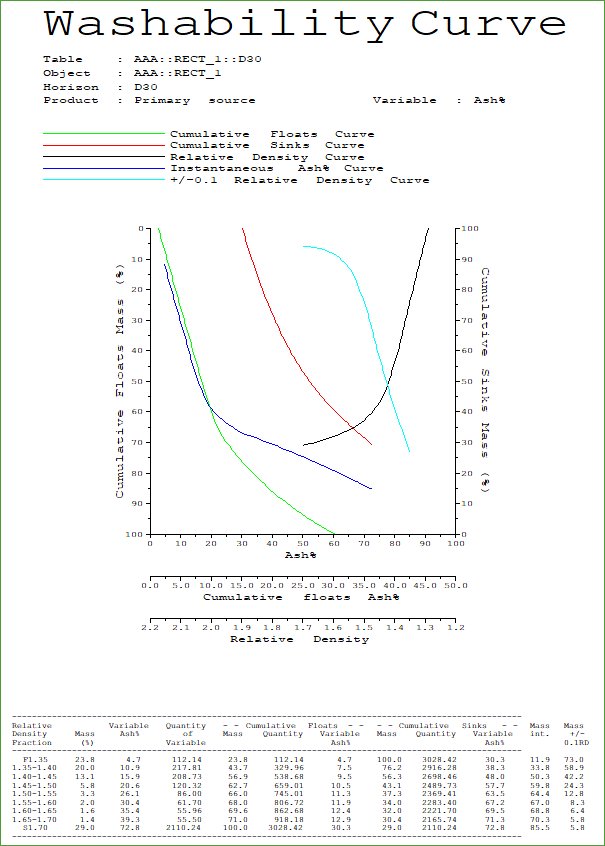
There are altogether five curve types for displaying the product graphs. They are:
- Cumulative Floats Curve Attributes
- Cumulative Sinks Curve Attributes
- Relative Density Curve Attributes
- Instantaneous Variable Curve Attributes
- ±0.1 Relative Density Curve Attributes
For each curve, there is a set of common attributes to be defined.
Curve Colour
Select the colour of the curve with the colour picker. Make sure that each curve has a different colour to differentiate them in the graph.
Connection
Based on the washabilty data, there are many points used to draw the product curves. Connection is the graphical style used to connect one point to another. There are three connection types, namely None, Line, and Smooth. None will display only the marker points while connecting the points. Make sure that a marker is selected if you are using None. Lines will connect the points with straight line segments. Smooth will attempt to put a smooth curve between the points.
Marker
The marker points are optional graphical elements used to mark the points used in drawing the graph curve. You can choose to turn it on by selecting the checkbox. There are ten types of Marker Type you can choose from the drop-down list, eg. circle, triangle, diamond, square, etc. Each marker can have a different colour than the curve or can have a different outline too. Use the Outline and Fill options to define these colours.
However, most of us would want a single colour per curve for uniformity and hence, we can use the button Set to Curve Colour button to match the marker outline and fill colours with the curve colour. This needs to be configured only once.
You can also change the Size of the markers. The marker size is 6.0 by default.
If you happen to mess around with the settings and want to revert back to the original, there's a button called Defaults located at the bottom of the panel, which brings all the parameters back to the system default.
Graph Settings
These settings can be used to configure the appearance of the graphs layout.
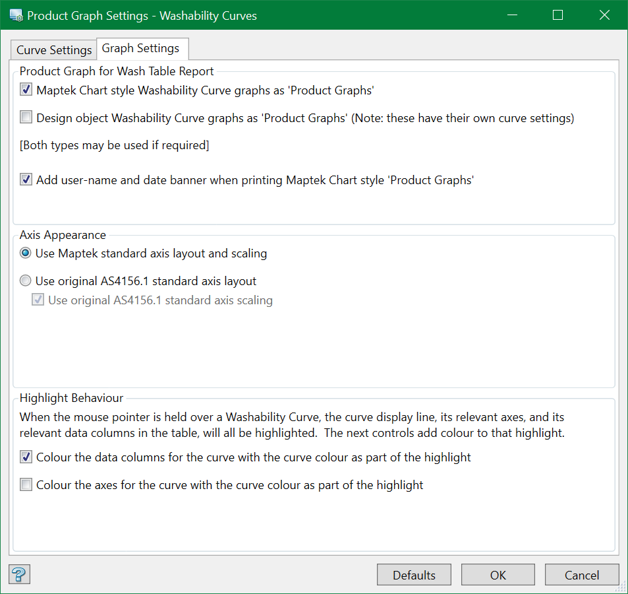
Product Graph for Wash Table Report
By default, the appearance of the product graphs will be the new Maptek Chart style Washability Curve graphs. You can also add username and date stamp to these graphs if you need to print them.
However, if someone wants to use the original standard graphs, there is an option to select the older Design object Washability Curve graphsoption.
These graphs are not mutually exclusive. You can have either or both of them. However, if the design object graph is selected, it will cause changes to both the Setup and main menus. The Setup menu will have an extra option to configure the curve settings for these older style graphs as shown below. For more, refer to Set up Curve.
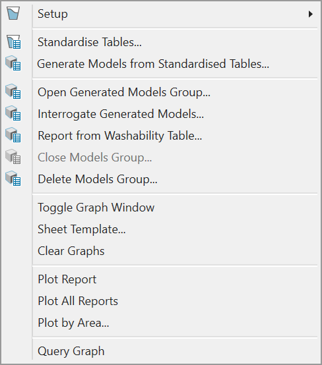
The main menu will have seven extra options (as used in legacy Washability system) for reporting on the curves displayed in the plot window. To know more, you can refer to the Legacy Washability Help.
Axis Appearance
You can choose to use the Maptek standard axis layout and scaling or the original AS4154.1 standard axis layout and scaling to display the product graphs. By default, the Maptek standard is used.
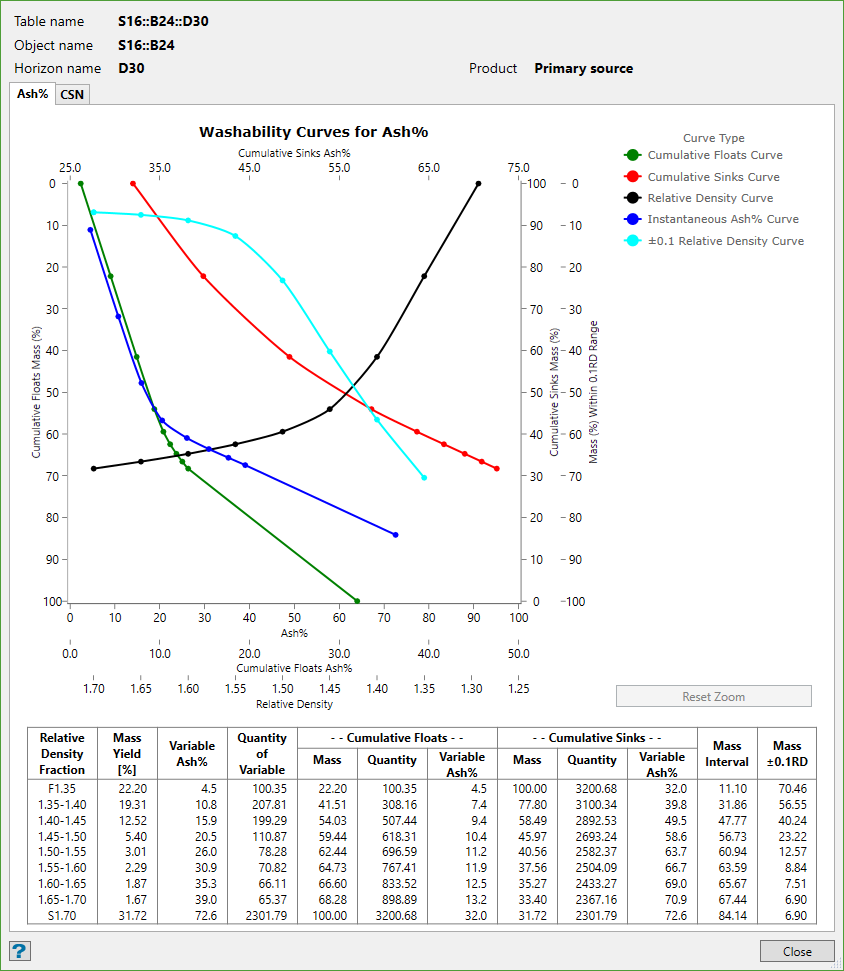
Highlight behaviour
When the mouse pointer is hovered over a washability curve, the curve line, its relevant axes and data columns in the table will be highlighted. You can also match the axes and data columns' colours with the curve colour by selecting the respective checkboxes.
The result of this highlight can be seen in the image below.