Set Up Stick Display
Configure Display Settings for Stickplots
The Set Up Stickplot Display option to easily configure the default display settings to use when displaying 3D structural data through a stickplot.
A stick plot, which represents the apparent dip of the logged depth of a geotechnical structure, plots the dipmeter or drift results where the dip angle is plotted vs. the angel at which the section, created by the user, intersects the plane of the geotechnical structure.
Having this information allows you to improve the accuracy of the horizons interpolation between wells/drillholes.
Prerequisites:
- Open the desired database
- Load the desired polygon(s) encompassing one the section lines
- Create a cross-section in the desired area
- Optionally, set up the 3D display as desired
Instructions
- Select Geotech menu
- Select Display submenu
- Select Set Up Stickplot Display option
The following panel displays
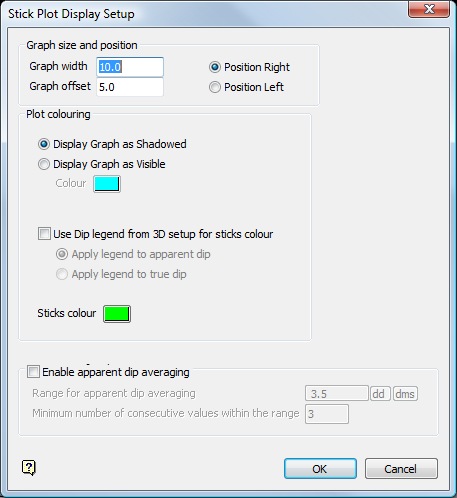
Stick Plot Display Setup panel
Graph size and position
Graph width
Enter the graph width. This value refers to the width of the final stickplot representation in metres/feet etc.
Graph offset
Enter the offset for the stickplot representation. This value determines the distance, taken from the current section plane, from which the resultant graph will plot. Enter a value of 0 if you want to plot on the current section plane.
Position Right/Left
Select whether you want to position the stickplot plot to the right ( Position Right ) or left ( Position Left ) of the drillhole trace.
Plot Colouring
The graph can either be shadowed ( Display Graph as Shadowed ) or displayed using a specific colour ( Display Graph as Visible ). The colour is selected from the current colour table.
Display Graph Shadowed
Select this option to display the graph grid lines as shadowed (grey in colour). Having the lines this specific colour allows you to easily view and select only the tadpoles on the graph using Vulcan's interactive selection.
Display Graph Visible
Select this option to be able to choose a specific colour for the graph grid lines. The colour is selected from the current colour table.
Use Dip legend from 3D setup for sticks colour
Check this check box to use the settings defined in the Structural Data Display panel (in Geotech > Display > Set Up 3D Display ) to colour the stickplots. You must also choose to apply the legend to the apparent or true dip.
Apply legend to apparent dip
Select this option to use the apparent dip value to colour the stickplots.
Apply legend to true dip
Select this option to use the true dip value to colour the stickplots.
Sticks Colour
Select the desired colour for the sticks from the current colour table.
Enable averaged representation
Check this check box to allow consecutive similar stickplots to be grouped and replaced with a single stick that is used to representative the group. In the diagram below, use of this option has enabled Vulcan to replace a group of consecutive single sticks that have close dips and dip directions with one stickplot with a hashed (broken) line style. The stickplots with a solid line style represent individual structures that cannot be grouped in the current parameter ranges structures.
Figure 1: Averaged Stickplot Representation
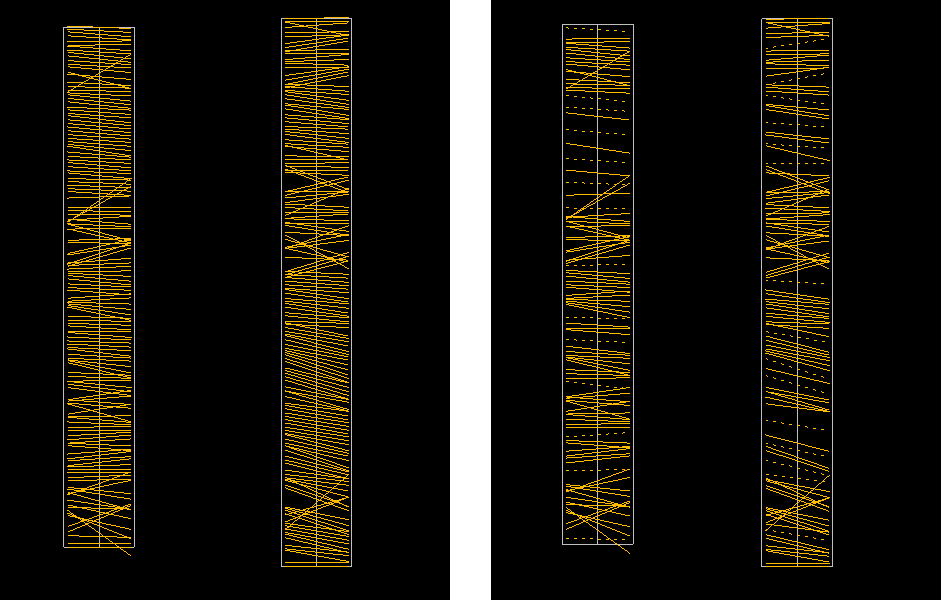
 Note
Note
For drillholes with regular logging, the large, averaged tadpoles indicate the presence of dominant structures.
Range for apparant dip averaging
Enter the dip value (in dd or dms) used to determine whether a specific stickplot is in range to belong to a single averaged stickplot representative.
Minimum number of consecutive values in the range
Enter the minimum number of consecutive stickplots that must be in the defined range to be replaced by a single averaged stickplot representative.
Select OK.
The values are then changed according to the selected settings, and will be applied until they are changed again.
