Section with Drilling and Assay Colour Bars
In this example: you will plot drilling information on the right side of the trace. The assay intervals will be highlighted by labelled colour bars. There will be check marks alongside the colour bars. The trace of the hole will be coloured by rock type.
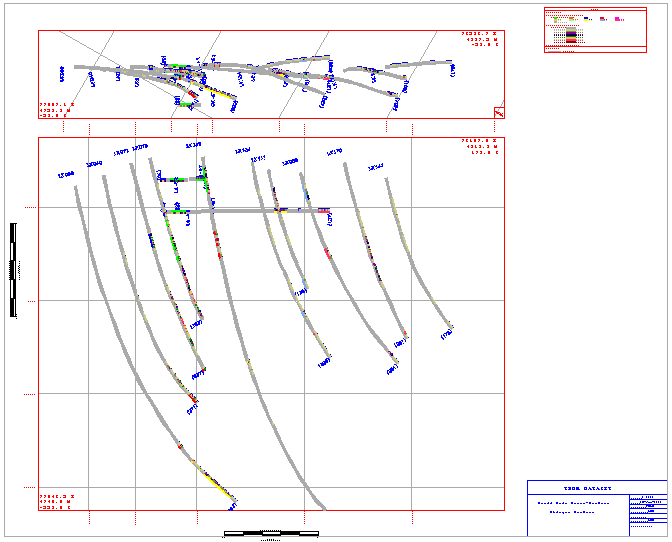
Plot of drillhole traces and assay colour bars
Before selecting the Batch Plotting option, we recommend that you load all of the data that you want to plot into Vulcan. This will make it easier in the Data Elements section of the batch plotting process.
Data Extent
to set coordinates of the section view.
Page Setup
to set the scale of the plot.
Plot Elements
to turn on border, views, legend, title block, grid lines, scale bar and northpoint.
Data Elements
to specify the data types to include in the plot..
Apply and Run
to save the specification file and to create the plot file.
Data Extent
- Select the Data Extent option from the tree control in the left half of the panel.
- Select the Digitise Extent button.
- Indicate (by clicking) the lower left hand corner of the extent.
- Indicate (by clicking) the upper right hand corner of the extent.
- The fields on the Data Extent panel will now contain values.
- Ensure, by rotating the view, that the thickness is applicable for your plot. That is, make sure that the data you want to plot is contained in the extents. Alter the thickness if necessary.
Page Setup
- Select the Page Setup option from the tree control in the left half of the panel.
- Select the Specify page size by data extent and scale option.
- Enter a horizontal and vertical scale. Observe how as the scale changes the page width and height values (in the Calculated Page Measurement section of the panel) change.
- Alter the horizontal and vertical scales until you are satisfied with the size of the plot.
As the Plot Elements will effect the size of the plot, you will need to return to this section to verify the final size of the plot.
Plot Elements
- Select the Plot Elements folder from the tree control in the left half of the panel.
- Select the Border, Views, Gridlines - Absolute Grid, Title Block, Legend, Scale Bar and North Points check boxes.
- Select the Border option from the tree control in the left half of the panel.
- Select the colour and line type for the border.
- Select the Views option from the tree control in the left half of the panel.
- Select the Plot Section View check box.
- Select a colour and line style for the border of the plan view plot.
- Select the Plot Plan View check box.
- Select a colour and line style for the border of the plan view plot.
- Select the plus sign (+) to the left of the Gridlines option.
- Select the absolute option.
- Select the colour for the annotations and gridlines, and the line style for the gridlines.
- Enter the text height, number of decimal places for the annotations, size of the check marks and the spacing between the gridlines.
- Select the plus sign (+) to the left of the absolute option.
- Select the section option.
- Select the Display Lines, Annotate first point and Annotate final point check boxes for both Easting and Northing. Select the Display Lines and Annotate first point check boxes for Elevation
- Select to Annotate text Perpendicular to View Rectangle.
- Select the plan option.
- Select the Display Lines and Annotate first point check boxes for both Easting and Northing.
- Select to Annotate text Perpendicular to View Rectangle.
- Select the Title Block option from the tree control in the left half of the panel.
- Enter the title block information.
- Enter the length of the title block, select a colour for the title block and enter the text height.
- Select the Legend option from the tree control in the left half of the panel.
- Select a colour and line style for the legend.
Note: It is not necessary to change the default settings. Items that are checked that are not part of your plot (for example grid models) are not included in the legend.
- Select the Scale Bar option from the tree control in the left half of the panel.
- Select the Include Horizontal Scale bar check box.
- Select the Draw at Bottom of Plot check box.
- Enter the number of intervals and the interval length. The plot displayed above has a length of 100 and zero intervals.
- Select a colour, line type and pattern for the scale bar.
- Select the Include Vertical Scale bar check box.
- Select the Draw at Left of Plot check box.
- Enter the number of intervals and the interval length. The plot displayed above has a length of 100 and zero intervals.
- Select a colour, line type and pattern for the scale bar.
- Select the Northpoint option from the tree control in the left half of the panel.
- Select to include a north point in the lower right corner of the plan view.
- Select a colour, line style and pattern for the northpoint.
- Return to the Page Setup panel and ensure that the size of the plot is still appropriate. Alter the horizontal and vertical scales if necessary.
Data Elements
- Select the Database Fields folder from the tree control in the left half of the panel.
You will be setting up three fields; geology for the trace, assay for the colour bars on the right and check marks for the intervals.
Geology
- Click in the Fields column. Select the file type (Drillhole Database), data sheet, identifier, record and field from the drop-down lists.
- Click in the Interval Point/Construction method column. From the displayed panel, select one of Top and bottom depths, Bottom depth or Thickness and bottom depth. The option you select will depend upon the fields in your selected record (table).
- Click in the Trace column.
- Enter -0.1 for the First offset for Trace for both the section and plan views.
- Enter 0.1 for the Second offset for Trace for both the section and plan views.
- Select a Patterned Symbol for vertical traces in plan view.
- Select to include the trace in the section and plan views.
- Select the Attributes option from the tree control on the Trace panel.
- Select the Use Scheme option.
- Enter the scheme group (DRILL_COLOUR).
- Select the scheme name from the drop-down list.
- Specify a default colour.
- Click OK.
- Click in the Checks column.
- Remove any checks in the Views to include check for start or end of interval sections
- Click OK.
- Click in the Annotation column.
- Remove any checks in the Views in which to include annotations section.
- Click OK.
- Click in the DSR column.
- Select the Use DSR check box.
- Select the DSR database identifier from the drop-down list.
- Click OK.
Assay
- Click in the Fields column. Select the file type (Drillhole Database), data sheet, identifier, record and field from the drop-down lists.
- Click in the Interval Point/Construction method column. From the displayed panel, select one of Top and bottom depths, Bottom depth or Thickness and bottom depth. The option you select will depend upon the fields in your selected record (table).
- Click in the Trace column.
- Enter 0.1 for the First offset for Trace for both the section and plan views.
- Enter 0.2 for the Second offset for Trace for both the section and plan views.
- Select a Patterned Symbol for vertical traces in plan view.
- Select to include the trace in the section and plan views.
- Select the Attributes option from the tree control on the Trace panel.
- Select the Use Scheme option.
- Enter the scheme group (DRILL_COLOUR).
- Select the scheme name from the drop-down list.
- Specify a default colour.
- Click OK.
- Click in the Checks column.
- Remove any checks in the Views to include check for start or end of interval sections
- Click OK.
- Click in the Annotation column.
- Remove any checks in the Views in which to include annotations section.
- Click OK.
- Click in the DSR column.
- Select the Use DSR check box.
- Select the DSR database identifier from the drop-down list.
- Click OK.
Interval
- Click in the Fields column. Select the file type (Drillhole Database), data sheet, identifier, record and field from the drop-down lists.
- Click in the Interval Point/Construction method column. From the displayed panel, select one of Top and bottom depths, Bottom depth or Thickness and bottom depth. The option you select will depend upon the fields in your selected record (table).
- Click in the Trace column.
- Remove any checks in the Views in which to include trace section.
- Click OK.
- Click in the Checks column.
- Enter 0.2 for the First offset for Checks for both the section and plan views.
- Enter 0.3 for the Second offset for Checks for both the section and plan views.
- Select to include the end interval check in the section and plan views.
- Select the Attributes option from the tree control on the Checks panel.
- Select the Single Colour radio button.
- Specify the colour for the checks.
- Click OK.
- Click in the Annotation column.
- Remove any checks in the Views in which to include annotations section.
- Click OK.
- Select the Use DSR check box.
- Select the DSR database identifier from the drop-down list.
- Click OK.
Apply and Run
- Select Apply and Run to create the plot file. A preview displays on completion of the plot generation in the Plot Utility.
