Cube Multi Display
Instructions
On the Block menu, point to variography, and then click Cube Multi Display to display the Cube Variogram Multiple Slice Display panel.
Select slices
Click  in the Display Setup column to open the Display Parameters panel.
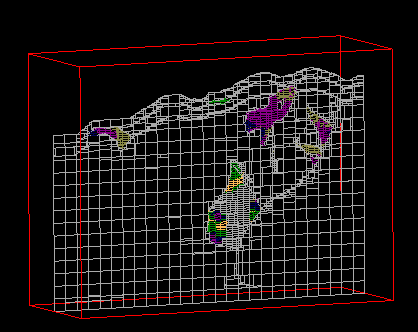
Show block edges
Select this check box to display the edges of each individual block, You will need to specify a colour for the edges. A Block Model Slice with Block Edges Displayed is shown below:
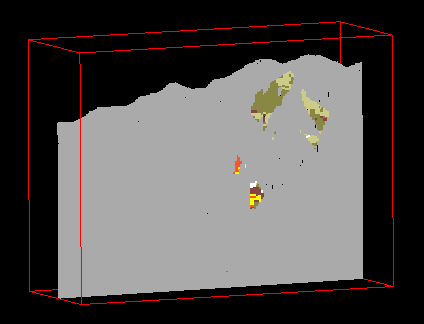
Show block filled
Select this check box to fill each individual block. Once the Details tab is complete, you will need to select a colour legend for the blocks. A Block Model Slice with Filled Blocks is shown below:
Enable data tips
Select this check box to view (as a datatip) the block model variable information in the resulting slice. When you hover the cursor over the slice, the appropriate variable information displays. Datatips can be displayed for both filled and on-filled blocks. However, datatips for non-filled blocks will only be visible when in Section view, as shown below:
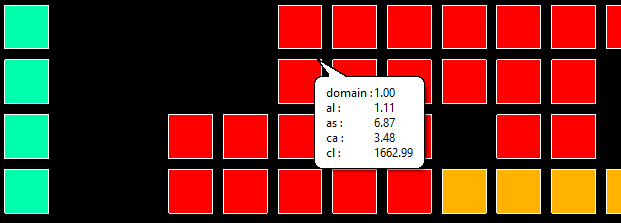
The Display Datatips check box (under the Graphics section of the Tools > Preferences option) must be selected in order to display datatips.
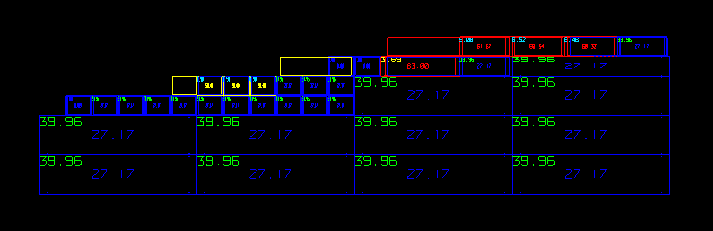
Display block text
Select this check box to annotate the block model blocks in the resulting slice. The text annotations are displayed using a 3 x 3 grid layout and are defined through the Variogram panel under the Graph tab. See below:
Colour Scheme
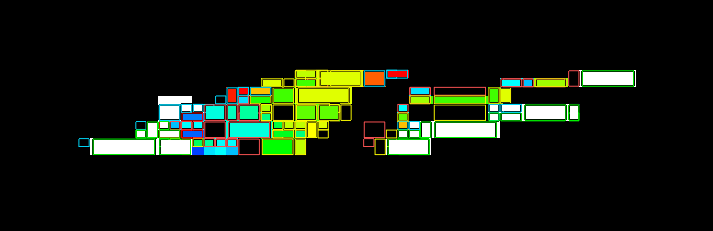
Colour by Spectrum
Select this option to colour the slices by spectrum. This mean that the colour spectrum is stretched over the variable values, thus small variable values are represented by red, large values by violet and the largest by white, as shown in the diagram below:
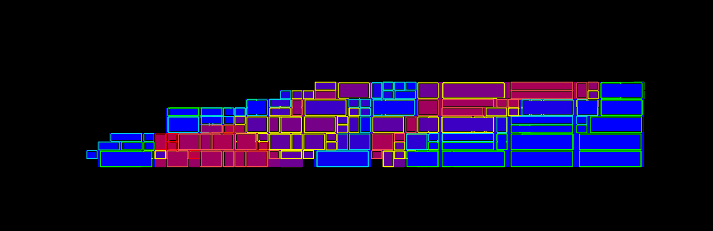
Interpolate between two RGB values
Select this check box the stretch two colour over the variable values.
For example, if you selected red and blue, then the small values would be red, the middle values purple and the large values blue. The colour of the middle values is an average of the two chosen colours, as shown in the diagram below:
By Vulcan Colour Scheme
Select this check box to colour the slices using a Vulcan colour scheme. A default scheme file and type is entered automatically, these can be altered. Select the file, type and colour legend from the drip-down lists. 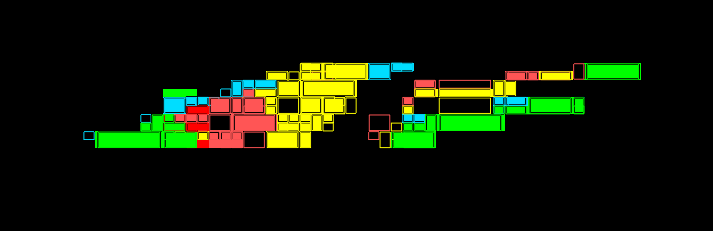
The colour schemes can be edited using the Analyse > Legend Edit option.
Note: If you select a Device_Colour scheme type, the range of colours will be stretched over the variable values, similar, but not the same as, the Colour by Spectrum option.Alpha legends are not fully supported.
Click OK to return to the Cube Variogram Multiple Slice Display panel.
Select Clean, or Remove Slices.
Click OK.
