Set Up Tadpole Display
Configure Display Settings for Tadpole Plots
The Set Up Tadpole Display option to configure the default display settings that are to be used when displaying 3D structural data through a tadpole plot.
A tadpole plot, which is also known as a 'vector plot', plots the dipmeter or drift results where the true dip angle is plotted versus depth as the displacement of a dot. A line segment points from the dot in the direction of dip using the usual map convention of north being at the top.
Having this information allows you to improve the accuracy of the horizons interpolation between wells/drillholes.
Prerequisites:
- Open the desired database
- Load the desired polygon(s) encompassing one the section lines
- Create a cross-section in the desired area
- Optionally, set up the 3D display as desired
Instructions
- Select Geotech menu
- Select Display submenu
- Select Set Up Tadpole Display option
The following panel displays
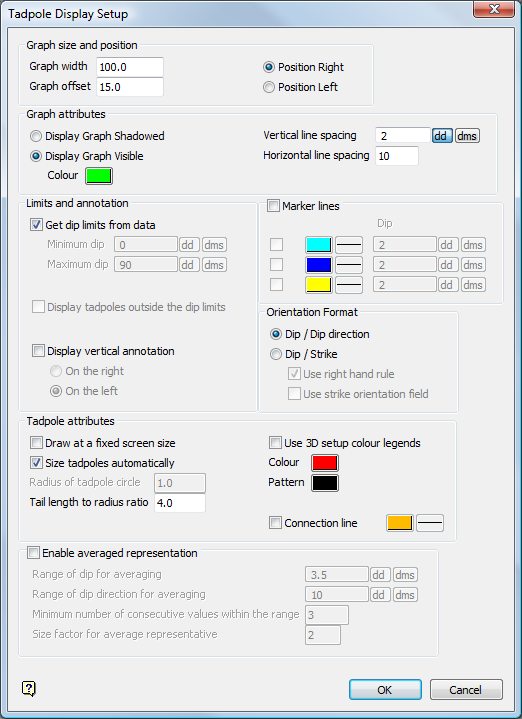
Tadpole Display Setup panel
Graph size and position
Graph width
Enter the graph width. This value refers to the width of the final plot in metres/feet etc.
Graph offset
Enter the offset. This value determines the distance, which is taken from the current section plane, from which the resultant graph will plot. Enter a value of 0 to plot on the current section plane.
Position Right/Left
Select whether you want to position the tadpole plot to the right ( Position Right ) or left ( Position Left ) of the drillhole trace.
Graph attributes
The graph can either be shadowed ( Display Graph as Shadowed ) or displayed using a specific colour ( Display Graph as Visible ). The colour is selected from the current colour table.
Display Graph Shadowed
Select this option to display the graph grid lines as shadowed (grey in colour). Having the lines this specific colour allows you to easily view and select only the tadpoles on the graph using Vulcan's interactive selection.
Display Graph Visible
Select this option to be able to choose a specific colour for the tadpole graph grid lines. The colour is selected from the current colour table.
Vertical line spacing
Enter the angular mesurement to be used as the vertical line spacing (in dd or dms).
Horizontal line spacing
Enter the horizontal line spacing in selected linear units (in feet, etc.).
Limits and annotation
Get dip limits from data
Check this check box to set the minimum and maximum dip values to those found in the hole, rounded up to 5 degrees. This ensures the graph is a sensible representation of the data range in its boundaries. This allows the user to narrow down the range of interest, and expand the graph in that range.
![]() Note
Note
Note: that if you activate this check box, the Minimum dip and Maximum dip fields are not available for editing.
Minimum dip
Enter the minimum (in dd or dms) dip to use for all graphs created using this option.
Maximum dip
Enter the maximum (in dd or dms) dip to use for all graphs created using this option.
Display tadpoles outside the dip limits
Check this check box to display the tadpoles both inside and outside the set limits. Using this option gives you a good sense of what is happening outside the selected range.
![]() Note
Note
This check box is not available when using limits.
Display vertical annotation
Check this checkbox to show depth markers. You will also need to select whether to show this annotation display on the right or on the left of the graph.
Marker lines
Check this check box to define up to three marker lines for the tadpole graph display.
Marker line 1 through 3
Check the check box to activate the marker line and define the colour, line style, and dip (in dd or dms) for the line. The colour is selected from the current colour table, and the line from the current line style table.
Orientation Format
Dip/Dip direction
Selecting this option will set the tadpole tail to point towards the dip/dip direction. This is the default.
Dip/Strike
Select this option to set the tadpole tailes to point towards the strike. You will also need to select the convention to be used to determine the dip/strike values. Select between the right hand rule or the strike orientation field.
Tadpole attributes
Use this section to define the attributes for the tadpole display.
Draw at a fixed screen size
Check this check box to ensure the tadpole circle size will remain scaled the same as fixed size symbols on the screen, regardless of any rotation, zoom, or exaggeration factors applied.
Size tadpoles automatically
Check this checkbox to set the default radius of the tadpole circles from the graph's dimensions. Note the Radius of tadpole circle field is not available when using this method.
Radius of tadpole circle
Enter the radius for the tadpole. This will be used for the "head' of the tadpole image. Note this option is not available when automatically sizing the tadpoles.
Tail length to radius ratio
Enter the length to radius ratio to be used for the tadpole "tail."
Use 3D setup colour legends
Check this check box to use the settings defined in the Structural Data Display panel (in Geotech > Display > Set Up 3D Display ) to colour the tadpoles. Note the Colour button is not available when using this method.
(Tadpole) Colour
Select a colour for the tadpole from the current colour table.
(Tadpole) Pattern
Select a fill pattern for the tadpole from the patterns file.
Connection line
Check this check box to define the colour and line type for the tadpole. The colour is selected from the current colour table, and the line from the current line style table
Enable averaged representation
Check this check box to allow consecutive similar tadpoles to be grouped and replaced with a single tadpole that is used to representative the group. In the diagram below, use of this option has enabled Vulcan to replace a group of consecutive single tadpoles that have close dips and dip directions with one larger tadpole. The smaller tadpoles represent individual structures that cannot be grouped in the current parameter ranges structures.
Figure 1: Averaged Tadpole Representation - Before and After Averaging
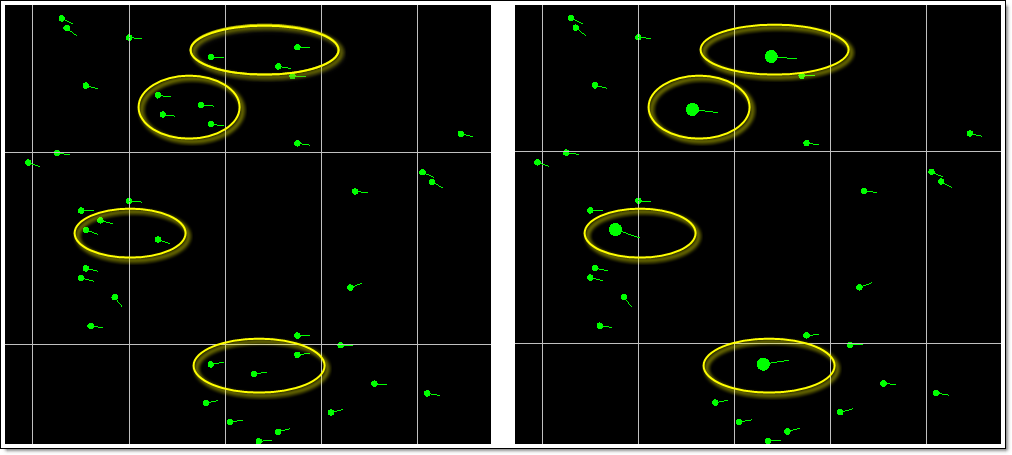
 Note
Note
For drillholes with regular logging, the large, averaged tadpoles indicate the presence of dominant structures.
Range of dip for averaging
Enter the dip value (in dd or dms) used to determine whether a specific tadpole is in range to belong to a single averaged tadpole representative.
Range of dip direction for averaging
Enter the dip direction value (in dd or dms) used to determine whether a tadpole is in range to belong to a single averaged tadpole representative.
Minimum number of consecutive values in the range
Enter the minimum number of consecutive tadpoles that must be in the defined range to be replaced by a single averaged tadpole representative.
Size factor for average representative
Enter the multiplier for the tadpole radius and stick length to use when differentiating a normal tadpole from one representing a group of averaged tadpoles.
Select OK.
The values are then changed according to the selected settings, and will be applied until they are changed again.
