Preferences
Use this option to set default values for colours, chart window size, and file storage location. Once set, Vulcan will apply the settings to the Data Analyser each time it is opened.
Instructions
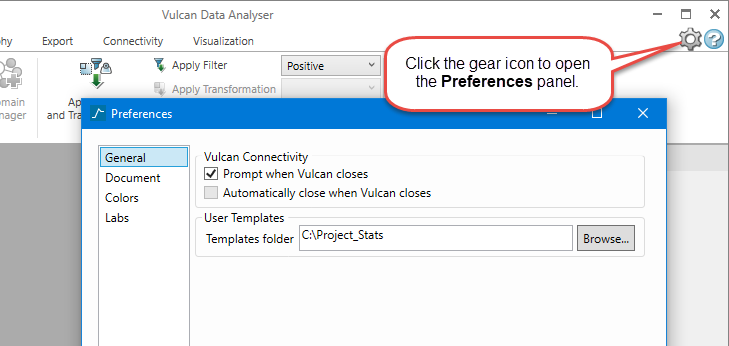
Within Vulcan Data Analyser, click the gear icon ![]() in the upper right corner to open the Preferences panel.
in the upper right corner to open the Preferences panel.
Follow these steps:
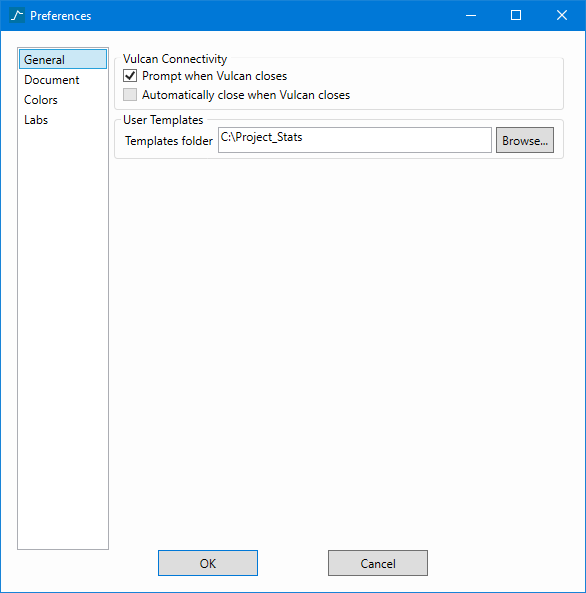
General tab
-
Set the way you want Data Analyser to respond when you close the main Vulcan application.
Prompt when Vulcan closes - Selecting this option gives you the option to continue working with the Data Analyser after the main Vulcan program has closed.
Automatically close when Vulcan closes - Selecting this option will allow Data Analyser to close when the main Vulcan program closes. If you have unsaved data you will be prompted to save it.
-
Set the location in which to save any customised templates. Click the Browse button to select the location.
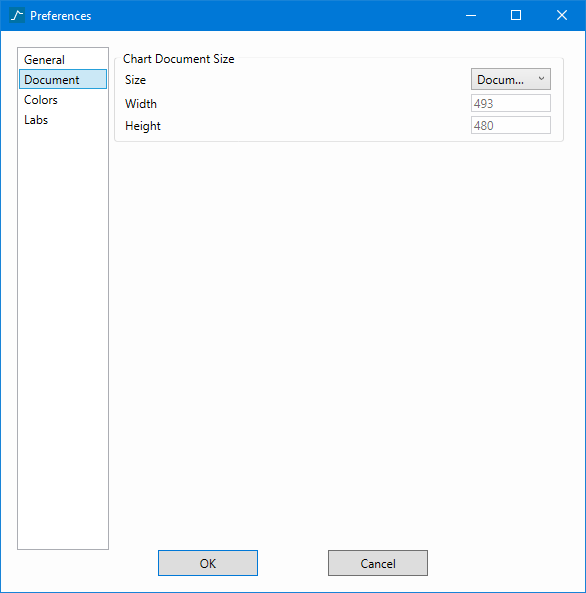
Document tab
-
Use the tab to set the size of your chart windows.
There are four settings:
Window - Uses the available pixels width and height for the chart size, not scaling it.
Document - Draws the chart using a width of 800 pixels and the proportional height, then scales the chart to the available space in the document area.
Small Document - Draws the chart using a width of 600 pixels and the proportional height, then scales the chart to the available space in the document area.
Custom - This allows you to set the width and height by entering your own settings.
Note: These controls are also available on the Visualisation tab in the main Data Analyser ribbon. However, setting the chart size from the ribbon will not preserve the settings after the Data Analyser closes.
-
Colours tab
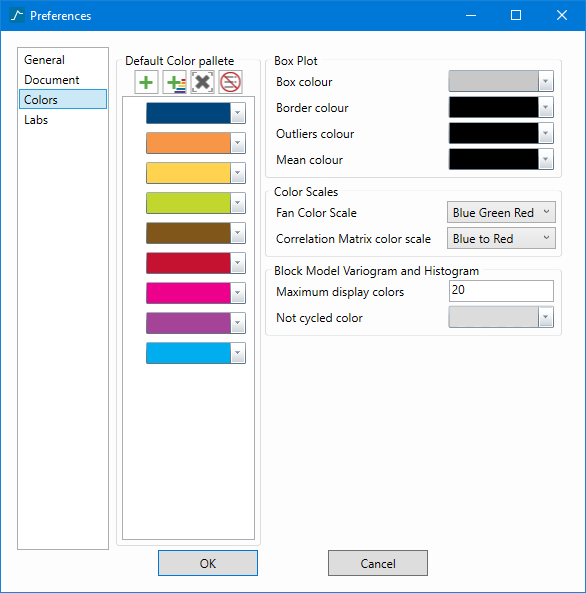
Use this tab to set the default colours used in your charts.
Editing the Default Colour Palette
-
Click the
 or
or  icons to add additional colour bars.
 -
Click the
 icon to delete only the highlighted colour bar.
 -
Click the
 icon to remove all colour bars.
 -
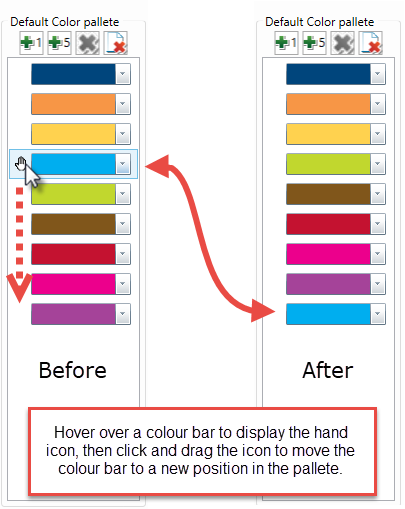
Reposition a colour bar by highlighting the bar to display the hand icon, then dragging the colour bar to the desired position.
-
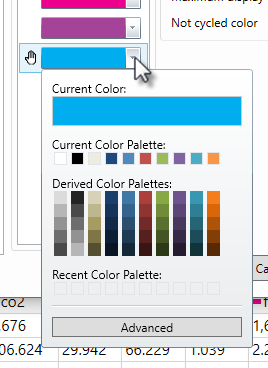
Click the Down Arrow to display the Colour Selection panel, then select a colour.
-
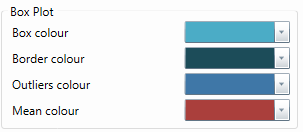
Set the colours for your Boxplots charts.
-
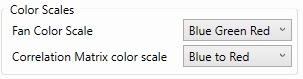
Assign the colours to be used in your fan variograms and correlation matrix charts.
-
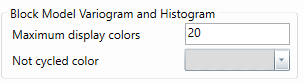
Assign the colours and also the number of different colours that will be used for your histograms and variograms.
Note: If you only want one colour, set the Maximum display colours to 1, then use Not cycled colour to select the single colour.
-
-
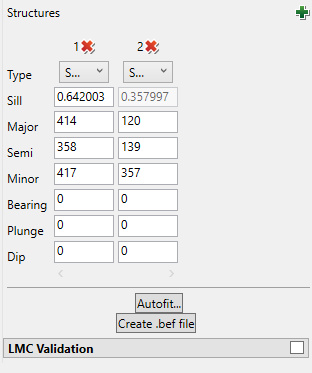
Labs tab
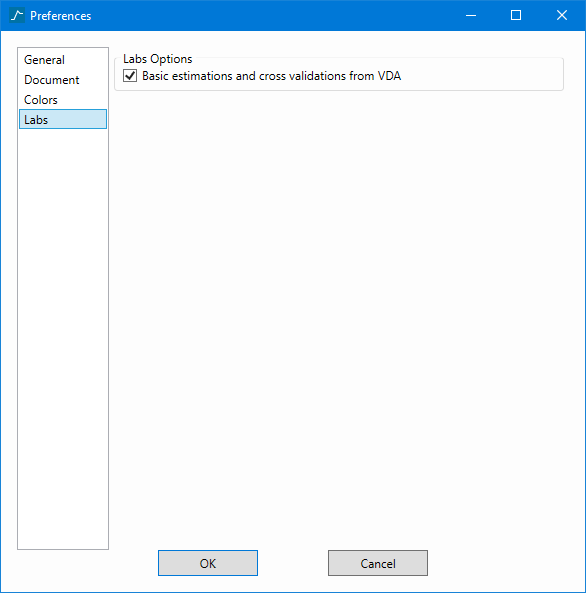
Displays a button below the variogram model Autofit, allowing you to create simple .bef files, then run an estimation or cross validation and immediately generates a chart with the results of djbmest.
Click OK to save all changes.
