Section with Border Style and Block Model
This example introduces the use of border style while creating a basic plot of a block model.
If you work through this example: then you will learn how to create a drafting sheet and how to utilise your drafting sheet while creating a plot of a block model.
Creating the Drafting Sheet
Drafting Sheet
-
Select the New option (under the File > Drafting Sheets submenu).
-
Enter the name for the drafting sheet. Use the format BP_<Name>, for example 'BP_ENVIS'.
-
Enter a description for the drafting sheet.
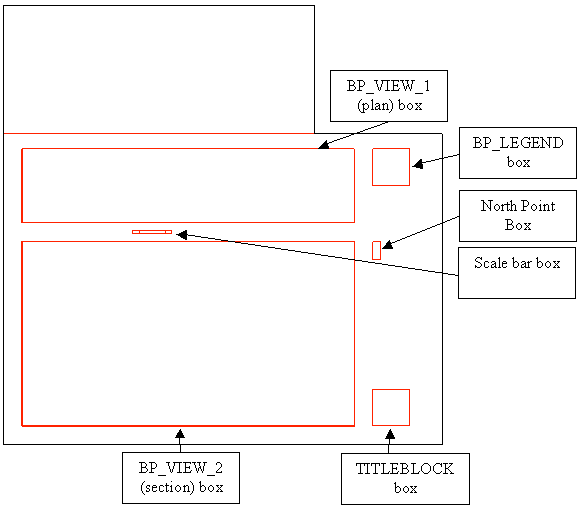
You will then be placed in the Drafting window, which will have the A0 template (both landscape and portrait) outline displayed. You will need to create different boxes to represent the various objects that you want to include in the plot. The colour and line style of these boxes will be the defaults, which are displayed in the Status toolbar.
-
Select the External option (under the File > Drafting Sheets submenu). This option to set the size of the entire plot, that is, will the plot be A0, A4, B2, user-defined, etc.
-
Select the paper size. For this example: select a standard paper size. The drafting sheet shown in the example above is A0 Landscape.
-
Enter the line thickness. The above diagram uses the default thickness.
-
Accept the External box.
Creating the Plan View Box
-
Select the File > Drafting Sheets > Internal option.
-
Indicate the origin of the internal box. You can use the grid snap button (
 ) on the Digitise toolbar to place accurately the origin.
 -
You will then be placed in the Drafting window, which will have the A0 template (both landscape and portrait) outline displayed. You will need to create different boxes to represent the various objects that you want to include in the plot. The colour and line style of these boxes will be the defaults, which are displayed in the Status toolbar.
-
Turn off the Use Scale Measurements check box.
-
Enter the units of measurement.
-
Indicate the second point of the Internal Box (this is the corner opposite to the origin).
-
Enter the line thickness.
-
Accept the Internal Box.
The Internal Box will be named 'INTERNAL', however, Batch Plotting requires that this box, which contains the plan view, has the name 'BP_VIEW_1'. Use the Name option (under the Design > Attribute Edit submenu) to change the object name.
Creating the Section View Box
This is the same as for the plan view except that you need to rename the internal box BP_VIEW_2.
Creating the North Point Box
-
Select the File > Drafting Sheets > North option.
-
Indicate the coordinate origin of the North point.
-
Enter the bearing of plan north.
-
Accept the North point box.
If the North point box extends outside of your External box, then right-click on the North Point box, select Move from the displayed context menu, and move the box to a better position.
Creating the Scale Bar Box
-
Select the File > Drafting Sheets > Scale option.
-
Indicate the coordinate origin of the scale bar.
-
Accept the scale bar box.
Creating the Title Block Box
To create the Title Block we need to create a rectangle and then name it 'TITLEBLOCK'.
-
Select the Rectangle button (
 ) from the Design toolbar.
 -
Indicate the region that will be used to define the resulting rectangle. To do this, indicate the first point and drag the "rubber band" rectangle in any direction to the second point. Click to accept the second point.
-
Create the rectangle.
-
Use the Name option (under the Design > Attribute Edit submenu) and change the rectangle's object name to 'TITLEBLOCK'.
Creating the Legend Box
To create the Legend Box we need to create a rectangle and then name it 'BP_LEGEND'.
-
Select the Rectangle button (
) from the Design toolbar. -
Indicate the region that will be used to define the resulting rectangle. To do this, indicate the first point and drag the "rubber band" rectangle in any direction to the second point. Click to accept the second point.
-
Create the rectangle.
-
Use the Name option (under the Design > Attribute Edit submenu) and change the rectangle's object name to 'BP_LEGEND'.
-
You will then be placed in the Drafting window, which will have the A0 template (both landscape and portrait) outline displayed. You will need to create different boxes to represent the various objects that you want to include in the plot. The colour and line style of these boxes will be the defaults, which are displayed in the Status toolbar.
You have now created the drafting sheet. Use the Save option (under the File > Drafting Sheets submenu) to save your drafting sheet with your drafting database. Refer to the Drafting Sheets documentation for more information on drafting sheets. As different printers have different setups, that is different non-printable margins, you may need to change the positioning of your template objects.
Creating the Plot
Before creating your plot we recommend that you load and display the data elements that you want to include in the plot.
Page Setup
to select the border style.
Data Extent
to select the extents of the plot area.
Plot Elements
to turn on legend, title block, grid lines, north point and scale bar.
Data Elements
to specify data types to plot.
Apply and Run
to create the plot file.
Page Setup
-
Select the Page Setup option form the tree control in the left half of the panel.
-
Select the Use drafting sheet option.
-
Select your border style from the drop-down list. At this stage don't worry about any error messages in the Status field.
Data Extent
-
Select the Data Extent option from the tree control in the left half of the panel.
-
Select the Fit drafting sheet button.
-
Enter the horizontal scale, select Apply Scale.
-
Enter the Vertical Scale, select Apply Scale.
-
Select the Drag Extents button.
-
Drag the extents onto the objects that you want plotted. If the objects do not fit inside the extents, then reselect the Fit Drafting sheet button and alter the horizontal and vertical scales. Note these scales are not applied until you select the Apply Scales button.
-
Ensure, by rotating the view, that the depth is applicable for your plot. That is, make sure that the data you want to plot is contained in the extents. Alter the depth if necessary.
Plot Elements
-
Select the Plot Elements folder from the tree control in the left half of the panel.
-
Select the Border, Views, Gridlines - Absolute Grid, Title Block, Legend, Scale Bar and North Points check boxes. It is not necessary to alter any of the settings on the Legend panel. Data elements that are not included in your plot will not be included in the legend.
-
Select the Border option from the tree control in the left half of the panel.
-
Select the colour and line type for the border.
-
Select the Views option from the tree control in the left half of the panel.
-
Select the Plot Plan View check box.
-
Select a colour and line style for the border of the plan view plot.
-
Select the Plot Section View check box.
-
Select a colour and line style for the border of the section view plot.
-
Select the plus sign (+) to the left of the Gridlines option.
-
Select the absolute option.
-
Select the colour for the annotations and gridlines, and the line style for the gridlines.
-
Enter the text height, number of decimal places for the annotations, size of the check marks and the spacing between the gridlines.
-
Select the plus sign (+) to the left of the absolute option.
-
Select the plan option.
-
Select the Display Lines and Annotate first point check boxes for Easting and Northing.
-
Select to Annotate text Perpendicular to View Rectangle.
Note: The annotations are placed outside the BP_VIEW_1 box, so they may overlap with your scale bar or north point. If this is the case, then edit your drafting sheet.
-
Select the section option.
-
Select the Display Lines and Annotate first point check boxes for Easting and Elevation.
-
Select to Annotate text Perpendicular to View Rectangle.
Note: The annotations are placed outside the BP_VIEW_2 box, so they may overlap with your scale bar or north point. If this is the case, then edit your drafting sheet.
-
Select the Title Block option from the tree control in the left half of the panel.
-
Enter the title block information.
-
Select the Scale Bar option form the tree control in the left half of the panel.
-
Select the Include Horizontal Scale bar check box.
-
Select the Draw in drafting sheet box check box.
-
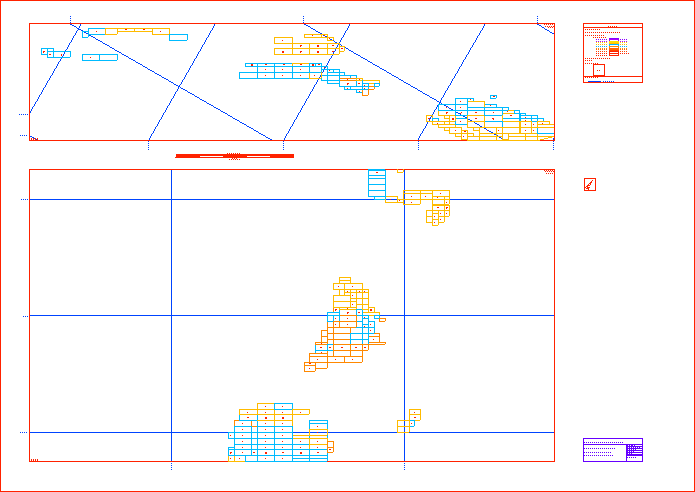
Enter the number of intervals and the interval length. The plot displayed above has a length of 100 and zero intervals.
-
Select a colour, line type and pattern for the scale bar.
-
Select the Northpoint option from the tree control in the left half of the panel.
-
Select the Style check box.
-
Select a colour, line style and pattern for the north point.
Data Elements
If you displayed the block model and blocks prior to creating the plot, then many of the following steps will already be completed. If fields appear on panels, but are not mentioned in the following instructions, then leave them as their default value.
-
Select the Block Model folder from the tree control in the left half of the panel.
-
Select the block model that you want to include in your plot. Click Browse to select a file from another location.
-
Select the Show in Section view and plan view check boxes.
-
Select a single colour or a colour scheme for the blocks. If you select a colour scheme, then you will need to specify the scheme name and variable.
-
If you want to limit the blocks plotted to those that meet certain criteria, then select the Block Selection option from the tree control in the left half of the panel.
-
If you want to annotate the blocks, then select the Block Annotation option from the tree control in the left half of the panel.
NoteThe use of the Automatic scaling of text height option is recommended in most instances, at least for a first pass when generating a plot.
Annotation angle offset is most useful when you are plotting a section of a dipping block model. The annotation angle is measured from horizontal, with negative below horizontal and positive above.
If you apply a vertical exaggeration to the section, then you cannot keep the annotation angle the same as the dip of the block model. A rule of thumb (though not exact) for changing the angle, so that the text is parallel to the blocks is that for every whole amount of vertical scaling, add to the current annotation angle the dip of the block model.
For a block model dipping -5°, at no exaggeration, use an annotation angle of -5°. For the same model with a vertical scale of 2x (that is, 1:1200 horizontal and 1:600 vertical), use an annotation angle of -10°. For a vertical scale of 3x, use an angle of -15°
The Status field in the Data Extents panel should no longer contain error messages.
Apply and Run
-
Select the Apply and Run button to create and save the plot file.
A preview of the plot displays in the Plot Utility.
