Stats Tab
Univariate Charts
General Statistics
Provides summary statistics of count, mean, standard deviation, coefficient of variance, maximum, upper quartile, median, lower quartile, and minimum.
Options for additional measures in variance, skewness, kurtosis, range, sum of weights, geometric mean, geometric variance, harmonic mean, logarithmic mean, logarithmic variance, Sichel t statistic, and additional quartile fields.
Histogram
Create a fully customizable histogram.
Cumulative Frequency
Create a cumulative frequency chart.
Bivariate Charts
Note: The following charts require two datasets.
Scatter / Line
Create a scatter plot or line plot.
PP
Create a probability-probability plot.
Create a quantile-quantile plot.
Correlation Matrix
Create a correlation matrix.
Pair Combinations
|
|
All data group pair combinations. |
|
|
First data group verses all others. |

|
Different sources pair combination. |

|
Same source pair combination. |
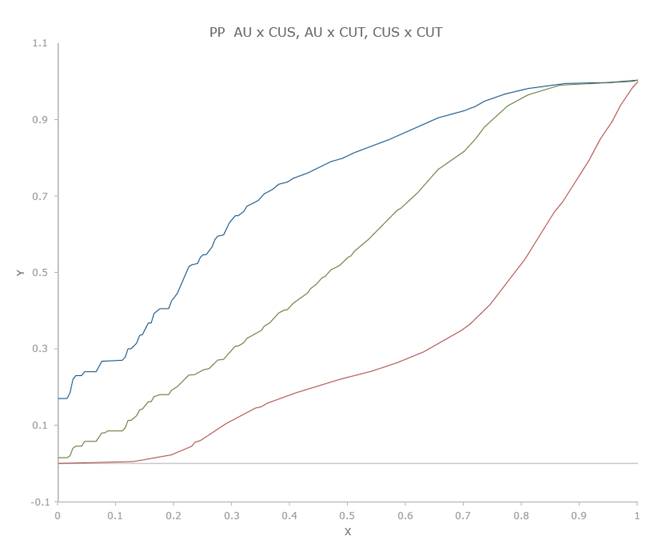
Figure 1: Example of all data group pair combinations.
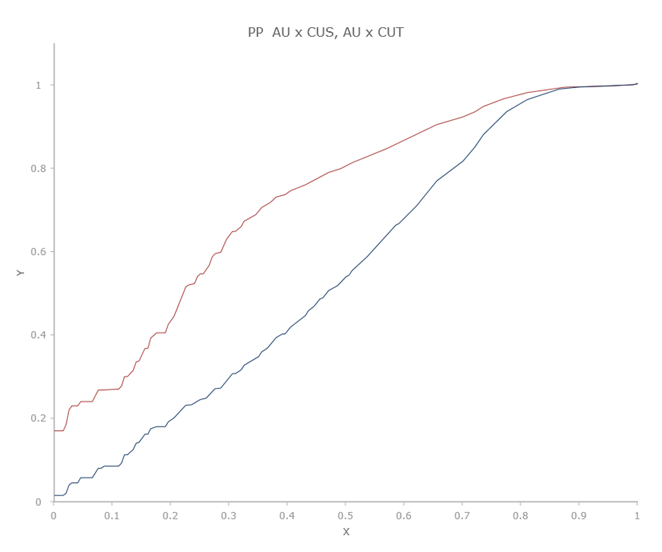
Figure 2: Example of first data group verses all others.
Settings
|
|
All variables on the same chart. |
|
|
Variables on separate charts. |
|
|
All domains on the same chart. |
|
|
Domains on separate charts. |
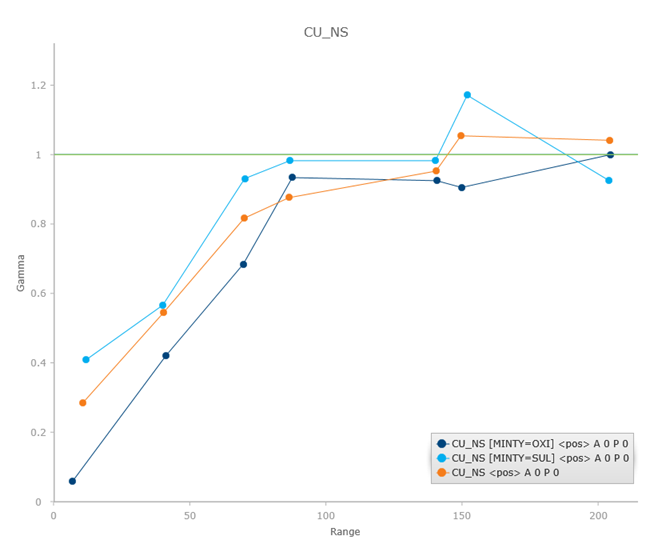
Figure 3: Example of all variables or domains on the same chart.
Figure 4: Example of variables or domains on separate charts.
