Viewing Data Points in Vulcan
Use this option to select data points in the charts to view their geographic location in Vulcan.
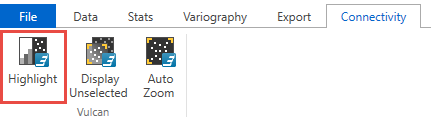
Highlight
Use this feature to visualise the location of sample data in the Vulcan workspace. It can be used to see data from a sample population or a block model.
Note: The samples do not need to be loaded into Vulcan prior to selecting the data from the charts, however, they can be. This may make seeing the highlighted points difficult depending on the colour scheme used to display the samples.
-
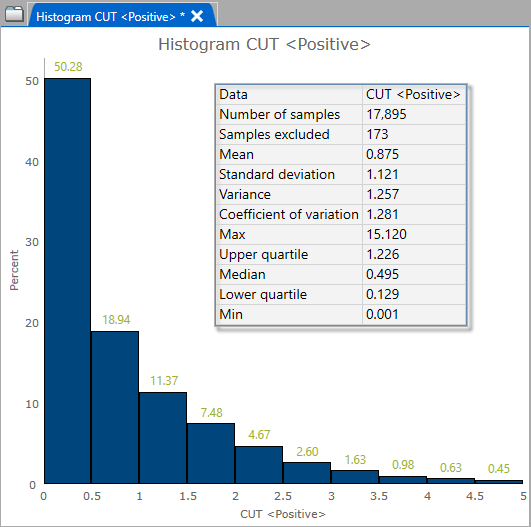
Begin by creating a chart in the Data Analyser.
-
Click the Highlight icon in the ribbon to begin. The icon will turn blue when it is enabled.
-
Next, highlight the data by dragging your mouse to draw a box around the data points, or click one of more of the histogram bars in the active chart.
-
Click outside the selected area in the chart to deselect the data points.
Display Unselected
Click this to display all unselected data points. They will be displayed in grey.
Auto Zoom
Click this to zoom in to the selected data points.
