Gantt Chart Window
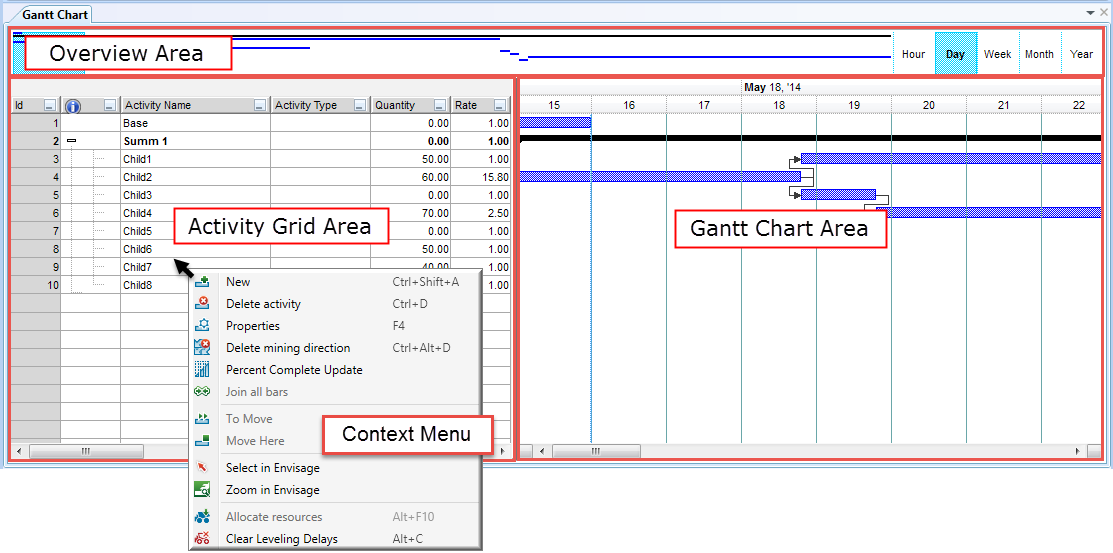
The Gantt Chart window is the visual display of the scheduling information for the project. It includes the following components:
- Activity Grid area with activity and setting information
- Gantt Chart area which serves as a visual chart with timeline and precedence information
- Overview area which includes a visual overview of all activity information over the entire timeline of the project
Was this page helpful?
