Combine Washability Tables
Use this option to combine two different washability tables using dynamically adjusted proportions. It can be used to assess the washability data to maximise product yield by combining the results from two different size-fraction tables.
Instructions
On the Washability menu, click Combine Washability Tables and a context menu prompts for a wash table source.
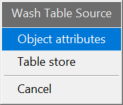
The wash table source can be selected in two ways:
Object attributes
There needs to be some objects loaded on the screen in order to use this option. After selecting Object attributes on the context menu, you will be prompted to select polygon/polyline with wash table attributes. Once you select an object, the following panel is displayed.
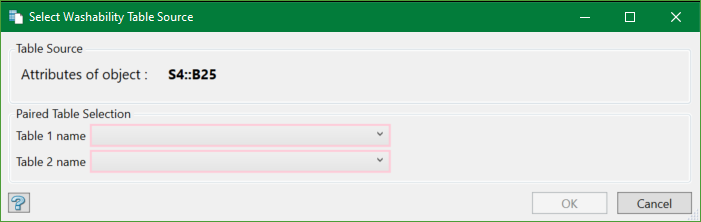
On the panel, you can see the wash table source (object attributes) in bold.
Table Selection
Paired Table Selection
Select two tables that are to be combined from their respective drop-down lists. If there are no tables with attributes, the drop-down list is empty.
Table store
After selecting Table store on the context menu, the following panel is displayed.
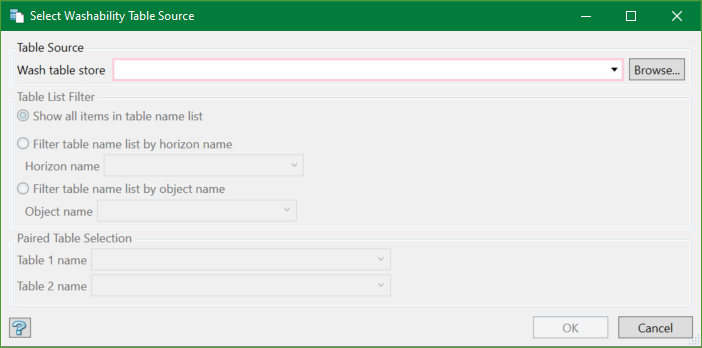
Table Source
Wash table store
Select a wash table store database from the drop-down list or browse from another directory.
Table List Filter
There can be hundreds and thousands of tables in the database. You can apply filters to narrow your search.
- Show all items in table name list - This will list all the available tables in the wash table store database.
- Filter table name list by horizon name - This will filter the list by horizon name. Selecting a particular horizon name will list only the tables related to that horizon.
- Filter table name list by object name - This will filter the list by object name as well. Selecting a particular object will list only the tables related to that object.
Paired Table Selection
Select two tables that are to be combined from their respective drop-down lists. The table list is a result of the filters applied as described in the previous section.
Press OK after selecting the required tables. The following panel is displayed.
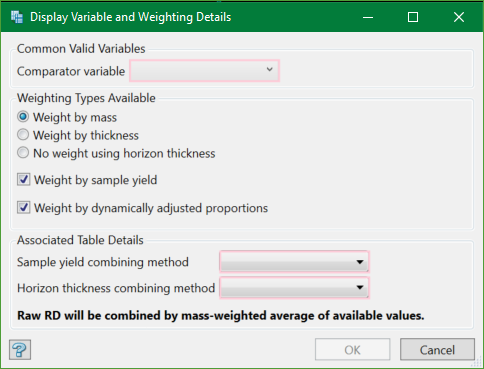
Common Valid Variables
Comparator Variable
Select from the drop-down list the variable that is common across the tables (and valid). This variable will be used for the primary chart display of the combined table and will be monitored for the required characteristics.
Weighting Types Available
Select the method(s) to be used for weighting when combining the tables. All, or any, or none of the methods may be combined.
Weight by mass
Mass will be computed as (horizon-thickness x raw RD) for each contributing table. Where a specific RD value has not been assigned to a table, a raw RD value will be calculated as an approximation from the table's fraction densities and yields.
Weight by thickness
Select this method to weight the combining tables by horizon thickness. You can choose to select a method for horizon thickness combination, namely SUM, AVERAGE, HIGHLEST, or LOWEST. More details in the Horizon thickness combining method.
No weight using horizon thickness
This option excludes horizon thickness while weighting.
Weight by sample yield
Use this option to weight by sample yield when combining the tables. You can choose to select a method for sample yield combination, namely SUM, AVERAGE, HIGHLEST, or LOWEST. More details in the Sample yield combining method.
Weight by dynamically adjusted proportions
Use this option to use dynamically adjusted proportions to combine tables. When using this option, the SUM or AVERAGE will be calculated dynamically.
Associated Table Details
The methods for determining the combination values for details associated with the tables need to be defined according to the derivation of the source tables being combined.
Sample yield combining method
Select the method for combining the sample yields from the drop-down list. There are four of them, namely:
- SUM - Adds them together. Example, if combining tables from different size-fractions of the same sample
- AVERAGE - Calculates the simple average. Example, if combining tables from different samples.
- HIGHEST Uses the highest value. Example, if not all the tables have a value, use the highest available.
- LOWEST Uses the lowest value. Example, if not all the tables have a value, use the lowest non-zero value.
Note: If using dynamic proportions, SUM or AVERAGE will be adjusted accordingly.
Horizon thickness combining method
This uses the same methods as used in Sample yield combining method.
Press OK and the combined graphs table panel is displayed.
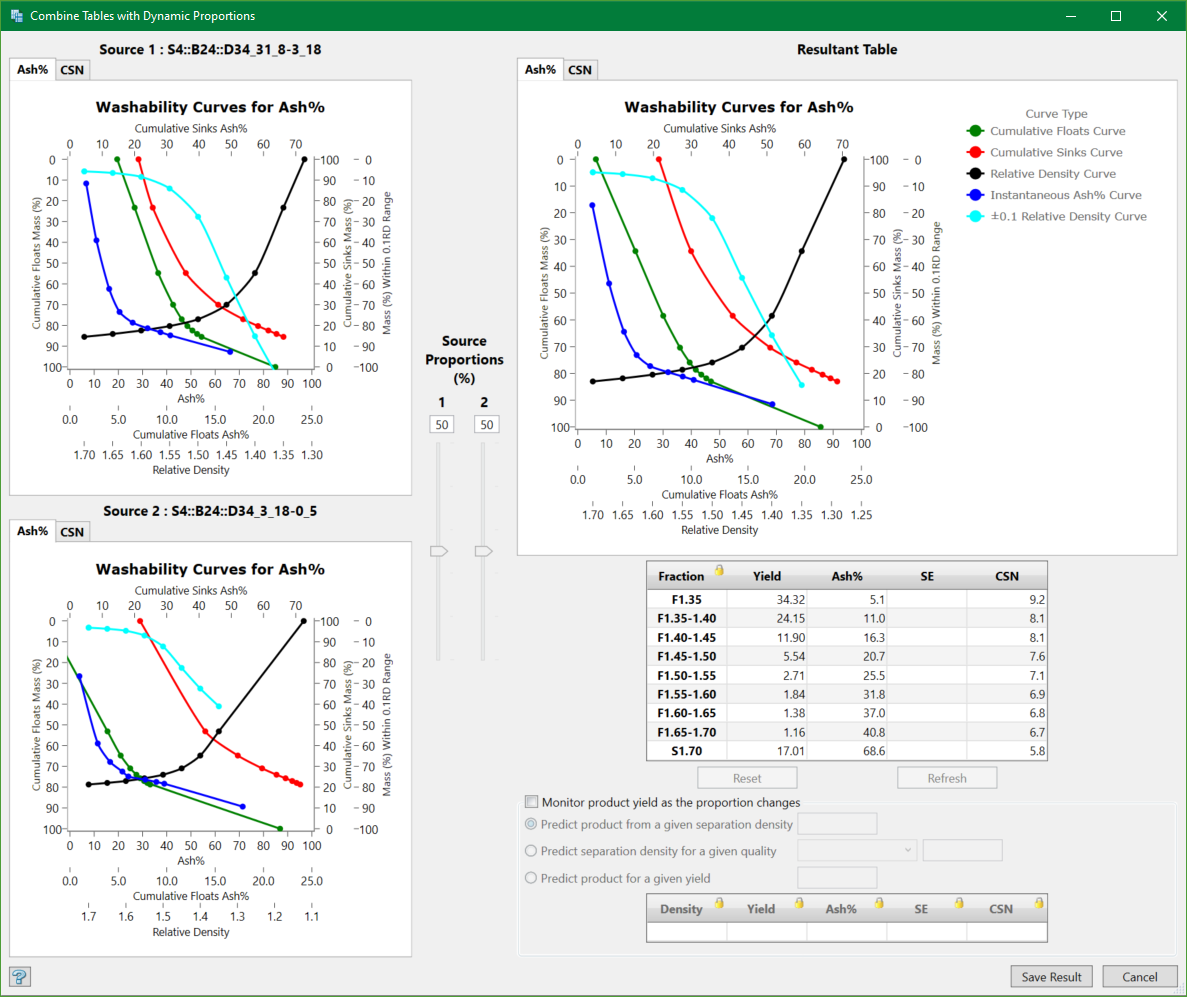
The panel shows the washability graphs of two source tables and the resultant table after combination. The way you view and use this panel is same as in the Report from Washability Table. Additionally, you can monitor product yield on the graphs for dynamically adjusted proportions.
Save Result
Press Save Result button to display the following panel.
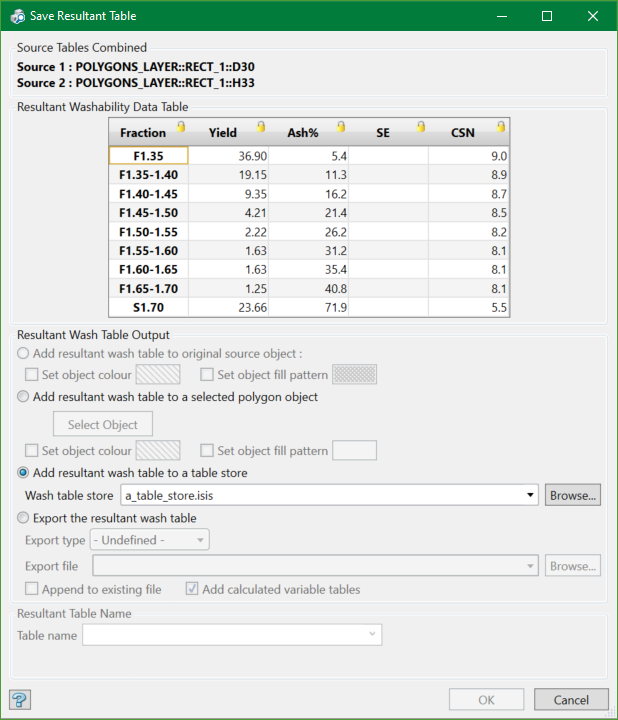
This panel consists of output settings for the resultant table.
Resultant Wash Table Output
You can choose to add the resultant wash table to the original source object or to a selected polygon object and assign custom colours and fill patterns to differentiate the original with the resultant table.
You can also add the resultant table to a table store or export it to a CSV or formatted text file. This Export the resultant wash table option uses the export settings defined in Import/Export Custom Settingsin the Setup menu. You can append the resultant data to an existing file and/or include calculated variable tables to the export file.
Give a name to the resultant table and hit OK.
