Output
Output statistics/graphs to a nominated file
Use the Output option to output calculated statistics/graphs to a nominated Statistics Results file (.srf) and/or a PostScript file (.ps). This option can also be used to convert an existing Statistics Results file into a PostScript file.
Instructions
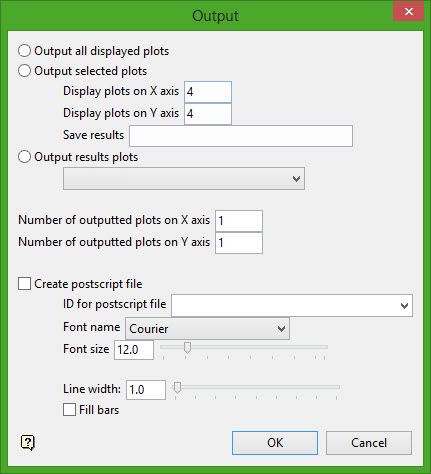
On the Analyse menu, point to Statistics, and then click Output to display the Output panel.
Output all displayed plots
Select this option to output all of the plots that are currently displayed onscreen. The outputted plots will be stored in a Statistics Results file (.srf).
The resulting file, which will be stored in your current working directory, is named using the following naming convention:
<proj><specification name>_<graph ID>_<data ID>.srf
Output selected plots
Select this option to output a selected group of plots. You will need to specify the number of plots on the X and Y axes, as well as the name of the Statistics Results file (.srf) that is used to store the chosen plots.
The resulting file is stored in the current working directory and used the following naming convention:
<proj><file name>.srf
Output results plot
Select this option to output the contents of an existing Statistics Results file (.srf). The drop-down list contains all of the .srf files found in the current working directory.
Number of outputted plots on X/Y axis
Specify the number of plots to display on each page of the resulting Statistics Results file (.srf) and, if applicable, the PostScript file (.ps).
Create postscript file
Select this check box to output the plots to a PostScript file. This option can also be used to convert and display the contents of an existing Statistics Results file.
ID for postscript file
Enter the name of the resulting PostScript file. The resulting file will be stored in your current working directory.
The drop-down list contains all of the Statistics Results files found in your current working directory. If a Statistics Results file is specified, then the resulting PostScript file will be named using the following naming convention:
<Statistics Results file name>.srf.ps
Font
Specify the font that will be applied to the text displayed in the resulting PostScript file. The available drop-down list contains the standard PostScript font types.
Font size
Specify the font size that will be applied to all text displayed in the resulting PostScript file. The font size can either be entered or it can be specified through using the available slider bar.
Line width
Specify the line width that will be applied to all lines displayed in the resulting PostScript file. The line width can either be entered or it can be specified through using the available slider bar.
Fill bars
Select this check box to apply a fill colour (grey) to bars displayed in the resulting PostScript file.
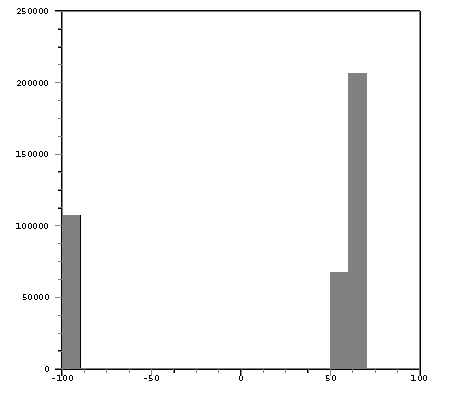
Figure 1: Fill colour applied
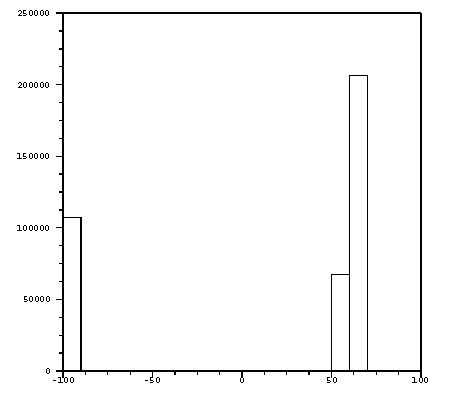
Figure 2: No fill colour
Click OK.
The Statistics Results file and, if applicable, the PostScript file are then generated.
If you chose to only output certain plots, then the screen is first redrawn to take into account the specified number of plots. You will then need to select the required plots. A rectangle will be placed around each selected plot to indicate that it has been chosen.
